Estimated zip code population in 2022: 1,945 Zip code population in 2010: 2,108 Zip code population in 2000: 1,990
March 2022 cost of living index in zip code 46382: 82.3 (low, U.S. average is 100)
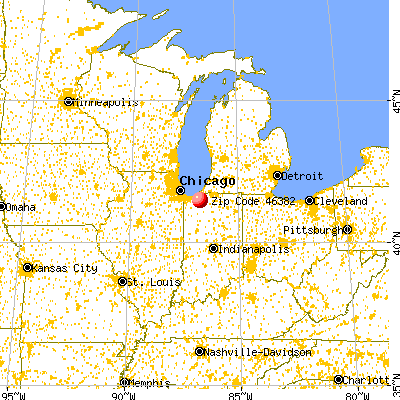
Land area: 48.8 sq. mi. Water area: 0.0 sq. mi.
Population density: 40 people per square mile
(very low).
OSM Map
General Map
Google Map
MSN Map
OSM Map
General Map
Google Map
MSN Map
OSM Map
General Map
Google Map
MSN Map
OSM Map
General Map
Google Map
MSN Map
Please wait while loading the map...
Real estate property taxes paid for housing units in 2022:
This zip code:
0.7% ($1,281)
Indiana:
0.7% ($1,467)
Median real estate property taxes paid for housing units with mortgages in 2022: $859 (0.5%) Median real estate property taxes paid for housing units with no mortgage in 2022: $1,554 (0.7%)
Business Search- 14 Million verified businesses
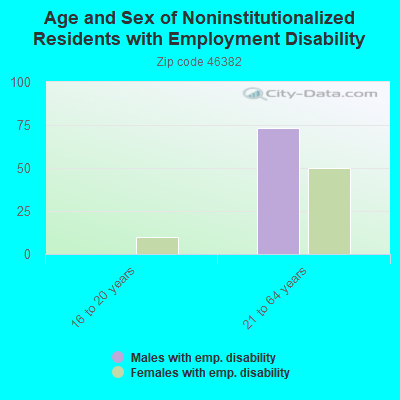
Males: 976
(50.2%)
Females: 969
(49.8%)
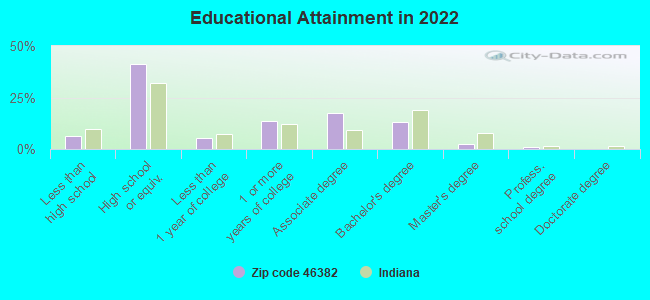
For population 25 years and over in 46382:
High school or higher: 92.5%
Bachelor's degree or higher: 16.1%
Graduate or professional degree: 3.4%
Unemployed: 1.6%
Mean travel time to work (commute): 35.2 minutes
For population 15 years and over in 46382:
Never married: 28.1%
Now married: 56.6%
Separated: 0.0%
Widowed: 0.8%
Divorced: 14.6%
Zip code 46382 compared to state average:
Unemployed percentage below state average.
Black race population percentage significantly below state average.
Hispanic race population percentage significantly below state average.
Median age significantly above state average.
Foreign-born population percentage significantly below state average.
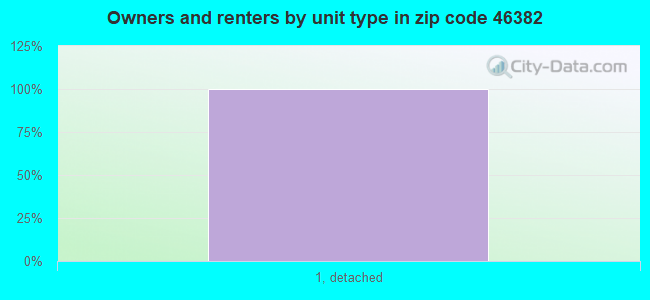
Renting percentage significantly below state average.
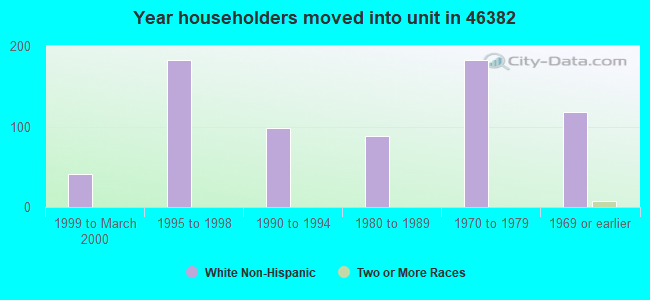
Length of stay since moving in significantly above state average.
Number of college students below state average.
Percentage of population with a bachelor's degree or higher below state average.
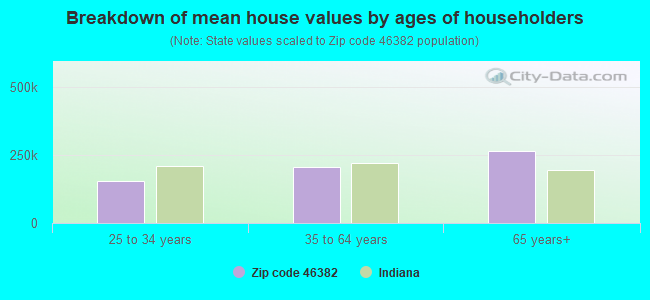
Estimated median house/condo value in 2022: $190,172
46382:
$190,172
Indiana:
$208,700
Median resident age:
This zip code:
47.9 years
Indiana median age:
38.2 years
Average household size:
This zip code:
2.5 people
Indiana:
2.4 people
Averages for the 2020 tax year for zip code 46382, filed in 2021:
Average Adjusted Gross Income (AGI) in 2020: $70,111 (Individual Income Tax Returns)
Here:
$70,111
State:
$64,978
Salary/wage: $58,435 (reported on 81.6% of returns)
Here:
$58,435
State:
$55,245
(% of AGI for various income ranges: 1135.8% for AGIs below $25k, 3030.6% for AGIs $25k-50k, 5600.0% for AGIs $50k-75k, 8820.0% for AGIs $75k-100k, 15021.5% for AGIs $100k-200k)
Taxable interest for individuals: $1,878 (reported on 31.1% of returns)
This zip code:
$1,878
Indiana:
$1,351
(% of AGI for various income ranges: 12.6% for AGIs below $25k, 14.7% for AGIs $25k-50k, 61.3% for AGIs $50k-75k, 111.0% for AGIs $75k-100k, 122.3% for AGIs $100k-200k)
Ordinary dividends: $2,805 (reported on 18.4% of returns)
Here:
$2,805
State:
$5,827
(% of AGI for various income ranges: 8.9% for AGIs below $25k, 10.0% for AGIs $25k-50k, 72.7% for AGIs $50k-75k, 53.0% for AGIs $75k-100k, 115.4% for AGIs $100k-200k)
Net capital gain/loss in AGI: +$4,994 (reported on 16.5% of returns)
Here:
+$4,994
State:
+$17,730
(% of AGI for various income ranges: 21.6% for AGIs below $25k, 50.0% for AGIs $50k-75k, 267.0% for AGIs $75k-100k, 358.5% for AGIs $100k-200k)
Profit/loss from business: +$13,667 (reported on 11.7% of returns)
Here:
+$13,667
State:
+$12,144
(% of AGI for various income ranges: 115.3% for AGIs below $25k, 415.9% for AGIs $25k-50k, 280.0% for AGIs $75k-100k, 333.8% for AGIs $100k-200k)
Taxable individual retirement arrangement distribution: $14,445 (reported on 10.7% of returns)
46382:
$14,445
Indiana:
$18,302
(% of AGI for various income ranges: 151.1% for AGIs below $25k, 214.0% for AGIs $50k-75k, 244.0% for AGIs $75k-100k, 566.9% for AGIs $100k-200k)
Total itemized deductions: $37,367 (reported on 2.9% of returns)
Here:
$37,367
State:
$35,601
(% of AGI for various income ranges: 862.3% for AGIs $100k-200k)
Charity contributions: $6,500 (reported on 1.9% of returns)
Here:
$6,500
State:
$15,596
(% of AGI for various income ranges: 76.5% for AGIs $25k-50k)
Taxes paid: $8,333 (reported on 2.9% of returns)
46382:
$8,333
State:
$7,542
(% of AGI for various income ranges: 192.3% for AGIs $100k-200k)
Earned income credit: $2,070 (reported on 9.7% of returns)
Here:
$2,070
State:
$2,298
(% of AGI for various income ranges: 72.1% for AGIs below $25k, 41.2% for AGIs $25k-50k)
Percentage of individuals using paid preparers for their 2020 taxes: 96.1%
Here:
96%
State:
94%
(% for various income ranges: 92.6% for AGIs below $25k, 95.0% for AGIs $25k-50k, 100.0% for AGIs $50k-75k, 100.0% for AGIs $75k-100k, 95.0% for AGIs $100k-200k, 100.0% for AGIs over 200k)
Averages for the 2012 tax year for zip code 46382, filed in 2013:
Average Adjusted Gross Income (AGI) in 2012: $58,718 (Individual Income Tax Returns)
Here:
$58,718
State:
$52,932
Salary/wage: $48,920 (reported on 80.2% of returns)
Here:
$48,920
State:
$45,173
(% of AGI for various income ranges: 67.7% for AGIs below $25k, 69.3% for AGIs $25k-50k, 74.2% for AGIs $50k-75k, 77.5% for AGIs $75k-100k, 89.5% for AGIs $100k-200k)
Taxable interest for individuals: $1,153 (reported on 33.7% of returns)
This zip code:
$1,153
Indiana:
$1,311
(% of AGI for various income ranges: 1.3% for AGIs below $25k, 1.0% for AGIs $25k-50k, 0.4% for AGIs $50k-75k, 0.6% for AGIs $75k-100k, 0.7% for AGIs $100k-200k, 0.5% for AGIs over 200k)
Ordinary dividends: $2,341 (reported on 16.8% of returns)
Here:
$2,341
State:
$4,690
(% of AGI for various income ranges: 0.5% for AGIs below $25k, 1.4% for AGIs $25k-50k, 0.4% for AGIs $50k-75k, 1.0% for AGIs $75k-100k, 0.7% for AGIs $100k-200k)
Net capital gain/loss in AGI: +$3,814 (reported on 13.9% of returns)
Here:
+$3,814
State:
+$10,406
(% of AGI for various income ranges: 0.6% for AGIs $25k-50k, 0.3% for AGIs $50k-75k, 0.4% for AGIs $75k-100k, 2.7% for AGIs $100k-200k)
Profit/loss from business: +$14,400 (reported on 11.9% of returns)
Here:
+$14,400
State:
+$11,105
(% of AGI for various income ranges: 4.3% for AGIs below $25k, 5.7% for AGIs $25k-50k, 3.5% for AGIs $50k-75k, 6.2% for AGIs $75k-100k)
Taxable individual retirement arrangement distribution: $10,236 (reported on 10.9% of returns)
46382:
$10,236
Indiana:
$13,841
(% of AGI for various income ranges: 7.3% for AGIs below $25k, 2.6% for AGIs $50k-75k, 4.7% for AGIs $75k-100k)
Total itemized deductions: $18,073 (17% of AGI, reported on 25.7% of returns)
Here:
$18,073
State:
$20,913
Here:
17.4% of AGI
State:
18.2% of AGI
(% of AGI for various income ranges: 6.2% for AGIs below $25k, 5.0% for AGIs $25k-50k, 7.8% for AGIs $50k-75k, 8.6% for AGIs $75k-100k, 10.5% for AGIs $100k-200k, 6.0% for AGIs over 200k)
Charity contributions: $2,339 (reported on 17.8% of returns)
Here:
$2,339
State:
$4,697
(% of AGI for various income ranges: 0.9% for AGIs below $25k, 0.8% for AGIs $50k-75k, 0.7% for AGIs $75k-100k, 1.3% for AGIs $100k-200k)
Taxes paid: $6,331 (reported on 25.7% of returns)
46382:
$6,331
State:
$7,456
(% of AGI for various income ranges: 2.0% for AGIs $25k-50k, 2.3% for AGIs $50k-75k, 2.6% for AGIs $75k-100k, 3.9% for AGIs $100k-200k, 3.6% for AGIs over 200k)
Earned income credit: $2,273 (reported on 10.9% of returns)
Here:
$2,273
State:
$2,265
(% of AGI for various income ranges: 4.9% for AGIs below $25k, 0.7% for AGIs $25k-50k)
Percentage of individuals using paid preparers for their 2012 taxes: 58.4%
Here:
58%
State:
53%
(% for various income ranges: 48.5% for AGIs below $25k, 68.2% for AGIs $25k-50k, 55.6% for AGIs $50k-75k, 61.5% for AGIs $75k-100k, 58.3% for AGIs $100k-200k, 100.0% for AGIs over 200k)
Averages for the 2004 tax year for zip code 46382, filed in 2005:
Average Adjusted Gross Income (AGI) in 2004: $45,672 (Individual Income Tax Returns)
Here:
$45,672
State:
$44,790
Salary/wage: $40,881 (reported on 81.8% of returns)
Here:
$40,881
State:
$39,615
(% of AGI for various income ranges: 81.7% for AGIs below $10k, 69.9% for AGIs $10k-25k, 73.1% for AGIs $25k-50k, 79.7% for AGIs $50k-75k, 81.2% for AGIs $75k-100k, 59.6% for AGIs over 100k)
Taxable interest for individuals: $1,478 (reported on 50.8% of returns)
This zip code:
$1,478
Indiana:
$1,535
(% of AGI for various income ranges: 6.9% for AGIs below $10k, 3.8% for AGIs $10k-25k, 2.2% for AGIs $25k-50k, 1.1% for AGIs $50k-75k, 0.9% for AGIs $75k-100k, 1.2% for AGIs over 100k)
Taxable dividends: $1,354 (reported on 20.4% of returns)
Here:
$1,354
State:
$2,998
(% of AGI for various income ranges: 2.0% for AGIs below $10k, 1.7% for AGIs $10k-25k, 0.7% for AGIs $25k-50k, 0.3% for AGIs $50k-75k, 0.8% for AGIs $75k-100k, 0.3% for AGIs over 100k)
Net capital gain/loss: +$2,560 (reported on 15.9% of returns)
Here:
+$2,560
State:
+$8,619
(% of AGI for various income ranges: -3.4% for AGIs below $10k, 2.6% for AGIs $10k-25k, 0.1% for AGIs $25k-50k, 0.7% for AGIs $50k-75k, -0.1% for AGIs $75k-100k, 2.4% for AGIs over 100k)
Profit/loss from business: +$8,148 (reported on 12.2% of returns)
Here:
+$8,148
State:
+$10,071
(% of AGI for various income ranges: 2.7% for AGIs $10k-25k, 5.0% for AGIs $25k-50k, 2.8% for AGIs $50k-75k, 0.6% for AGIs $75k-100k)
Profit/loss from farming: +$15,580 (reported on 5.3% of returns)
Here:
+$15,580
State:
-$2,212
IRA payment deduction: $3,136 (reported on 2.3% of returns)
46382:
$3,136
Indiana:
$2,840
Total itemized deductions: $13,952 (19% of AGI, reported on 28.6% of returns)
Here:
$13,952
State:
$17,065
Here:
19.0% of AGI
State:
19.5% of AGI
(% of AGI for various income ranges: 8.6% for AGIs $10k-25k, 8.9% for AGIs $25k-50k, 9.3% for AGIs $50k-75k, 8.6% for AGIs $75k-100k, 8.6% for AGIs over 100k)
Charity contributions deductions: $1,540 (2% of AGI, reported on 23.8% of returns)
Here:
$1,540
State:
$3,550
Here:
2.1% of AGI
State:
3.8% of AGI
(% of AGI for various income ranges: 0.6% for AGIs $10k-25k, 0.7% for AGIs $25k-50k, 0.8% for AGIs $50k-75k, 0.7% for AGIs $75k-100k, 1.1% for AGIs over 100k)
Total tax: $6,143 (reported on 79.5% of returns)
46382:
$6,143
State:
$6,914
(% of AGI for various income ranges: 2.2% for AGIs below $10k, 4.4% for AGIs $10k-25k, 7.3% for AGIs $25k-50k, 8.8% for AGIs $50k-75k, 11.1% for AGIs $75k-100k, 18.7% for AGIs over 100k)
Earned income credit: $1,620 (reported on 8.4% of returns)
Here:
$1,620
State:
$1,685
Percentage of individuals using paid preparers for their 2004 taxes: 63.3%
Here:
63%
State:
59%
(% for various income ranges: 48.7% for AGIs below $10k, 66.9% for AGIs $10k-25k, 69.2% for AGIs $25k-50k, 59.8% for AGIs $50k-75k, 63.2% for AGIs $75k-100k, 76.9% for AGIs over 100k)
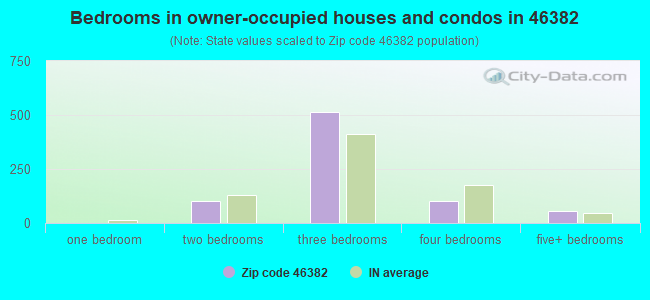
Size of family households: 269 2-persons, 61 3-persons, 87 4-persons, 60 5-persons, 8 6-persons, 11 7-or-more-persons
Size of nonfamily households: 127 1-person, 51 2-persons, 87 3-persons
278 married couples with children.
0 single-parent households ().
98.9% of residents of 46382 zip code speak English at home.
0.4% of residents speak Spanish at home (100% very well).
Foreign born population: 0 (0.0%)
:
0.0%
Whole state:
6.1%
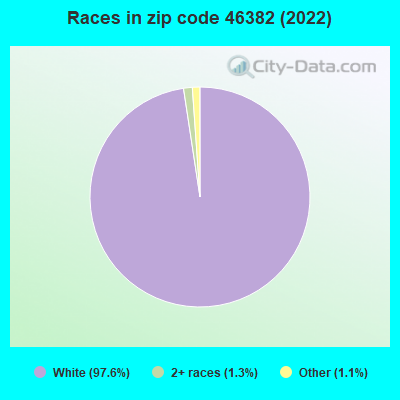
46%German
19%Polish
8%Swedish
7%American
5%English
3%Norwegian
2%European
Facilities with environmental interests located in this zip code:
SATELLITE INN (603 WATER ST in UNION MILLS, IN)
(Integrated Compliance Information System) - ICIS-05-2000-0339, FORMAL ENFORCEMENT ACTION STATE MASTER (Indiana facility tracking) Business SIC classification: HOTELS AND MOTELS
MENKE'S INC. (4902 W. SAND RD in UNION MILLS, IN)
(Integrated Compliance Information System) - ICIS-05-1997-0498, FORMAL ENFORCEMENT ACTION STATE MASTER (Indiana facility tracking)
CSX TRANSPORTATION (1001 HAMILTON ST in UNION MILLS, IN)
STATE MASTER (Indiana facility tracking) Conditionally Exempt Small Quantity Generators, less than 100 kg/month of hazardous waste (Resource Conservation and Recovery Act (tracking hazardous waste)) - notification Organizations: CSX TRANSPORTATION INC (CONTACT/OWNER)
56.0%Utility gas
32.7%Bottled, tank, or LP gas
4.8%Electricity
4.4%Other fuel
2.5%Wood
Population in 1990: 3,155.
Place of birth for U.S.-born residents:
This state: 1,717
Northeast: 6
Midwest: 94
South: 109
71% of the 46382 zip code residents lived in the same house 5 years ago. Out of people who lived in different houses, 61% lived in this county. Out of people who lived in different counties, 50% lived in Indiana.
101% of the 46382 zip code residents lived in the same house 1 year ago.
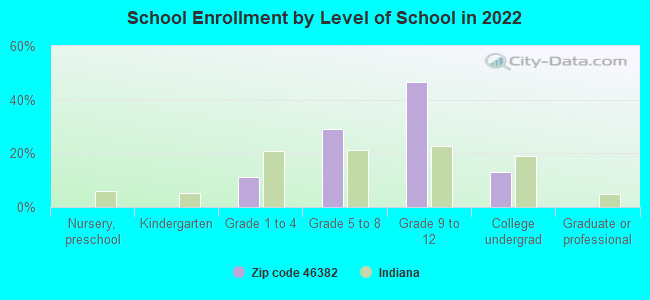
Private vs. public school enrollment:
Students in private schools in grades 1 to 8 (elementary and middle school): 33
Here:
21.3%
Indiana:
14.9%
Students in private schools in grades 9 to 12 (high school): 71
Here:
39.2%
Indiana:
11.4%
Students in private undergraduate colleges: 11
Here:
22.2%
Indiana:
22.3%
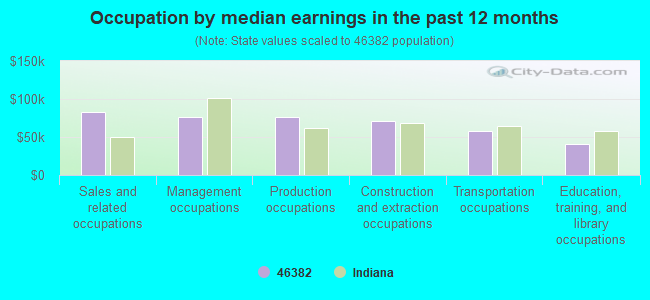
Occupation by median earnings in the past 12 months ($)
82,454Sales and related occupations
76,471Management occupations
75,675Production occupations
71,170Construction and extraction occupations
57,275Transportation occupations
41,261Education, training, and library occupations
Top industries in this zip code by the number of employees in 2005:
Construction: Poured Concrete Foundation and Structure Contractors (20-49 employees: 1 establishment)
Educational Services: Apprenticeship Training (10-19: 1)
Construction: Other Building Equipment Contractors (10-19: 1)
Accommodation and Food Services: Full-Service Restaurants (5-9: 2)
Construction: Site Preparation Contractors (5-9: 1)
Other Services (except Public Administration): Civic and Social Organizations (5-9: 1)
Home Mortgage Disclosure Act Aggregated Statistics For Year 2009 (Based on 4 partial tracts)
A) FHA, FSA/RHS & VA Home Purchase Loans
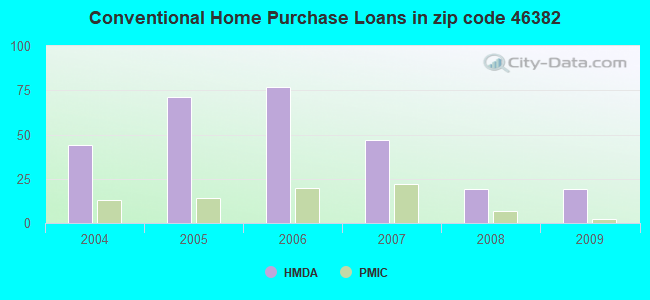
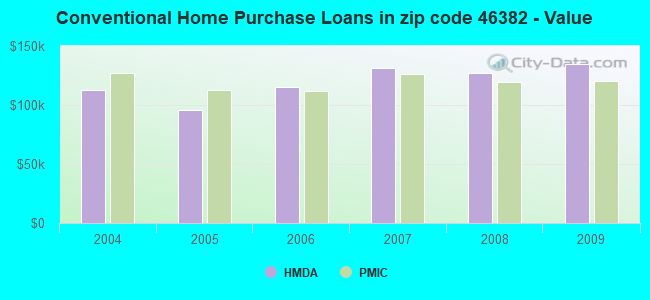
B) Conventional Home Purchase Loans
C) Refinancings
D) Home Improvement Loans
F) Non-occupant Loans on < 5 Family Dwellings (A B C & D)
G) Loans On Manufactured Home Dwelling (A B C & D)
Number
Average Value
Number
Average Value
Number
Average Value
Number
Average Value
Number
Average Value
Number
Average Value
LOANS ORIGINATED
22
$113,441
19
$134,623
133
$127,341
11
$40,913
4
$103,768
10
$108,900
APPLICATIONS APPROVED, NOT ACCEPTED
1
$111,640
1
$160,940
25
$138,944
1
$98,520
0
$0
3
$79,550
APPLICATIONS DENIED
3
$143,797
2
$111,105
38
$145,208
4
$13,848
3
$184,977
2
$90,355
APPLICATIONS WITHDRAWN
2
$138,490
2
$81,280
21
$122,574
0
$0
1
$64,040
2
$130,540
FILES CLOSED FOR INCOMPLETENESS
0
$0
0
$0
11
$123,437
2
$82,695
1
$217,730
2
$101,085
Aggregated Statistics For Year 2008 (Based on 4 partial tracts)
A) FHA, FSA/RHS & VA Home Purchase Loans
B) Conventional Home Purchase Loans
C) Refinancings
D) Home Improvement Loans
E) Loans on Dwellings For 5+ Families
F) Non-occupant Loans on < 5 Family Dwellings (A B C & D)
G) Loans On Manufactured Home Dwelling (A B C & D)
Number
Average Value
Number
Average Value
Number
Average Value
Number
Average Value
Number
Average Value
Number
Average Value
Number
Average Value
LOANS ORIGINATED
12
$117,017
19
$127,192
68
$118,518
14
$42,245
1
$248,190
5
$183,832
5
$106,242
APPLICATIONS APPROVED, NOT ACCEPTED
1
$121,380
5
$110,136
16
$110,181
3
$16,547
0
$0
1
$115,260
0
$0
APPLICATIONS DENIED
3
$76,287
5
$104,008
66
$125,974
16
$48,519
0
$0
2
$84,345
5
$65,240
APPLICATIONS WITHDRAWN
0
$0
3
$77,123
13
$154,829
0
$0
0
$0
0
$0
2
$84,235
FILES CLOSED FOR INCOMPLETENESS
0
$0
0
$0
5
$112,214
0
$0
0
$0
0
$0
1
$37,440
Aggregated Statistics For Year 2007 (Based on 4 partial tracts)
A) FHA, FSA/RHS & VA Home Purchase Loans
B) Conventional Home Purchase Loans
C) Refinancings
D) Home Improvement Loans
F) Non-occupant Loans on < 5 Family Dwellings (A B C & D)
G) Loans On Manufactured Home Dwelling (A B C & D)
Number
Average Value
Number
Average Value
Number
Average Value
Number
Average Value
Number
Average Value
Number
Average Value
LOANS ORIGINATED
10
$138,525
47
$131,386
85
$109,808
27
$44,630
8
$81,192
8
$133,208
APPLICATIONS APPROVED, NOT ACCEPTED
1
$137,280
3
$186,627
22
$104,907
4
$20,532
0
$0
1
$77,830
APPLICATIONS DENIED
1
$77,560
5
$172,562
61
$108,259
21
$50,951
3
$66,710
5
$121,748
APPLICATIONS WITHDRAWN
1
$139,900
2
$156,985
20
$128,790
3
$47,870
0
$0
1
$132,020
FILES CLOSED FOR INCOMPLETENESS
0
$0
1
$121,380
13
$131,366
0
$0
0
$0
0
$0
Aggregated Statistics For Year 2006 (Based on 4 partial tracts)
A) FHA, FSA/RHS & VA Home Purchase Loans
B) Conventional Home Purchase Loans
C) Refinancings
D) Home Improvement Loans
F) Non-occupant Loans on < 5 Family Dwellings (A B C & D)
G) Loans On Manufactured Home Dwelling (A B C & D)
Number
Average Value
Number
Average Value
Number
Average Value
Number
Average Value
Number
Average Value
Number
Average Value
LOANS ORIGINATED
10
$113,494
77
$114,856
71
$91,574
21
$50,007
8
$114,975
9
$100,417
APPLICATIONS APPROVED, NOT ACCEPTED
0
$0
9
$80,553
13
$133,448
5
$35,900
0
$0
3
$86,277
APPLICATIONS DENIED
0
$0
18
$92,496
72
$123,810
11
$32,944
4
$206,718
11
$83,024
APPLICATIONS WITHDRAWN
1
$237,530
8
$149,262
41
$129,744
2
$91,730
1
$570,640
2
$128,615
FILES CLOSED FOR INCOMPLETENESS
0
$0
2
$282,015
14
$109,081
0
$0
0
$0
0
$0
Aggregated Statistics For Year 2005 (Based on 4 partial tracts)
A) FHA, FSA/RHS & VA Home Purchase Loans
B) Conventional Home Purchase Loans
C) Refinancings
D) Home Improvement Loans
F) Non-occupant Loans on < 5 Family Dwellings (A B C & D)
G) Loans On Manufactured Home Dwelling (A B C & D)
Number
Average Value
Number
Average Value
Number
Average Value
Number
Average Value
Number
Average Value
Number
Average Value
LOANS ORIGINATED
15
$108,796
71
$95,656
90
$100,194
26
$36,640
12
$66,436
24
$94,785
APPLICATIONS APPROVED, NOT ACCEPTED
1
$77,830
9
$115,987
18
$88,420
6
$66,125
0
$0
4
$78,235
APPLICATIONS DENIED
2
$97,445
18
$76,437
96
$99,171
17
$43,393
2
$45,070
8
$83,404
APPLICATIONS WITHDRAWN
3
$94,900
13
$85,988
56
$105,588
6
$74,750
0
$0
8
$92,272
FILES CLOSED FOR INCOMPLETENESS
0
$0
3
$76,830
8
$106,225
0
$0
1
$54,190
1
$72,900
Aggregated Statistics For Year 2004 (Based on 4 partial tracts)
A) FHA, FSA/RHS & VA Home Purchase Loans
B) Conventional Home Purchase Loans
C) Refinancings
D) Home Improvement Loans
F) Non-occupant Loans on < 5 Family Dwellings (A B C & D)
G) Loans On Manufactured Home Dwelling (A B C & D)
Detailed PMIC statistics for the following Tracts:0427.00
, 0428.00
2003 - 2018 National Fire Incident Reporting System (NFIRS) incidents
According to the data from the years 2003 - 2018 the average number of fire incidents per year is 7. The highest number of fire incidents - 14 took place in 2007, and the least - 0 in 2014. The data has a rising trend.
When looking into fire subcategories, the most incidents belonged to: Structure Fires (49.1%), and Outside Fires (36.6%).
Fire incident types reported to NFIRS in Zip Code 46382


+$15,580
-$2,212
 Nearest zip codes: 46346, 46340, 46345, 46390, 46350, 46532.


 According to the data from the years 2003 - 2018 the average number of fire incidents per year is 7. The highest number of fire incidents - 14 took place in 2007, and the least - 0 in 2014. The data has a rising trend.
 When looking into fire subcategories, the most incidents belonged to: Structure Fires (49.1%), and Outside Fires (36.6%).