Estimated zip code population in 2022: 541 Zip code population in 2010: 597 Zip code population in 2000: 581
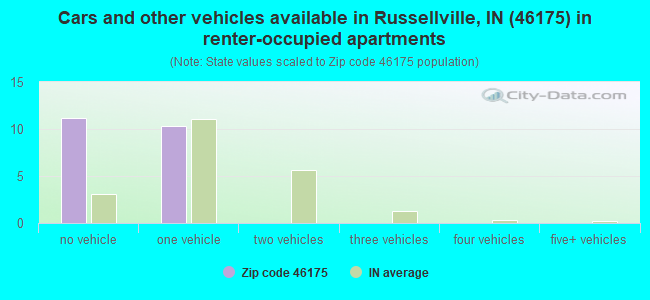
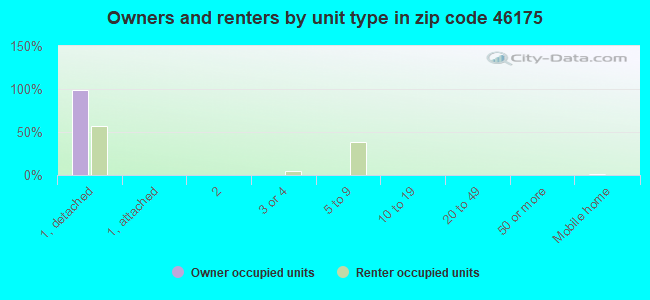
Houses and condos: 278 Renter-occupied apartments: 21
% of renters here:
9%
State:
29%
March 2022 cost of living index in zip code 46175: 85.2 (less than average, U.S. average is 100)
Land area: 22.3 sq. mi. Water area: 0.0 sq. mi.
Population density: 24 people per square mile
(very low).
OSM Map
General Map
Google Map
MSN Map
OSM Map
General Map
Google Map
MSN Map
OSM Map
General Map
Google Map
MSN Map
OSM Map
General Map
Google Map
MSN Map
Please wait while loading the map...
Real estate property taxes paid for housing units in 2022:
This zip code:
0.7% ($1,138)
Indiana:
0.7% ($1,467)
Median real estate property taxes paid for housing units with mortgages in 2022: $851 (0.8%) Median real estate property taxes paid for housing units with no mortgage in 2022: $1,472 (2.8%)
Estimated median house/condo value in 2022: $174,371
46175:
$174,371
Indiana:
$208,700
Median resident age:
This zip code:
40.7 years
Indiana median age:
38.2 years
Average household size:
This zip code:
2.3 people
Indiana:
2.4 people
Averages for the 2020 tax year for zip code 46175, filed in 2021:
Average Adjusted Gross Income (AGI) in 2020: $48,648 (Individual Income Tax Returns)
Here:
$48,648
State:
$64,978
Salary/wage: $45,374 (reported on 85.2% of returns)
Here:
$45,374
State:
$55,245
(% of AGI for various income ranges: 1205.7% for AGIs below $25k, 2931.7% for AGIs $25k-50k, 7723.3% for AGIs $50k-75k, 6212.5% for AGIs $75k-100k)
Taxable interest for individuals: $212 (reported on 29.6% of returns)
This zip code:
$212
Indiana:
$1,351
(% of AGI for various income ranges: 7.1% for AGIs below $25k, 13.3% for AGIs $25k-50k, 10.0% for AGIs $75k-100k)
Ordinary dividends: $1,250 (reported on 14.8% of returns)
Here:
$1,250
State:
$5,827
(% of AGI for various income ranges: 166.7% for AGIs $50k-75k)
Net capital gain/loss in AGI: +$1,633 (reported on 11.1% of returns)
Here:
+$1,633
State:
+$17,730
(% of AGI for various income ranges: 81.7% for AGIs $25k-50k)
Earned income credit: $1,575 (reported on 14.8% of returns)
Here:
$1,575
State:
$2,298
(% of AGI for various income ranges: 90.0% for AGIs below $25k)
Percentage of individuals using paid preparers for their 2020 taxes: 92.6%
Here:
93%
State:
94%
(% for various income ranges: 90.0% for AGIs below $25k, 85.7% for AGIs $25k-50k, 100.0% for AGIs $50k-75k, 100.0% for AGIs $75k-100k, 100.0% for AGIs $100k-200k)
Averages for the 2012 tax year for zip code 46175, filed in 2013:
Average Adjusted Gross Income (AGI) in 2012: $43,388 (Individual Income Tax Returns)
Here:
$43,388
State:
$52,932
Salary/wage: $41,414 (reported on 84.0% of returns)
Here:
$41,414
State:
$45,173
(% of AGI for various income ranges: 69.9% for AGIs below $25k, 83.2% for AGIs $25k-50k, 90.9% for AGIs $50k-75k, 75.7% for AGIs $75k-100k)
Taxable interest for individuals: $250 (reported on 32.0% of returns)
This zip code:
$250
Indiana:
$1,311
(% of AGI for various income ranges: 0.6% for AGIs below $25k, 0.3% for AGIs $25k-50k)
Ordinary dividends: $850 (reported on 16.0% of returns)
Here:
$850
State:
$4,690
Profit/loss from business: +$4,700 (reported on 12.0% of returns)
Here:
+$4,700
State:
+$11,105
Total itemized deductions: $13,125 (17% of AGI, reported on 16.0% of returns)
Here:
$13,125
State:
$20,913
Here:
17.2% of AGI
State:
18.2% of AGI
Charity contributions: $1,800 (reported on 8.0% of returns)
Here:
$1,800
State:
$4,697
Taxes paid: $4,825 (reported on 16.0% of returns)
46175:
$4,825
State:
$7,456
Earned income credit: $2,150 (reported on 16.0% of returns)
Here:
$2,150
State:
$2,265
(% of AGI for various income ranges: 6.6% for AGIs below $25k)
Percentage of individuals using paid preparers for their 2012 taxes: 68.0%
Here:
68%
State:
53%
(% for various income ranges: 60.0% for AGIs below $25k, 71.4% for AGIs $25k-50k, 75.0% for AGIs $50k-75k, 75.0% for AGIs $75k-100k)
Averages for the 2004 tax year for zip code 46175, filed in 2005:
Average Adjusted Gross Income (AGI) in 2004: $34,021 (Individual Income Tax Returns)
Here:
$34,021
State:
$44,790
Salary/wage: $32,498 (reported on 85.8% of returns)
Here:
$32,498
State:
$39,615
(% of AGI for various income ranges: 78.9% for AGIs below $10k, 70.8% for AGIs $10k-25k, 84.6% for AGIs $25k-50k, 76.4% for AGIs $50k-75k, 89.3% for AGIs $75k-100k)
Taxable interest for individuals: $736 (reported on 43.4% of returns)
This zip code:
$736
Indiana:
$1,535
(% of AGI for various income ranges: 6.1% for AGIs below $10k, 1.5% for AGIs $10k-25k, 0.6% for AGIs $25k-50k, 1.4% for AGIs $50k-75k, 0.1% for AGIs $75k-100k)
Taxable dividends: $736 (reported on 18.4% of returns)
Here:
$736
State:
$2,998
(% of AGI for various income ranges: 2.9% for AGIs below $10k, 0.8% for AGIs $25k-50k, 0.2% for AGIs $50k-75k, 0.1% for AGIs $75k-100k)
Net capital gain/loss: +$500 (reported on 9.0% of returns)
Here:
+$500
State:
+$8,619
Profit/loss from business: +$3,581 (reported on 10.8% of returns)
Here:
+$3,581
State:
+$10,071
Total itemized deductions: $13,647 (22% of AGI, reported on 17.7% of returns)
Here:
$13,647
State:
$17,065
Here:
21.6% of AGI
State:
19.5% of AGI
Charity contributions deductions: $1,031 (1% of AGI, reported on 11.1% of returns)
Here:
$1,031
State:
$3,550
Here:
1.5% of AGI
State:
3.8% of AGI
Total tax: $4,100 (reported on 69.4% of returns)
46175:
$4,100
State:
$6,914
(% of AGI for various income ranges: 0.4% for AGIs below $10k, 4.7% for AGIs $10k-25k, 5.9% for AGIs $25k-50k, 9.2% for AGIs $50k-75k, 12.8% for AGIs $75k-100k)
Earned income credit: $1,667 (reported on 17.7% of returns)
Here:
$1,667
State:
$1,685
Percentage of individuals using paid preparers for their 2004 taxes: 71.9%
Here:
72%
State:
59%
(% for various income ranges: 60.6% for AGIs below $10k, 73.8% for AGIs $10k-25k, 77.0% for AGIs $25k-50k, 79.1% for AGIs $50k-75k, 66.7% for AGIs $75k-100k)
Household received Food Stamps/SNAP in the past 12 months: 49 Household did not receive Food Stamps/SNAP in the past 12 months: 186
Women who had a birth in the past 12 months: 9 (10 now married, 0 unmarried) Women who did not have a birth in the past 12 months: 115 (61 now married, 53 unmarried)
Housing units in zip code 46175 with a mortgage: 110 (3 second mortgage, 3 both second mortgage and home equity loan) Median monthly owner costs for units with a mortgage: $1,117 Median monthly owner costs for units without a mortgage: $566
Residents with income below the poverty level in 2022:
This zip code:
19.6%
Whole state:
12.6%
Residents with income below 50% of the poverty level in 2022:
This zip code:
9.4%
Whole state:
6.3%
Median number of rooms in houses and condos:
Here:
7.0
State:
6.6
Median number of rooms in apartments:
Here:
5.2
State:
4.3
Notable locations in this zip code not listed on our city pages
Size of family households: 110 2-persons, 33 3-persons, 15 4-persons, 10 5-persons, 10 7-or-more-persons
Size of nonfamily households: 52 1-person, 3 2-persons
66 married couples with children.
37 single-parent households (37 women).
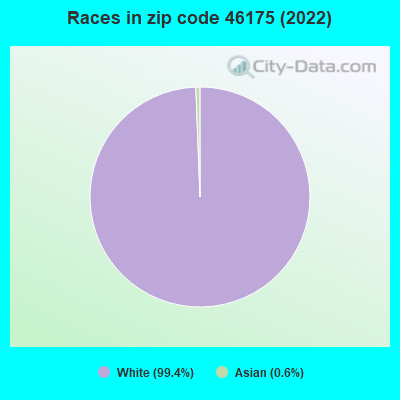
98.4% of residents of 46175 zip code speak English at home.
0.2% of residents speak Spanish at home (100% very well).
0.4% of residents speak Asian or Pacific Island language at home (100% very well).
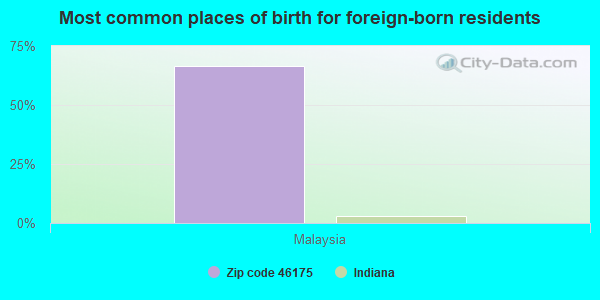
Foreign born population: 3 (0.6%) (100.0% of them are naturalized citizens)
This zip code:
0.6%
Whole state:
6.1%
67%Malaysia
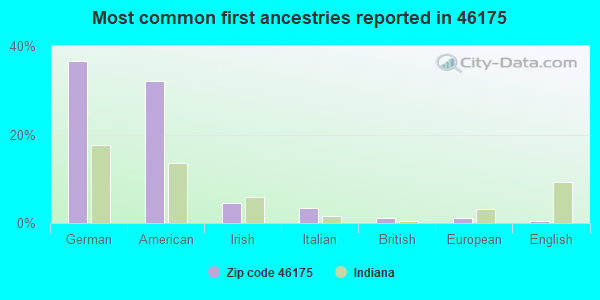
37%German
32%American
5%Irish
3%Italian
1%British
1%European
1%English
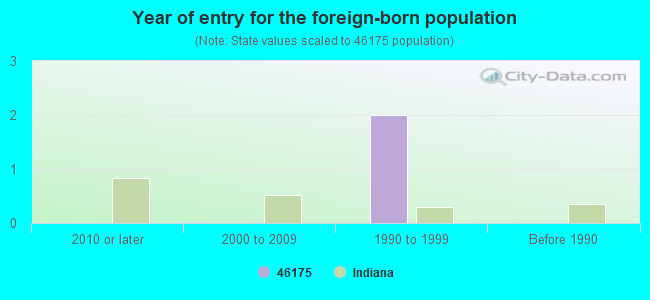
Year of entry for the foreign-born population
02010 or later
02000 to 2009
21990 to 1999
0Before 1990
Facilities with environmental interests located in this zip code:
RUSSELLVILLE WATER WORKS (PO BOX 173 in RUSSELLVILLE, IN)
(Integrated Compliance Information System) - ICIS-05-1998-0277, FORMAL ENFORCEMENT ACTION, ICIS-05-2000-0425, ICIS-05-2004-4700, STATE MASTER (Indiana facility tracking) COMMUNITY WATER SYSTEM (SDWIS) - SDWIS-IN5267008 7524, WATER TREATMENT PLANT Business SIC classification: WATER SUPPLY
MIDLAND CO OP INC (403 E RAILROAD ST in RUSSELLVILLE, IN)
STATE MASTER (Indiana facility tracking) - CRTK-2948, EPCRA, UST-16318, UNDERGROUND STORAGE TANK PROGRAM (Resource Conservation and Recovery Act (tracking hazardous waste)) Alternative names: IMC FERTILIZER INC
MILESTONE CONTRACTORS (SR 236 & INDIANA AVE in RUSSELLVILLE, IN)
STATE MASTER (Indiana facility tracking) - ACES-OP-13303132, AIR PROGRAM, CRTK-3725, EPCRA (Resource Conservation and Recovery Act (tracking hazardous waste)) Organizations: FAUBER CONST CO INC (CONTACT/OWNER)
Alternative names: FAUBER CONSTRUCTION CO INC
METFORM INDUSTRIES (W RAILROAD ST in RUSSELLVILLE, IN)
STATE MASTER (Indiana facility tracking) Conditionally Exempt Small Quantity Generators, less than 100 kg/month of hazardous waste (Resource Conservation and Recovery Act (tracking hazardous waste)) - notification Organizations: STALEY POLLARD (CONTACT/OWNER)
MILESTONE CONTRACTORS, L.P. (E. END OF INDIANA AVENUE in RUSSELLVILLE, IN)
AIR SYNTHETIC MINOR (AIRS/AFS) STATE MASTER (Indiana facility tracking) Business SIC classification: ASPHALT PAVING MIXTURES AND BLOCKS
Housing units lacking complete plumbing facilities: 11.4% Housing units lacking complete kitchen facilities: 12.1%
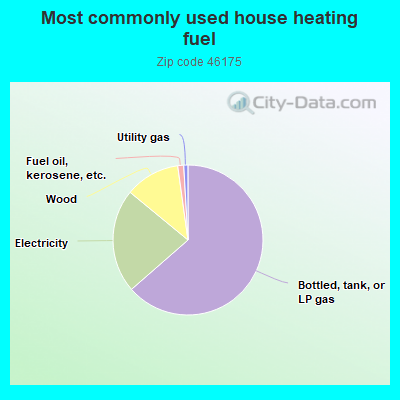
63.9%Bottled, tank, or LP gas
22.5%Electricity
11.9%Wood
1.3%Fuel oil, kerosene, etc.
0.9%Utility gas
Population in 1990: 775.
Place of birth for U.S.-born residents:
This state: 450
Midwest: 19
South: 60
West: 3
83% of the 46175 zip code residents lived in the same house 5 years ago. Out of people who lived in different houses, 48% lived in this county. Out of people who lived in different counties, 50% lived in Indiana.
99% of the 46175 zip code residents lived in the same house 1 year ago. Out of people who lived in different houses, 100% moved from different county within same state. Out of people who lived in different houses, 100% moved from abroad.
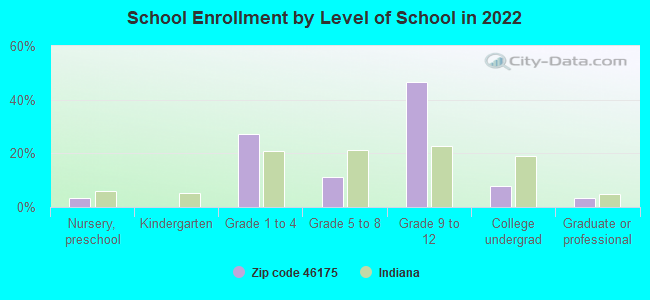
Private vs. public school enrollment:
Students in private schools in grades 1 to 8 (elementary and middle school):
Here:
0.0%
Indiana:
14.9%
Students in private schools in grades 9 to 12 (high school): 2
Here:
7.1%
Indiana:
11.4%
Students in private undergraduate colleges: 1
Here:
25.5%
Indiana:
22.3%
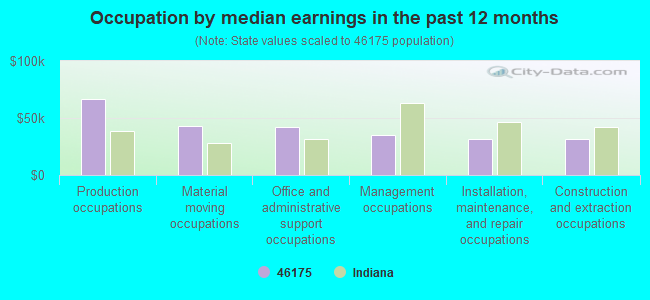
Occupation by median earnings in the past 12 months ($)
66,435Production occupations
42,633Material moving occupations
41,997Office and administrative support occupations
35,526Management occupations
31,265Installation, maintenance, and repair occupations
31,182Construction and extraction occupations
Top industries in this zip code by the number of employees in 2005:
Accommodation and Food Services: Limited-Service Restaurants (20-49 employees: 1 establishment)
Health Care and Social Assistance: Child Day Care Services (5-9: 1)
Other Services (except Public Administration): Religious Organizations (1-4: 2)
Finance and Insurance: Commercial Banking (1-4: 1)
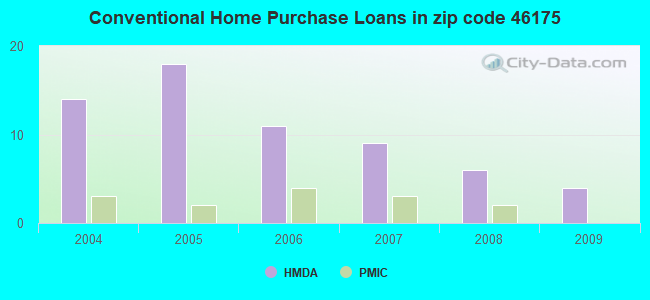
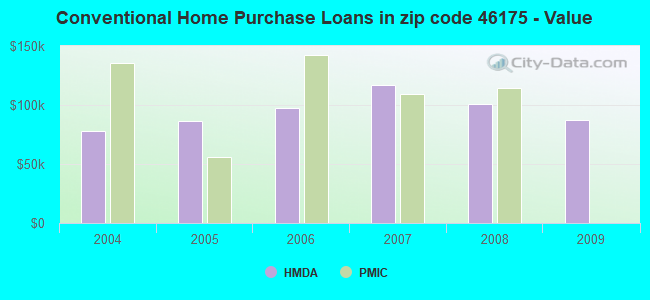
Home Mortgage Disclosure Act Aggregated Statistics For Year 2009 (Based on 2 partial tracts)
A) FHA, FSA/RHS & VA Home Purchase Loans
B) Conventional Home Purchase Loans
C) Refinancings
D) Home Improvement Loans
F) Non-occupant Loans on < 5 Family Dwellings (A B C & D)
G) Loans On Manufactured Home Dwelling (A B C & D)
Number
Average Value
Number
Average Value
Number
Average Value
Number
Average Value
Number
Average Value
Number
Average Value
LOANS ORIGINATED
4
$72,188
4
$86,908
17
$112,897
1
$15,380
1
$28,130
2
$66,940
APPLICATIONS APPROVED, NOT ACCEPTED
0
$0
0
$0
3
$133,250
0
$0
0
$0
0
$0
APPLICATIONS DENIED
0
$0
1
$102,750
7
$111,643
1
$18,750
0
$0
1
$87,750
APPLICATIONS WITHDRAWN
0
$0
1
$73,130
6
$109,500
0
$0
0
$0
1
$73,130
FILES CLOSED FOR INCOMPLETENESS
0
$0
0
$0
2
$118,315
0
$0
0
$0
0
$0
Aggregated Statistics For Year 2008 (Based on 2 partial tracts)
A) FHA, FSA/RHS & VA Home Purchase Loans
B) Conventional Home Purchase Loans
C) Refinancings
D) Home Improvement Loans
F) Non-occupant Loans on < 5 Family Dwellings (A B C & D)
G) Loans On Manufactured Home Dwelling (A B C & D)
Number
Average Value
Number
Average Value
Number
Average Value
Number
Average Value
Number
Average Value
Number
Average Value
LOANS ORIGINATED
3
$97,127
6
$100,688
13
$116,337
3
$31,377
1
$138,380
2
$88,125
APPLICATIONS APPROVED, NOT ACCEPTED
1
$121,500
1
$70,500
5
$83,550
0
$0
0
$0
0
$0
APPLICATIONS DENIED
2
$82,315
2
$75,940
14
$139,206
5
$38,550
1
$48,000
2
$94,690
APPLICATIONS WITHDRAWN
0
$0
1
$174,000
6
$106,000
1
$29,630
1
$146,250
0
$0
FILES CLOSED FOR INCOMPLETENESS
0
$0
0
$0
2
$112,500
0
$0
0
$0
0
$0
Aggregated Statistics For Year 2007 (Based on 2 partial tracts)
A) FHA, FSA/RHS & VA Home Purchase Loans
B) Conventional Home Purchase Loans
C) Refinancings
D) Home Improvement Loans
F) Non-occupant Loans on < 5 Family Dwellings (A B C & D)
G) Loans On Manufactured Home Dwelling (A B C & D)
Number
Average Value
Number
Average Value
Number
Average Value
Number
Average Value
Number
Average Value
Number
Average Value
LOANS ORIGINATED
2
$90,375
9
$116,792
18
$98,938
6
$16,000
2
$47,625
3
$59,627
APPLICATIONS APPROVED, NOT ACCEPTED
0
$0
1
$52,500
5
$76,276
1
$24,750
0
$0
0
$0
APPLICATIONS DENIED
1
$93,750
6
$75,563
20
$110,512
7
$33,054
1
$34,130
3
$65,877
APPLICATIONS WITHDRAWN
0
$0
2
$39,190
9
$98,667
1
$60,380
1
$50,250
0
$0
FILES CLOSED FOR INCOMPLETENESS
0
$0
1
$219,750
2
$94,875
0
$0
0
$0
0
$0
Aggregated Statistics For Year 2006 (Based on 2 partial tracts)
A) FHA, FSA/RHS & VA Home Purchase Loans
B) Conventional Home Purchase Loans
C) Refinancings
D) Home Improvement Loans
F) Non-occupant Loans on < 5 Family Dwellings (A B C & D)
G) Loans On Manufactured Home Dwelling (A B C & D)
Number
Average Value
Number
Average Value
Number
Average Value
Number
Average Value
Number
Average Value
Number
Average Value
LOANS ORIGINATED
3
$83,627
11
$97,875
19
$88,026
9
$42,126
3
$39,377
4
$72,750
APPLICATIONS APPROVED, NOT ACCEPTED
0
$0
1
$36,750
5
$94,426
1
$15,000
0
$0
1
$49,500
APPLICATIONS DENIED
0
$0
7
$126,643
21
$96,000
9
$39,750
1
$16,880
6
$61,313
APPLICATIONS WITHDRAWN
0
$0
3
$249,500
12
$108,094
2
$65,065
1
$30,750
0
$0
FILES CLOSED FOR INCOMPLETENESS
0
$0
1
$99,000
3
$120,877
0
$0
0
$0
0
$0
Aggregated Statistics For Year 2005 (Based on 2 partial tracts)
A) FHA, FSA/RHS & VA Home Purchase Loans
B) Conventional Home Purchase Loans
C) Refinancings
D) Home Improvement Loans
F) Non-occupant Loans on < 5 Family Dwellings (A B C & D)
G) Loans On Manufactured Home Dwelling (A B C & D)
Number
Average Value
Number
Average Value
Number
Average Value
Number
Average Value
Number
Average Value
Number
Average Value
LOANS ORIGINATED
3
$82,627
18
$86,500
24
$77,062
8
$32,298
6
$46,438
5
$61,126
APPLICATIONS APPROVED, NOT ACCEPTED
0
$0
3
$200,750
5
$84,900
1
$113,250
0
$0
1
$69,750
APPLICATIONS DENIED
0
$0
6
$80,313
29
$94,707
5
$30,526
2
$81,565
6
$77,313
APPLICATIONS WITHDRAWN
0
$0
7
$92,357
11
$110,148
1
$76,500
1
$40,880
0
$0
FILES CLOSED FOR INCOMPLETENESS
0
$0
2
$108,000
3
$127,627
0
$0
0
$0
0
$0
Aggregated Statistics For Year 2004 (Based on 2 partial tracts)
A) FHA, FSA/RHS & VA Home Purchase Loans
B) Conventional Home Purchase Loans
C) Refinancings
D) Home Improvement Loans
F) Non-occupant Loans on < 5 Family Dwellings (A B C & D)
G) Loans On Manufactured Home Dwelling (A B C & D)

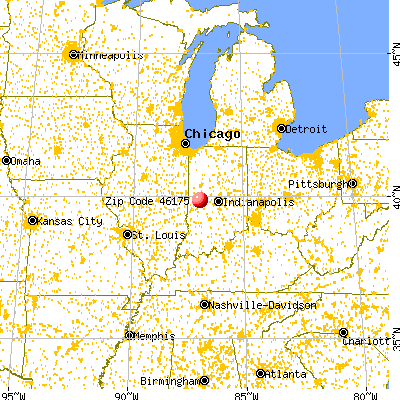


 Nearest zip codes: 47989, 47965, 46172, 46105, 47954, 46135.