Estimated zip code population in 2022: 5,599 Zip code population in 2010: 6,228 Zip code population in 2000: 6,206
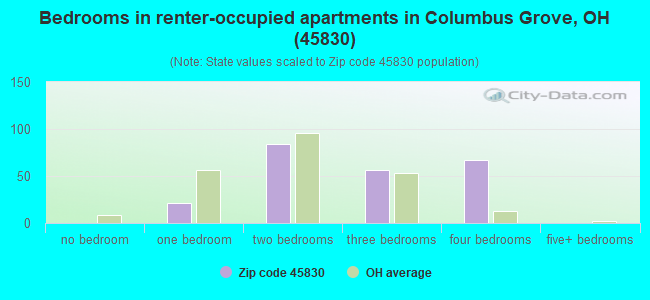
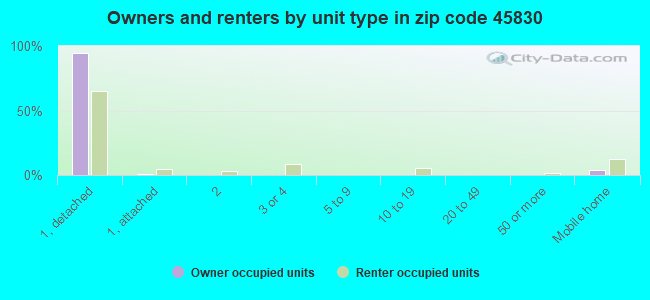
Houses and condos: 2,303 Renter-occupied apartments: 231
% of renters here:
10%
State:
33%
March 2022 cost of living index in zip code 45830: 82.7 (low, U.S. average is 100)
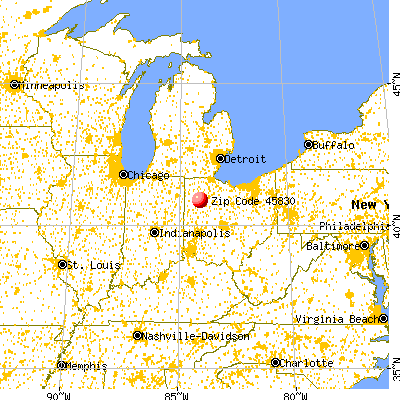
Land area: 94.9 sq. mi. Water area: 0.2 sq. mi.
Population density: 59 people per square mile
(very low).
OSM Map
General Map
Google Map
MSN Map
OSM Map
General Map
Google Map
MSN Map
OSM Map
General Map
Google Map
MSN Map
OSM Map
General Map
Google Map
MSN Map
Please wait while loading the map...
Real estate property taxes paid for housing units in 2022:
This zip code:
1.0% ($1,713)
Ohio:
1.3% ($2,639)
Median real estate property taxes paid for housing units with mortgages in 2022: $1,808 (0.9%) Median real estate property taxes paid for housing units with no mortgage in 2022: $1,513 (1.0%)
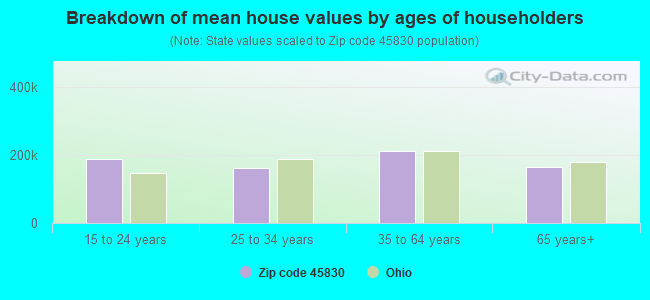
Estimated median house/condo value in 2022: $171,921
45830:
$171,921
Ohio:
$204,100
According to our research of Ohio and other state lists, there were 12 registered sex offenders living in 45830 zip code as of May 25, 2024. The ratio of all residents to sex offenders in zip code 45830 is 495 to 1. The ratio of registered sex offenders to all residents in this zip code is near the state average.
Median resident age:
This zip code:
39.9 years
Ohio median age:
39.9 years
Average household size:
This zip code:
2.5 people
Ohio:
2.4 people
Averages for the 2020 tax year for zip code 45830, filed in 2021:
Average Adjusted Gross Income (AGI) in 2020: $61,303 (Individual Income Tax Returns)
Here:
$61,303
State:
$67,288
Salary/wage: $52,679 (reported on 81.9% of returns)
Here:
$52,679
State:
$55,628
(% of AGI for various income ranges: 1036.9% for AGIs below $25k, 3613.5% for AGIs $25k-50k, 6440.6% for AGIs $50k-75k, 9623.0% for AGIs $75k-100k, 16766.9% for AGIs $100k-200k)
Taxable interest for individuals: $927 (reported on 38.6% of returns)
This zip code:
$927
Ohio:
$1,518
(% of AGI for various income ranges: 17.8% for AGIs below $25k, 34.6% for AGIs $25k-50k, 34.0% for AGIs $50k-75k, 57.4% for AGIs $75k-100k, 151.0% for AGIs $100k-200k)
Ordinary dividends: $2,853 (reported on 24.9% of returns)
Here:
$2,853
State:
$7,167
(% of AGI for various income ranges: 28.9% for AGIs below $25k, 35.7% for AGIs $25k-50k, 89.1% for AGIs $50k-75k, 107.8% for AGIs $75k-100k, 288.3% for AGIs $100k-200k)
Net capital gain/loss in AGI: +$5,837 (reported on 21.5% of returns)
Here:
+$5,837
State:
+$18,919
(% of AGI for various income ranges: 16.5% for AGIs below $25k, 45.0% for AGIs $25k-50k, 98.3% for AGIs $50k-75k, 119.6% for AGIs $75k-100k, 598.3% for AGIs $100k-200k)
Profit/loss from business: +$16,312 (reported on 11.3% of returns)
Here:
+$16,312
State:
+$13,744
(% of AGI for various income ranges: 84.3% for AGIs below $25k, 109.3% for AGIs $25k-50k, 105.7% for AGIs $50k-75k, 249.6% for AGIs $75k-100k, 1170.3% for AGIs $100k-200k)
Taxable individual retirement arrangement distribution: $15,003 (reported on 13.0% of returns)
45830:
$15,003
Ohio:
$18,876
(% of AGI for various income ranges: 100.4% for AGIs below $25k, 174.1% for AGIs $25k-50k, 324.9% for AGIs $50k-75k, 395.7% for AGIs $75k-100k, 749.0% for AGIs $100k-200k)
Total itemized deductions: $32,133 (reported on 2.0% of returns)
Here:
$32,133
State:
$33,869
(% of AGI for various income ranges: 145.9% for AGIs $25k-50k, 393.1% for AGIs $100k-200k)
Charity contributions: $10,475 (reported on 1.4% of returns)
Here:
$10,475
State:
$14,577
(% of AGI for various income ranges: 144.5% for AGIs $100k-200k)
Taxes paid: $5,833 (reported on 2.0% of returns)
45830:
$5,833
State:
$7,681
(% of AGI for various income ranges: 18.1% for AGIs $25k-50k, 86.9% for AGIs $100k-200k)
Earned income credit: $2,268 (reported on 8.5% of returns)
Here:
$2,268
State:
$2,304
(% of AGI for various income ranges: 58.3% for AGIs below $25k, 46.7% for AGIs $25k-50k)
Percentage of individuals using paid preparers for their 2020 taxes: 95.2%
Here:
95%
State:
94%
(% for various income ranges: 93.8% for AGIs below $25k, 94.6% for AGIs $25k-50k, 98.0% for AGIs $50k-75k, 97.1% for AGIs $75k-100k, 94.0% for AGIs $100k-200k, 100.0% for AGIs over 200k)
Averages for the 2012 tax year for zip code 45830, filed in 2013:
Average Adjusted Gross Income (AGI) in 2012: $48,833 (Individual Income Tax Returns)
Here:
$48,833
State:
$54,926
Salary/wage: $41,496 (reported on 85.8% of returns)
Here:
$41,496
State:
$45,869
(% of AGI for various income ranges: 69.5% for AGIs below $25k, 75.9% for AGIs $25k-50k, 72.2% for AGIs $50k-75k, 79.7% for AGIs $75k-100k, 76.3% for AGIs $100k-200k, 40.3% for AGIs over 200k)
Taxable interest for individuals: $949 (reported on 38.5% of returns)
This zip code:
$949
Ohio:
$1,297
(% of AGI for various income ranges: 1.3% for AGIs below $25k, 0.8% for AGIs $25k-50k, 1.0% for AGIs $50k-75k, 0.6% for AGIs $75k-100k, 0.5% for AGIs $100k-200k, 0.5% for AGIs over 200k)
Ordinary dividends: $1,764 (reported on 24.7% of returns)
Here:
$1,764
State:
$5,821
(% of AGI for various income ranges: 1.2% for AGIs below $25k, 0.7% for AGIs $25k-50k, 1.1% for AGIs $50k-75k, 0.6% for AGIs $75k-100k, 1.1% for AGIs $100k-200k, 0.3% for AGIs over 200k)
Net capital gain/loss in AGI: +$3,221 (reported on 16.2% of returns)
Here:
+$3,221
State:
+$11,232
(% of AGI for various income ranges: 0.3% for AGIs below $25k, 0.5% for AGIs $25k-50k, 0.7% for AGIs $50k-75k, 1.2% for AGIs $75k-100k, 2.5% for AGIs $100k-200k)
Profit/loss from business: +$12,878 (reported on 10.8% of returns)
Here:
+$12,878
State:
+$12,773
(% of AGI for various income ranges: 4.0% for AGIs below $25k, 1.6% for AGIs $25k-50k, 2.7% for AGIs $50k-75k, 0.7% for AGIs $75k-100k, 6.2% for AGIs $100k-200k)
Taxable individual retirement arrangement distribution: $9,928 (reported on 12.2% of returns)
45830:
$9,928
Ohio:
$14,511
(% of AGI for various income ranges: 4.5% for AGIs below $25k, 2.2% for AGIs $25k-50k, 3.0% for AGIs $50k-75k, 2.5% for AGIs $75k-100k, 2.3% for AGIs $100k-200k)
Total itemized deductions: $15,920 (19% of AGI, reported on 22.0% of returns)
Here:
$15,920
State:
$21,278
Here:
18.7% of AGI
State:
18.8% of AGI
(% of AGI for various income ranges: 4.7% for AGIs below $25k, 4.7% for AGIs $25k-50k, 7.3% for AGIs $50k-75k, 7.0% for AGIs $75k-100k, 9.4% for AGIs $100k-200k, 9.5% for AGIs over 200k)
Charity contributions: $3,381 (reported on 16.2% of returns)
Here:
$3,381
State:
$3,943
(% of AGI for various income ranges: 0.5% for AGIs below $25k, 0.5% for AGIs $25k-50k, 1.0% for AGIs $50k-75k, 1.4% for AGIs $75k-100k, 1.6% for AGIs $100k-200k, 2.0% for AGIs over 200k)
Taxes paid: $6,134 (reported on 22.0% of returns)
45830:
$6,134
State:
$9,568
(% of AGI for various income ranges: 0.7% for AGIs below $25k, 1.4% for AGIs $25k-50k, 2.0% for AGIs $50k-75k, 2.9% for AGIs $75k-100k, 4.5% for AGIs $100k-200k, 4.8% for AGIs over 200k)
Earned income credit: $2,106 (reported on 10.8% of returns)
Here:
$2,106
State:
$2,285
(% of AGI for various income ranges: 4.1% for AGIs below $25k, 0.7% for AGIs $25k-50k)
Percentage of individuals using paid preparers for their 2012 taxes: 60.8%
Here:
61%
State:
51%
(% for various income ranges: 50.5% for AGIs below $25k, 61.7% for AGIs $25k-50k, 67.3% for AGIs $50k-75k, 68.8% for AGIs $75k-100k, 71.4% for AGIs $100k-200k, 100.0% for AGIs over 200k)
Averages for the 2004 tax year for zip code 45830, filed in 2005:
Average Adjusted Gross Income (AGI) in 2004: $38,469 (Individual Income Tax Returns)
Here:
$38,469
State:
$44,480
Salary/wage: $34,908 (reported on 86.5% of returns)
Here:
$34,908
State:
$39,198
(% of AGI for various income ranges: 105.4% for AGIs below $10k, 67.9% for AGIs $10k-25k, 79.2% for AGIs $25k-50k, 83.2% for AGIs $50k-75k, 88.3% for AGIs $75k-100k, 59.5% for AGIs over 100k)
Taxable interest for individuals: $1,112 (reported on 55.5% of returns)
This zip code:
$1,112
Ohio:
$1,532
(% of AGI for various income ranges: 5.8% for AGIs below $10k, 3.6% for AGIs $10k-25k, 1.6% for AGIs $25k-50k, 1.3% for AGIs $50k-75k, 0.9% for AGIs $75k-100k, 1.3% for AGIs over 100k)
Taxable dividends: $1,275 (reported on 28.3% of returns)
Here:
$1,275
State:
$3,496
(% of AGI for various income ranges: 2.2% for AGIs below $10k, 1.1% for AGIs $10k-25k, 0.7% for AGIs $25k-50k, 1.1% for AGIs $50k-75k, 0.7% for AGIs $75k-100k, 1.1% for AGIs over 100k)
Net capital gain/loss: +$3,148 (reported on 18.1% of returns)
Here:
+$3,148
State:
+$8,582
(% of AGI for various income ranges: -1.3% for AGIs below $10k, 0.9% for AGIs $10k-25k, 0.6% for AGIs $25k-50k, 1.2% for AGIs $50k-75k, 1.0% for AGIs $75k-100k, 4.8% for AGIs over 100k)
Profit/loss from business: +$11,301 (reported on 11.3% of returns)
Here:
+$11,301
State:
+$10,813
(% of AGI for various income ranges: 3.6% for AGIs below $10k, 2.9% for AGIs $10k-25k, 3.1% for AGIs $25k-50k, 1.7% for AGIs $50k-75k, 0.9% for AGIs $75k-100k, 10.0% for AGIs over 100k)
Profit/loss from farming: +$2,283 (reported on 6.6% of returns)
Here:
+$2,283
State:
-$3,706
(% of AGI for various income ranges: -0.4% for AGIs below $10k, 1.1% for AGIs $10k-25k, 0.0% for AGIs $25k-50k, 0.7% for AGIs $50k-75k, -0.1% for AGIs $75k-100k, 0.7% for AGIs over 100k)
IRA payment deduction: $2,598 (reported on 2.8% of returns)
45830:
$2,598
Ohio:
$2,794
(% of AGI for various income ranges: 0.2% for AGIs $10k-25k, 0.3% for AGIs $25k-50k, 0.1% for AGIs $50k-75k, 0.2% for AGIs $75k-100k)
Self-employed pension: $6,062 (reported on 0.5% of returns)
Here:
$6,062
Ohio:
$13,981
Total itemized deductions: $13,790 (20% of AGI, reported on 24.9% of returns)
Here:
$13,790
State:
$17,503
Here:
20.3% of AGI
State:
20.8% of AGI
(% of AGI for various income ranges: 6.2% for AGIs $10k-25k, 6.7% for AGIs $25k-50k, 8.7% for AGIs $50k-75k, 11.2% for AGIs $75k-100k, 13.7% for AGIs over 100k)
Charity contributions deductions: $3,250 (4% of AGI, reported on 19.2% of returns)
Here:
$3,250
State:
$3,087
Here:
4.4% of AGI
State:
3.4% of AGI
(% of AGI for various income ranges: 0.7% for AGIs $10k-25k, 1.0% for AGIs $25k-50k, 1.2% for AGIs $50k-75k, 1.9% for AGIs $75k-100k, 4.1% for AGIs over 100k)
Total tax: $4,300 (reported on 78.4% of returns)
45830:
$4,300
State:
$6,781
(% of AGI for various income ranges: 2.2% for AGIs below $10k, 4.4% for AGIs $10k-25k, 7.2% for AGIs $25k-50k, 8.6% for AGIs $50k-75k, 9.4% for AGIs $75k-100k, 14.8% for AGIs over 100k)
Earned income credit: $1,553 (reported on 8.6% of returns)
Here:
$1,553
State:
$1,696
Percentage of individuals using paid preparers for their 2004 taxes: 62.2%
Here:
62%
State:
55%
(% for various income ranges: 47.9% for AGIs below $10k, 62.1% for AGIs $10k-25k, 68.0% for AGIs $25k-50k, 66.8% for AGIs $50k-75k, 65.9% for AGIs $75k-100k, 68.4% for AGIs over 100k)
Household received Food Stamps/SNAP in the past 12 months: 137 Household did not receive Food Stamps/SNAP in the past 12 months: 2,083
Women who had a birth in the past 12 months: 113 (107 now married, 8 unmarried) Women who did not have a birth in the past 12 months: 1,116 (582 now married, 533 unmarried)
Housing units in zip code 45830 with a mortgage: 1,079 (150 second mortgage, 140 both second mortgage and home equity loan) Houses without a mortgage: 84
Median monthly owner costs for units with a mortgage: $1,109 Median monthly owner costs for units without a mortgage: $484
Residents with income below the poverty level in 2022:
This zip code:
7.6%
Whole state:
13.4%
Residents with income below 50% of the poverty level in 2022:
This zip code:
4.5%
Whole state:
7.0%
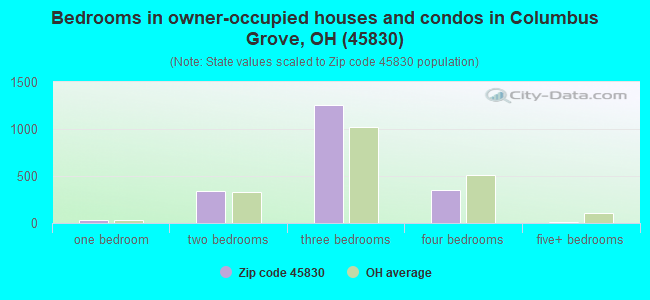
Median number of rooms in houses and condos:
Here:
6.6
State:
6.7
Median number of rooms in apartments:
Here:
5.8
State:
4.4
Notable locations in this zip code not listed on our city pages
Notable locations in zip code 45830: Maple Ridge Farms (A), Ridge Farms (B), Windmill Swine Farm (C), Lugibill's Greenhouse (D), Columbus Grove Emergency Medical Services (E), Columbus Grove Fire Department Station 2 (F), Columbus Grove Fire Department Station 1 (G). Display/hide their locations on the map
Churches in zip code 45830 include: Saint Anthony Catholic Church (A), Thompson Church (B), Saint John United Methodist Church (C), Ottawa River Church (D). Display/hide their locations on the map
Cemeteries: Bogart Cemetery (1), Campbell Cemetery (2), Clevenger Cemetery (3), Truro Cemetery (4), Ottawa River Cemetery (5), Clerenger Cemetery (6), Hughes Cemetery (7). Display/hide their locations on the map
1,135 married couples with children.
144 single-parent households (61 men, 83 women).
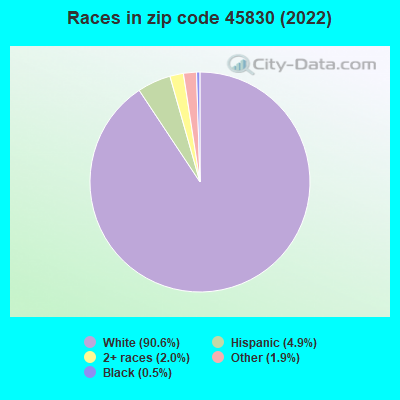
96.3% of residents of 45830 zip code speak English at home.
3.0% of residents speak Spanish at home (72% very well, 4% well, 24% not well).
0.4% of residents speak other Indo-European language at home (100% very well).
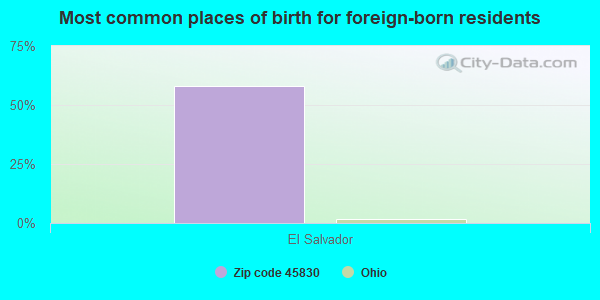
Foreign born population: 19 (0.3%) (63.6% of them are naturalized citizens)
This zip code:
0.3%
Whole state:
5.0%
58%El Salvador
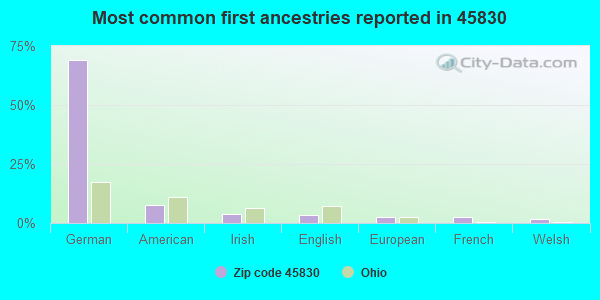
69%German
8%American
4%Irish
3%English
2%European
2%French
2%Welsh
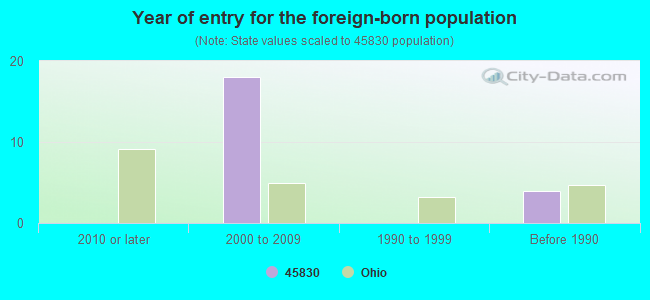
Year of entry for the foreign-born population
02010 or later
182000 to 2009
01990 to 1999
4Before 1990
Facilities with environmental interests located in this zip code:
BP OIL CO NO 3863 (101 MAIN ST in COLUMBUS GROVE, OH)
STATE MASTER (Ohio general info) - RCRA-OHR000011908, HAZARDOUS WASTE PROGRAM Conditionally Exempt Small Quantity Generators, less than 100 kg/month of hazardous waste (Resource Conservation and Recovery Act (tracking hazardous waste)) - notification Organizations: CHARLENE PARYS (CONTACT/OWNER)
Housing units lacking complete plumbing facilities: 1.5% Housing units lacking complete kitchen facilities: 1.9%
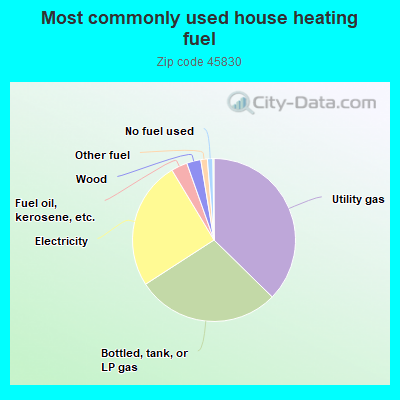
37.3%Utility gas
28.5%Bottled, tank, or LP gas
25.5%Electricity
3.2%Fuel oil, kerosene, etc.
2.8%Wood
1.3%Other fuel
1.1%No fuel used
Population in 1990: 6,030. Population change in the 1990s: +176 (+2.9%).
Place of birth for U.S.-born residents:
This state: 5,156
Northeast: 14
Midwest: 161
South: 172
West: 62
71% of the 45830 zip code residents lived in the same house 5 years ago. Out of people who lived in different houses, 63% lived in this county. Out of people who lived in different counties, 50% lived in Ohio.
97% of the 45830 zip code residents lived in the same house 1 year ago. Out of people who lived in different houses, 50% moved from this county. Out of people who lived in different houses, 69% moved from different county within same state.
Private vs. public school enrollment:
Students in private schools in grades 1 to 8 (elementary and middle school): 61
Here:
11.7%
Ohio:
16.0%
Students in private schools in grades 9 to 12 (high school):
Here:
0.0%
Ohio:
13.1%
Students in private undergraduate colleges: 65
Here:
49.8%
Ohio:
22.3%
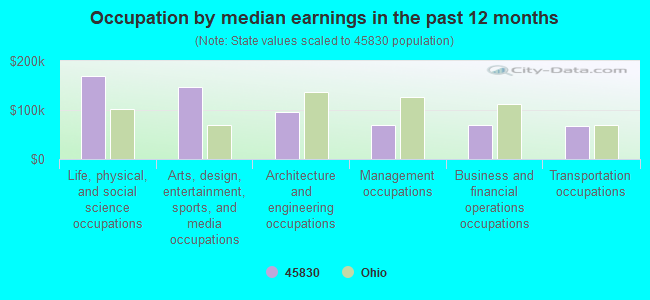
Occupation by median earnings in the past 12 months ($)
168,728Life, physical, and social science occupations
147,400Arts, design, entertainment, sports, and media occupations
95,413Architecture and engineering occupations
69,038Management occupations
68,481Business and financial operations occupations
67,574Transportation occupations
Top industries in this zip code by the number of employees in 2005:
Management of Companies and Enterprises: Offices of Bank Holding Companies (50-99 employees: 1 establishment)
Construction: Drywall and Insulation Contractors (20-49: 1, 10-19: 1)
Administrative and Support and Waste Management and Remediation Services: Janitorial Services (20-49: 1)
Educational Services: Elementary and Secondary Schools (20-49: 1)
Construction: Commercial and Institutional Building Construction (20-49: 1)
Other Services (except Public Administration): Automotive Body, Paint, and Interior Repair and Maintenance (20-49: 1)
Other Services (except Public Administration): Other Automotive Mechanical and Electrical Repair and Maintenance (20-49: 1)
Other Services (except Public Administration): Civic and Social Organizations (10-19: 1, 1-4: 2)
Finance and Insurance: Commercial Banking (10-19: 1, 1-4: 1)
Fatal accident statistics in 2014:
Fatal accident count: 1
Vehicles involved in fatal accidents: 2
Fatal accidents caused by drunken drivers: 0
Fatalities: 1
Persons involved in fatal accidents: 2
Pedestrians involved in fatal accidents: 0
Fatal accident statistics in 2012:
Fatal accident count: 1
Vehicles involved in fatal accidents: 3
Fatal accidents caused by drunken drivers: 0
Fatalities: 1
Persons involved in fatal accidents: 3
Pedestrians involved in fatal accidents: 0
Home Mortgage Disclosure Act Aggregated Statistics For Year 2009 (Based on 4 partial tracts)
A) FHA, FSA/RHS & VA Home Purchase Loans
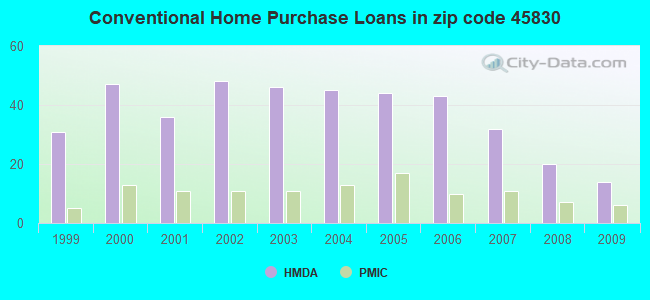
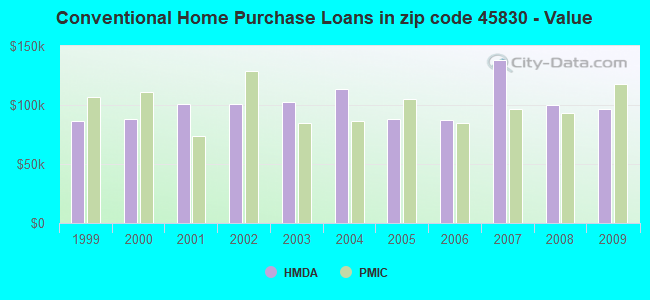
B) Conventional Home Purchase Loans
C) Refinancings
D) Home Improvement Loans
F) Non-occupant Loans on < 5 Family Dwellings (A B C & D)
G) Loans On Manufactured Home Dwelling (A B C & D)
Number
Average Value
Number
Average Value
Number
Average Value
Number
Average Value
Number
Average Value
Number
Average Value
LOANS ORIGINATED
6
$76,192
14
$96,638
118
$120,114
2
$74,030
6
$54,137
2
$82,825
APPLICATIONS APPROVED, NOT ACCEPTED
3
$86,680
6
$95,625
21
$111,269
1
$166,570
1
$37,020
0
$0
APPLICATIONS DENIED
1
$83,290
2
$44,880
24
$113,207
1
$46,270
1
$63,850
1
$85,140
APPLICATIONS WITHDRAWN
0
$0
3
$53,057
10
$84,952
0
$0
0
$0
1
$49,050
FILES CLOSED FOR INCOMPLETENESS
0
$0
0
$0
0
$0
0
$0
0
$0
0
$0
Aggregated Statistics For Year 2008 (Based on 4 partial tracts)
A) FHA, FSA/RHS & VA Home Purchase Loans
B) Conventional Home Purchase Loans
C) Refinancings
D) Home Improvement Loans
F) Non-occupant Loans on < 5 Family Dwellings (A B C & D)
G) Loans On Manufactured Home Dwelling (A B C & D)
Number
Average Value
Number
Average Value
Number
Average Value
Number
Average Value
Number
Average Value
Number
Average Value
LOANS ORIGINATED
6
$75,112
20
$99,666
43
$120,323
5
$62,372
5
$127,520
3
$41,333
APPLICATIONS APPROVED, NOT ACCEPTED
0
$0
2
$178,600
15
$120,611
0
$0
0
$0
0
$0
APPLICATIONS DENIED
2
$57,840
9
$69,199
29
$89,700
6
$40,563
1
$50,900
2
$28,685
APPLICATIONS WITHDRAWN
3
$120,920
0
$0
9
$119,377
3
$154,233
0
$0
0
$0
FILES CLOSED FOR INCOMPLETENESS
0
$0
0
$0
0
$0
0
$0
0
$0
0
$0
Aggregated Statistics For Year 2007 (Based on 4 partial tracts)
A) FHA, FSA/RHS & VA Home Purchase Loans
B) Conventional Home Purchase Loans
C) Refinancings
D) Home Improvement Loans
F) Non-occupant Loans on < 5 Family Dwellings (A B C & D)
G) Loans On Manufactured Home Dwelling (A B C & D)
Number
Average Value
Number
Average Value
Number
Average Value
Number
Average Value
Number
Average Value
Number
Average Value
LOANS ORIGINATED
2
$144,825
32
$138,000
43
$110,381
18
$24,677
6
$63,082
3
$52,130
APPLICATIONS APPROVED, NOT ACCEPTED
0
$0
3
$148,373
9
$109,300
1
$18,510
1
$122,150
0
$0
APPLICATIONS DENIED
6
$85,753
11
$102,467
45
$100,313
15
$46,393
0
$0
2
$104,105
APPLICATIONS WITHDRAWN
0
$0
6
$85,908
15
$104,200
3
$33,007
1
$24,990
0
$0
FILES CLOSED FOR INCOMPLETENESS
0
$0
1
$108,270
4
$100,175
0
$0
0
$0
0
$0
Aggregated Statistics For Year 2006 (Based on 4 partial tracts)
A) FHA, FSA/RHS & VA Home Purchase Loans
B) Conventional Home Purchase Loans
C) Refinancings
D) Home Improvement Loans
F) Non-occupant Loans on < 5 Family Dwellings (A B C & D)
G) Loans On Manufactured Home Dwelling (A B C & D)
Number
Average Value
Number
Average Value
Number
Average Value
Number
Average Value
Number
Average Value
Number
Average Value
LOANS ORIGINATED
3
$116,910
43
$87,526
69
$107,494
17
$28,469
3
$46,887
4
$73,800
APPLICATIONS APPROVED, NOT ACCEPTED
0
$0
8
$86,988
8
$102,835
3
$73,417
0
$0
0
$0
APPLICATIONS DENIED
1
$102,720
7
$82,757
62
$117,018
12
$37,093
0
$0
0
$0
APPLICATIONS WITHDRAWN
0
$0
9
$104,673
29
$116,058
0
$0
0
$0
0
$0
FILES CLOSED FOR INCOMPLETENESS
0
$0
4
$62,928
6
$69,097
0
$0
1
$113,820
0
$0
Aggregated Statistics For Year 2005 (Based on 4 partial tracts)
A) FHA, FSA/RHS & VA Home Purchase Loans
B) Conventional Home Purchase Loans
C) Refinancings
D) Home Improvement Loans
F) Non-occupant Loans on < 5 Family Dwellings (A B C & D)
G) Loans On Manufactured Home Dwelling (A B C & D)
Number
Average Value
Number
Average Value
Number
Average Value
Number
Average Value
Number
Average Value
Number
Average Value
LOANS ORIGINATED
3
$107,963
44
$88,144
66
$102,088
18
$25,757
5
$40,718
3
$45,343
APPLICATIONS APPROVED, NOT ACCEPTED
0
$0
7
$88,177
16
$60,788
3
$33,623
0
$0
1
$66,630
APPLICATIONS DENIED
2
$91,150
16
$69,694
72
$102,835
17
$48,121
2
$129,555
2
$105,960
APPLICATIONS WITHDRAWN
0
$0
12
$90,612
42
$101,948
1
$35,170
0
$0
1
$9,250
FILES CLOSED FOR INCOMPLETENESS
0
$0
1
$80,510
4
$101,795
0
$0
0
$0
0
$0
Aggregated Statistics For Year 2004 (Based on 4 partial tracts)
A) FHA, FSA/RHS & VA Home Purchase Loans
B) Conventional Home Purchase Loans
C) Refinancings
D) Home Improvement Loans
F) Non-occupant Loans on < 5 Family Dwellings (A B C & D)
G) Loans On Manufactured Home Dwelling (A B C & D)
Number
Average Value
Number
Average Value
Number
Average Value
Number
Average Value
Number
Average Value
Number
Average Value
LOANS ORIGINATED
2
$98,555
45
$113,577
94
$104,826
11
$33,062
5
$69,776
2
$72,180
APPLICATIONS APPROVED, NOT ACCEPTED
0
$0
8
$82,592
21
$88,133
6
$50,588
2
$31,465
0
$0
APPLICATIONS DENIED
1
$90,690
8
$99,828
93
$103,078
8
$17,235
1
$8,330
3
$60,150
APPLICATIONS WITHDRAWN
0
$0
5
$127,706
30
$117,464
2
$77,270
1
$333,140
0
$0
FILES CLOSED FOR INCOMPLETENESS
0
$0
1
$123,080
6
$104,725
0
$0
0
$0
0
$0
Aggregated Statistics For Year 2003 (Based on 4 partial tracts)
A) FHA, FSA/RHS & VA Home Purchase Loans
B) Conventional Home Purchase Loans
C) Refinancings
D) Home Improvement Loans
F) Non-occupant Loans on < 5 Family Dwellings (A B C & D)
Number
Average Value
Number
Average Value
Number
Average Value
Number
Average Value
Number
Average Value
LOANS ORIGINATED
1
$63,850
46
$102,961
196
$94,688
16
$16,310
4
$27,530
APPLICATIONS APPROVED, NOT ACCEPTED
0
$0
6
$82,668
27
$84,623
1
$13,880
0
$0
APPLICATIONS DENIED
0
$0
16
$63,390
63
$76,764
13
$18,365
0
$0
APPLICATIONS WITHDRAWN
0
$0
6
$128,322
29
$87,562
0
$0
2
$50,435
FILES CLOSED FOR INCOMPLETENESS
0
$0
2
$92,540
10
$142,234
0
$0
0
$0
Aggregated Statistics For Year 2002 (Based on 4 partial tracts)
A) FHA, FSA/RHS & VA Home Purchase Loans
B) Conventional Home Purchase Loans
C) Refinancings
D) Home Improvement Loans
F) Non-occupant Loans on < 5 Family Dwellings (A B C & D)
Number
Average Value
Number
Average Value
Number
Average Value
Number
Average Value
Number
Average Value
LOANS ORIGINATED
4
$75,882
48
$100,695
202
$107,772
12
$10,257
4
$29,150
APPLICATIONS APPROVED, NOT ACCEPTED
2
$75,885
8
$66,050
38
$104,473
3
$14,190
1
$49,050
APPLICATIONS DENIED
1
$80,510
9
$104,570
63
$96,256
6
$19,588
2
$40,720
APPLICATIONS WITHDRAWN
0
$0
4
$66,860
46
$105,938
0
$0
0
$0
FILES CLOSED FOR INCOMPLETENESS
1
$90,690
0
$0
4
$87,220
0
$0
0
$0
Aggregated Statistics For Year 2001 (Based on 4 partial tracts)
A) FHA, FSA/RHS & VA Home Purchase Loans
B) Conventional Home Purchase Loans
C) Refinancings
D) Home Improvement Loans
E) Loans on Dwellings For 5+ Families
F) Non-occupant Loans on < 5 Family Dwellings (A B C & D)
Number
Average Value
Number
Average Value
Number
Average Value
Number
Average Value
Number
Average Value
Number
Average Value
LOANS ORIGINATED
4
$89,765
36
$100,714
184
$93,651
22
$5,931
1
$164,720
9
$76,500
APPLICATIONS APPROVED, NOT ACCEPTED
0
$0
3
$56,450
28
$56,020
4
$28,920
0
$0
1
$55,520
APPLICATIONS DENIED
0
$0
5
$109,012
49
$76,298
5
$20,914
0
$0
0
$0
APPLICATIONS WITHDRAWN
0
$0
5
$98,648
42
$94,170
1
$4,630
0
$0
3
$99,327
FILES CLOSED FOR INCOMPLETENESS
0
$0
1
$39,790
9
$77,117
1
$9,250
0
$0
0
$0
Aggregated Statistics For Year 2000 (Based on 4 partial tracts)
A) FHA, FSA/RHS & VA Home Purchase Loans
B) Conventional Home Purchase Loans
C) Refinancings
D) Home Improvement Loans
E) Loans on Dwellings For 5+ Families
F) Non-occupant Loans on < 5 Family Dwellings (A B C & D)
Number
Average Value
Number
Average Value
Number
Average Value
Number
Average Value
Number
Average Value
Number
Average Value
LOANS ORIGINATED
3
$76,190
47
$87,992
49
$75,902
22
$13,460
0
$0
5
$41,088
APPLICATIONS APPROVED, NOT ACCEPTED
0
$0
5
$114,750
12
$78,659
8
$17,930
0
$0
1
$22,210
APPLICATIONS DENIED
3
$94,083
16
$76,692
27
$57,375
8
$16,772
0
$0
0
$0
APPLICATIONS WITHDRAWN
1
$72,180
6
$72,027
17
$65,214
3
$36,090
1
$195,260
0
$0
FILES CLOSED FOR INCOMPLETENESS
0
$0
2
$94,855
2
$118,915
0
$0
0
$0
0
$0
Aggregated Statistics For Year 1999 (Based on 2 partial tracts)
A) FHA, FSA/RHS & VA Home Purchase Loans
B) Conventional Home Purchase Loans
C) Refinancings
D) Home Improvement Loans
F) Non-occupant Loans on < 5 Family Dwellings (A B C & D)
Detailed PMIC statistics for the following Tracts:0102.00
2002 - 2018 National Fire Incident Reporting System (NFIRS) incidents
According to the data from the years 2002 - 2018 the average number of fire incidents per year is 29. The highest number of fire incidents - 64 took place in 2010, and the least - 5 in 2002. The data has an increasing trend.
When looking into fire subcategories, the most incidents belonged to: Outside Fires (45.0%), and Structure Fires (41.6%).
Fire incident types reported to NFIRS in Zip Code 45830


+$2,283
-$3,706
(% of AGI for various income ranges: -0.4% for AGIs below $10k, 1.1% for AGIs $10k-25k, 0.0% for AGIs $25k-50k, 0.7% for AGIs $50k-75k, -0.1% for AGIs $75k-100k, 0.7% for AGIs over 100k) Nearest zip codes: 45820, 45809, 45875, 45807, 45853, 45801.


 According to the data from the years 2002 - 2018 the average number of fire incidents per year is 29. The highest number of fire incidents - 64 took place in 2010, and the least - 5 in 2002. The data has an increasing trend.
 When looking into fire subcategories, the most incidents belonged to: Outside Fires (45.0%), and Structure Fires (41.6%).