Estimated zip code population in 2022: 7,740 Zip code population in 2010: 8,297 Zip code population in 2000: 7,900
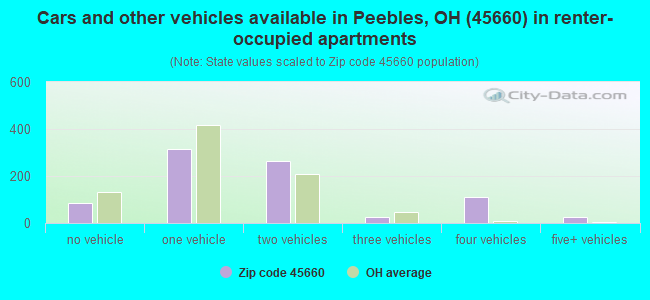
Houses and condos: 3,415 Renter-occupied apartments: 849
% of renters here:
30%
State:
33%
March 2022 cost of living index in zip code 45660: 83.0 (low, U.S. average is 100)
Land area: 196.1 sq. mi. Water area: 0.7 sq. mi.
Population density: 39 people per square mile
(very low).
OSM Map
General Map
Google Map
MSN Map
OSM Map
General Map
Google Map
MSN Map
OSM Map
General Map
Google Map
MSN Map
OSM Map
General Map
Google Map
MSN Map
Please wait while loading the map...
Real estate property taxes paid for housing units in 2022:
This zip code:
0.8% ($1,253)
Ohio:
1.3% ($2,639)
Median real estate property taxes paid for housing units with mortgages in 2022: $1,317 (0.9%) Median real estate property taxes paid for housing units with no mortgage in 2022: $1,101 (0.8%)
Business Search- 14 Million verified businesses
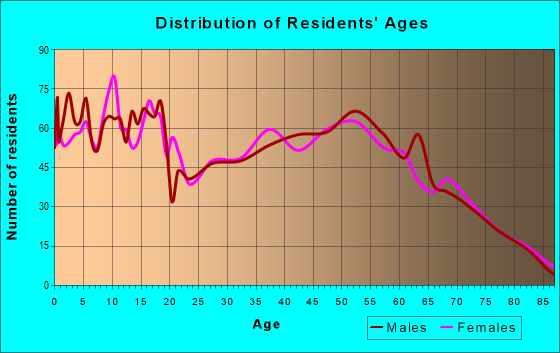
Males: 3,910
(50.5%)
Females: 3,829
(49.5%)
For population 25 years and over in 45660:
High school or higher: 79.9%
Bachelor's degree or higher: 10.8%
Graduate or professional degree: 3.9%
Unemployed: 4.6%
Mean travel time to work (commute): 35.9 minutes
For population 15 years and over in 45660:
Never married: 28.4%
Now married: 55.3%
Separated: 1.4%
Widowed: 5.7%
Divorced: 9.2%
Zip code 45660 compared to state average:
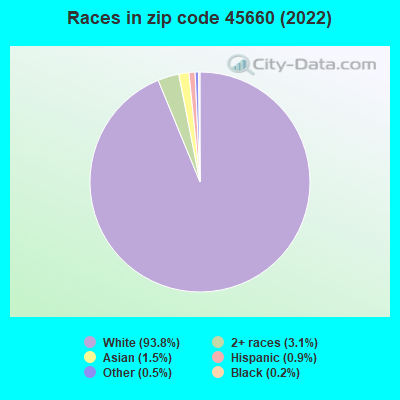
Black race population percentage significantly below state average.
Hispanic race population percentage significantly below state average.
Foreign-born population percentage significantly below state average.
Length of stay since moving in significantly above state average.
Number of college students below state average.
Percentage of population with a bachelor's degree or higher significantly below state average.
Averages for the 2020 tax year for zip code 45660, filed in 2021:
Average Adjusted Gross Income (AGI) in 2020: $46,584 (Individual Income Tax Returns)
Here:
$46,584
State:
$67,288
Salary/wage: $40,947 (reported on 80.1% of returns)
Here:
$40,947
State:
$55,628
(% of AGI for various income ranges: 1112.8% for AGIs below $25k, 3305.6% for AGIs $25k-50k, 6182.3% for AGIs $50k-75k, 8871.7% for AGIs $75k-100k, 15811.6% for AGIs $100k-200k)
Taxable interest for individuals: $1,136 (reported on 23.0% of returns)
This zip code:
$1,136
Ohio:
$1,518
(% of AGI for various income ranges: 9.9% for AGIs below $25k, 9.2% for AGIs $25k-50k, 55.1% for AGIs $50k-75k, 113.3% for AGIs $75k-100k, 128.4% for AGIs $100k-200k)
Ordinary dividends: $2,146 (reported on 7.4% of returns)
Here:
$2,146
State:
$7,167
(% of AGI for various income ranges: 5.4% for AGIs below $25k, 15.4% for AGIs $25k-50k, 22.0% for AGIs $50k-75k, 45.6% for AGIs $75k-100k, 103.2% for AGIs $100k-200k)
Net capital gain/loss in AGI: +$10,338 (reported on 8.0% of returns)
Here:
+$10,338
State:
+$18,919
(% of AGI for various income ranges: 4.3% for AGIs below $25k, 16.3% for AGIs $25k-50k, 85.1% for AGIs $50k-75k, 297.8% for AGIs $75k-100k, 893.7% for AGIs $100k-200k)
Profit/loss from business: +$14,113 (reported on 16.9% of returns)
Here:
+$14,113
State:
+$13,744
(% of AGI for various income ranges: 196.5% for AGIs below $25k, 210.1% for AGIs $25k-50k, 320.3% for AGIs $50k-75k, 445.0% for AGIs $75k-100k, 1316.3% for AGIs $100k-200k)
Taxable individual retirement arrangement distribution: $13,539 (reported on 5.5% of returns)
45660:
$13,539
Ohio:
$18,876
(% of AGI for various income ranges: 23.2% for AGIs below $25k, 38.5% for AGIs $25k-50k, 140.3% for AGIs $50k-75k, 403.3% for AGIs $75k-100k, 383.7% for AGIs $100k-200k)
Total itemized deductions: $21,529 (reported on 2.1% of returns)
Here:
$21,529
State:
$33,869
(% of AGI for various income ranges: 102.0% for AGIs $25k-50k, 412.1% for AGIs $100k-200k)
Charity contributions: $8,425 (reported on 1.2% of returns)
Here:
$8,425
State:
$14,577
(% of AGI for various income ranges: 177.4% for AGIs $100k-200k)
Taxes paid: $5,500 (reported on 1.8% of returns)
45660:
$5,500
State:
$7,681
(% of AGI for various income ranges: 16.3% for AGIs $25k-50k, 112.6% for AGIs $100k-200k)
Earned income credit: $2,561 (reported on 23.6% of returns)
Here:
$2,561
State:
$2,304
(% of AGI for various income ranges: 138.7% for AGIs below $25k, 94.1% for AGIs $25k-50k)
Percentage of individuals using paid preparers for their 2020 taxes: 95.7%
Here:
96%
State:
94%
(% for various income ranges: 96.1% for AGIs below $25k, 95.5% for AGIs $25k-50k, 93.9% for AGIs $50k-75k, 96.2% for AGIs $75k-100k, 96.9% for AGIs $100k-200k, 100.0% for AGIs over 200k)
Averages for the 2012 tax year for zip code 45660, filed in 2013:
Average Adjusted Gross Income (AGI) in 2012: $39,858 (Individual Income Tax Returns)
Here:
$39,858
State:
$54,926
Salary/wage: $35,059 (reported on 79.9% of returns)
Here:
$35,059
State:
$45,869
(% of AGI for various income ranges: 66.5% for AGIs below $25k, 74.7% for AGIs $25k-50k, 77.3% for AGIs $50k-75k, 80.6% for AGIs $75k-100k, 57.7% for AGIs $100k-200k)
Taxable interest for individuals: $1,043 (reported on 26.5% of returns)
This zip code:
$1,043
Ohio:
$1,297
(% of AGI for various income ranges: 0.9% for AGIs below $25k, 0.8% for AGIs $25k-50k, 0.8% for AGIs $50k-75k, 0.3% for AGIs $75k-100k, 0.6% for AGIs $100k-200k)
Ordinary dividends: $2,584 (reported on 8.4% of returns)
Here:
$2,584
State:
$5,821
(% of AGI for various income ranges: 0.5% for AGIs below $25k, 0.3% for AGIs $25k-50k, 0.5% for AGIs $50k-75k, 0.3% for AGIs $75k-100k, 0.9% for AGIs $100k-200k)
Net capital gain/loss in AGI: +$3,587 (reported on 10.1% of returns)
Here:
+$3,587
State:
+$11,232
(% of AGI for various income ranges: 0.2% for AGIs below $25k, 0.6% for AGIs $25k-50k, 0.6% for AGIs $50k-75k, 0.5% for AGIs $75k-100k, 2.0% for AGIs $100k-200k)
Profit/loss from business: +$12,160 (reported on 19.1% of returns)
Here:
+$12,160
State:
+$12,773
(% of AGI for various income ranges: 12.2% for AGIs below $25k, 4.3% for AGIs $25k-50k, 3.7% for AGIs $50k-75k, 3.2% for AGIs $75k-100k, 6.6% for AGIs $100k-200k)
Taxable individual retirement arrangement distribution: $16,806 (reported on 5.7% of returns)
45660:
$16,806
Ohio:
$14,511
(% of AGI for various income ranges: 1.2% for AGIs below $25k, 1.7% for AGIs $25k-50k, 3.4% for AGIs $50k-75k, 4.1% for AGIs $100k-200k)
Total itemized deductions: $17,945 (21% of AGI, reported on 17.1% of returns)
Here:
$17,945
State:
$21,278
Here:
21.2% of AGI
State:
18.8% of AGI
(% of AGI for various income ranges: 3.6% for AGIs below $25k, 6.0% for AGIs $25k-50k, 9.5% for AGIs $50k-75k, 8.9% for AGIs $75k-100k, 9.6% for AGIs $100k-200k)
Charity contributions: $3,300 (reported on 9.7% of returns)
Here:
$3,300
State:
$3,943
(% of AGI for various income ranges: 0.4% for AGIs below $25k, 0.4% for AGIs $25k-50k, 0.7% for AGIs $50k-75k, 1.1% for AGIs $75k-100k, 1.3% for AGIs $100k-200k)
Taxes paid: $4,688 (reported on 16.8% of returns)
45660:
$4,688
State:
$9,568
(% of AGI for various income ranges: 0.6% for AGIs below $25k, 0.9% for AGIs $25k-50k, 1.9% for AGIs $50k-75k, 2.5% for AGIs $75k-100k, 3.5% for AGIs $100k-200k)
Earned income credit: $2,485 (reported on 28.5% of returns)
Here:
$2,485
State:
$2,285
(% of AGI for various income ranges: 9.3% for AGIs below $25k, 1.5% for AGIs $25k-50k)
Percentage of individuals using paid preparers for their 2012 taxes: 64.8%
Here:
65%
State:
51%
(% for various income ranges: 58.7% for AGIs below $25k, 71.4% for AGIs $25k-50k, 67.5% for AGIs $50k-75k, 72.2% for AGIs $75k-100k, 70.0% for AGIs $100k-200k)
Averages for the 2004 tax year for zip code 45660, filed in 2005:
Average Adjusted Gross Income (AGI) in 2004: $29,335 (Individual Income Tax Returns)
Here:
$29,335
State:
$44,480
Salary/wage: $27,524 (reported on 83.6% of returns)
Here:
$27,524
State:
$39,198
(% of AGI for various income ranges: 103.3% for AGIs below $10k, 72.4% for AGIs $10k-25k, 81.6% for AGIs $25k-50k, 83.4% for AGIs $50k-75k, 86.7% for AGIs $75k-100k, 54.3% for AGIs over 100k)
Taxable interest for individuals: $1,099 (reported on 33.8% of returns)
This zip code:
$1,099
Ohio:
$1,532
(% of AGI for various income ranges: 4.7% for AGIs below $10k, 1.6% for AGIs $10k-25k, 0.8% for AGIs $25k-50k, 0.8% for AGIs $50k-75k, 1.6% for AGIs $75k-100k, 1.6% for AGIs over 100k)
Taxable dividends: $1,285 (reported on 10.0% of returns)
Here:
$1,285
State:
$3,496
(% of AGI for various income ranges: 0.9% for AGIs below $10k, 0.4% for AGIs $10k-25k, 0.4% for AGIs $25k-50k, 0.3% for AGIs $50k-75k, 0.2% for AGIs $75k-100k, 1.0% for AGIs over 100k)
Net capital gain/loss: +$4,462 (reported on 10.0% of returns)
Here:
+$4,462
State:
+$8,582
(% of AGI for various income ranges: 0.6% for AGIs below $10k, 1.5% for AGIs $10k-25k, 0.8% for AGIs $25k-50k, 1.1% for AGIs $50k-75k, 1.5% for AGIs $75k-100k, 5.1% for AGIs over 100k)
Profit/loss from business: +$9,244 (reported on 19.2% of returns)
Here:
+$9,244
State:
+$10,813
(% of AGI for various income ranges: 13.8% for AGIs below $10k, 9.1% for AGIs $10k-25k, 3.9% for AGIs $25k-50k, 2.3% for AGIs $50k-75k, 2.6% for AGIs $75k-100k, 16.6% for AGIs over 100k)
IRA payment deduction: $2,529 (reported on 1.6% of returns)
45660:
$2,529
Ohio:
$2,794
Total itemized deductions: $14,622 (26% of AGI, reported on 18.2% of returns)
Here:
$14,622
State:
$17,503
Here:
25.5% of AGI
State:
20.8% of AGI
(% of AGI for various income ranges: 4.7% for AGIs $10k-25k, 9.3% for AGIs $25k-50k, 10.4% for AGIs $50k-75k, 11.8% for AGIs $75k-100k, 13.2% for AGIs over 100k)
Charity contributions deductions: $2,728 (4% of AGI, reported on 12.5% of returns)
Here:
$2,728
State:
$3,087
Here:
4.3% of AGI
State:
3.4% of AGI
(% of AGI for various income ranges: 0.5% for AGIs $10k-25k, 0.9% for AGIs $25k-50k, 1.3% for AGIs $50k-75k, 1.8% for AGIs $75k-100k, 2.5% for AGIs over 100k)
Total tax: $3,340 (reported on 68.5% of returns)
45660:
$3,340
State:
$6,781
(% of AGI for various income ranges: 3.8% for AGIs below $10k, 4.1% for AGIs $10k-25k, 6.0% for AGIs $25k-50k, 8.6% for AGIs $50k-75k, 9.9% for AGIs $75k-100k, 17.8% for AGIs over 100k)
Earned income credit: $1,763 (reported on 25.3% of returns)
Here:
$1,763
State:
$1,696
Percentage of individuals using paid preparers for their 2004 taxes: 71.9%
Here:
72%
State:
55%
(% for various income ranges: 61.6% for AGIs below $10k, 73.3% for AGIs $10k-25k, 76.1% for AGIs $25k-50k, 76.0% for AGIs $50k-75k, 76.7% for AGIs $75k-100k, 70.5% for AGIs over 100k)
Likely homosexual households (counted as self-reported same-sex unmarried-partner households)
Lesbian couples: 0.0% of all households
Gay men: 1.2% of all households
Household received Food Stamps/SNAP in the past 12 months: 1,013 Household did not receive Food Stamps/SNAP in the past 12 months: 1,832
Women who had a birth in the past 12 months: 99 (46 now married, 52 unmarried) Women who did not have a birth in the past 12 months: 1,477 (792 now married, 684 unmarried)
Housing units in zip code 45660 with a mortgage: 1,146 (57 second mortgage, 36 both second mortgage and home equity loan) Houses without a mortgage: 4
Median monthly owner costs for units with a mortgage: $1,108 Median monthly owner costs for units without a mortgage: $387
Residents with income below the poverty level in 2022:
This zip code:
22.2%
Whole state:
13.4%
Residents with income below 50% of the poverty level in 2022:
This zip code:
14.6%
Whole state:
7.0%
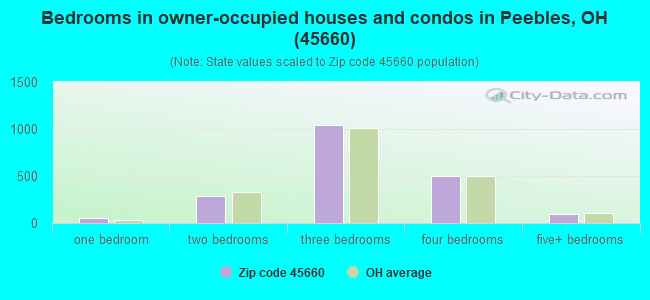
Median number of rooms in houses and condos:
Here:
6.5
State:
6.7
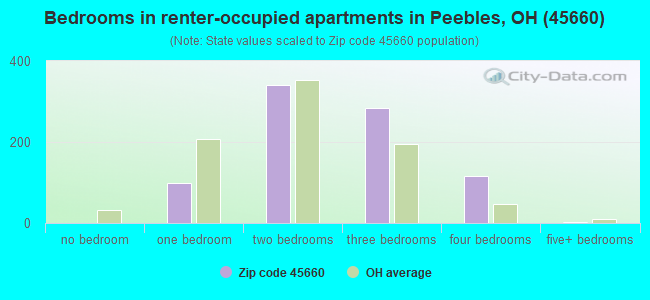
Median number of rooms in apartments:
Here:
5.1
State:
4.4
Notable locations in this zip code not listed on our city pages
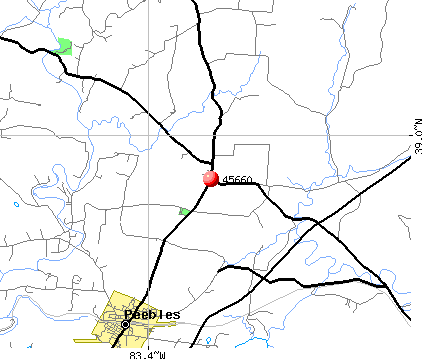
Notable locations in zip code 45660: Eastern Sky Farms (A), Peebles Life Squad - Adams City Emergency Medical Services (B), Franklin Township Fire Department (C), Peebles Fire Department (D). Display/hide their locations on the map
Churches in zip code 45660 include: Antioch Church (A), Beaver Chapel (B), Burns Chapel (C), Cedar Chapel (D), Cedar Fork Church (E), Conaway Chapel (F), Dunlap Church (G), Evergreen Church (H), Fairview Church (I). Display/hide their locations on the map
Cemeteries: Abbott Cemetery (1), Aikens Cemetery (2), Beekman Cemetery (3), Strait Creek Cemetery (4), Olive Branch Cemetery (5), Cedar Chapel Cemetery (6), Steam Furnace Cemetery (7). Display/hide their locations on the map
Streams, rivers, and creeks: Middle Fork Ohio Brush Creek (A), Little East Fork Ohio Brush Creek (B), Lick Run (C), Jaybird Branch (D), Grassy Fork (E), Flat Run (F), Dry Fork (G), Crooked Creek (H), Cox Branch (I). Display/hide their locations on the map
Parks in zip code 45660 include: Tranquility State Wildlife Area (1), Serpent Mound State Memorial (2), Davis Memorial Nature Preserve (3). Display/hide their locations on the map
In group quarters: 82 (-1 institutionalized population)
Size of family households: 924 2-persons, 533 3-persons, 380 4-persons, 210 5-persons, 53 6-persons, 59 7-or-more-persons
Size of nonfamily households: 561 1-person, 82 2-persons
892 married couples with children.
608 single-parent households (297 men, 311 women).
97.8% of residents of 45660 zip code speak English at home.
1.0% of residents speak other Indo-European language at home (88% very well, 12% well).
0.9% of residents speak Asian or Pacific Island language at home (47% very well, 53% well).
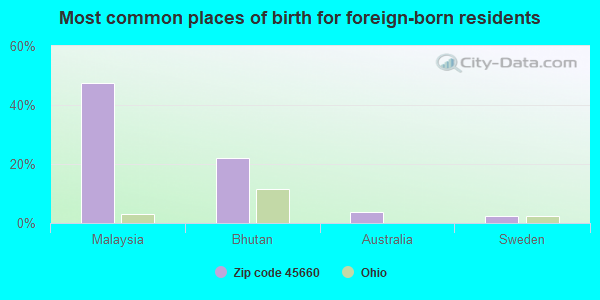
Foreign born population: 130 (1.7%) (32.4% of them are naturalized citizens)
This zip code:
1.7%
Whole state:
5.0%
47%Malaysia
22%Bhutan
4%Australia
2%Sweden
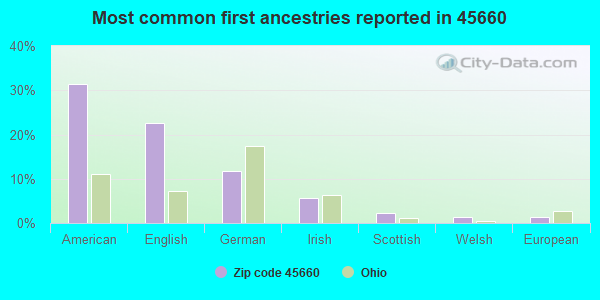
31%American
23%English
12%German
6%Irish
2%Scottish
1%Welsh
1%European
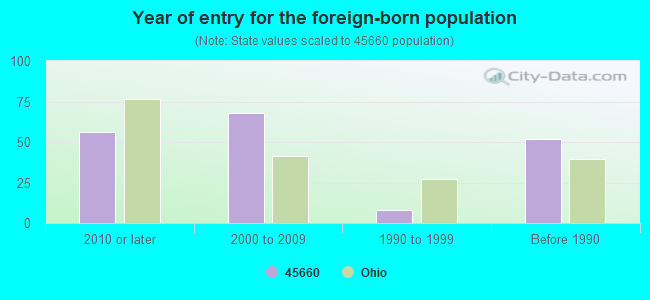
Year of entry for the foreign-born population
562010 or later
682000 to 2009
81990 to 1999
52Before 1990
Facilities with environmental interests located in this zip code:
ADAMS QUARRY, STANDARD LAFARGE (P.O. BOX 250, RT 73 in PEEBLES, OH)
AIR MINOR (AIRS/AFS) Business SIC classification: CUT STONE AND STONE PRODUCTS
BOB MALCOLM CHRYSLER PLYMOUTH DODGE INC (33 DODGE CITY DRIVE in PEEBLES, OH)
Conditionally Exempt Small Quantity Generators, less than 100 kg/month of hazardous waste (Resource Conservation and Recovery Act (tracking hazardous waste)) Alternative names: BOB MALCLOM CHRYSLER-PLYMOUTH DODGE INC
Housing units lacking complete plumbing facilities: 7.9% Housing units lacking complete kitchen facilities: 2.9%
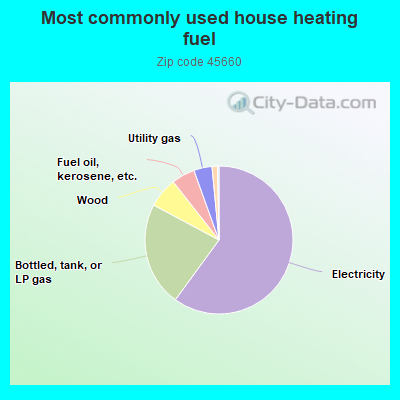
60.1%Electricity
22.8%Bottled, tank, or LP gas
6.6%Wood
5.1%Fuel oil, kerosene, etc.
4.0%Utility gas
1.2%Other fuel
Population in 1990: 7,298. Population change in the 1990s: +602 (+8.2%).
Place of birth for U.S.-born residents:
This state: 6,552
Northeast: 25
Midwest: 192
South: 729
West: 31
59% of the 45660 zip code residents lived in the same house 5 years ago. Out of people who lived in different houses, 63% lived in this county. Out of people who lived in different counties, 50% lived in Ohio.
93% of the 45660 zip code residents lived in the same house 1 year ago. Out of people who lived in different houses, 74% moved from this county. Out of people who lived in different houses, 22% moved from different county within same state. Out of people who lived in different houses, 4% moved from different state.
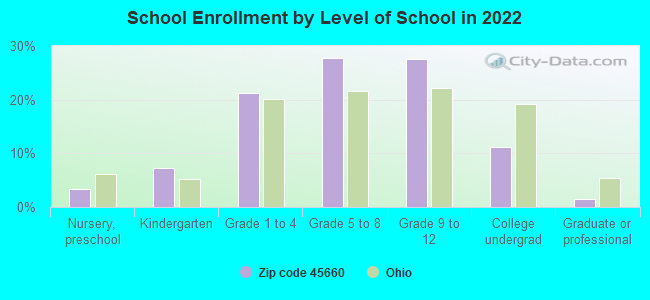
Private vs. public school enrollment:
Students in private schools in grades 1 to 8 (elementary and middle school): 37
Here:
4.8%
Ohio:
16.0%
Students in private schools in grades 9 to 12 (high school): 34
Here:
7.6%
Ohio:
13.1%
Students in private undergraduate colleges: 1
Here:
1.0%
Ohio:
22.3%
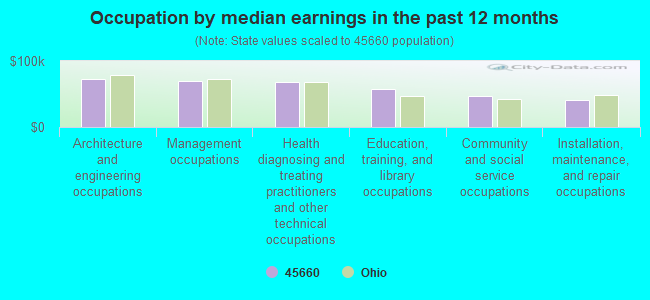
Occupation by median earnings in the past 12 months ($)
73,365Architecture and engineering occupations
70,179Management occupations
68,658Health diagnosing and treating practitioners and other technical occupations
56,940Education, training, and library occupations
46,762Community and social service occupations
41,577Installation, maintenance, and repair occupations
Top industries in this zip code by the number of employees in 2005:
Health Care and Social Assistance: Nursing Care Facilities (50-99 employees: 1 establishment)
Mining: Crushed and Broken Limestone Mining and Quarrying (20-49: 1)
42 people in nursing facilities/skilled-nursing facilities
People in group quarters in 2000:
51 people in other noninstitutional group quarters
47 people in nursing homes
29 people in other group homes
Fatal accident statistics in 2014:
Fatal accident count: 2
Vehicles involved in fatal accidents: 3
Fatal accidents caused by drunken drivers: 0
Fatalities: 2
Persons involved in fatal accidents: 4
Pedestrians involved in fatal accidents: 0
Fatal accident statistics in 2013:
Fatal accident count: 1
Vehicles involved in fatal accidents: 1
Fatal accidents caused by drunken drivers: 0
Fatalities: 1
Persons involved in fatal accidents: 2
Pedestrians involved in fatal accidents: 1
2002 - 2018 National Fire Incident Reporting System (NFIRS) incidents
According to the data from the years 2002 - 2018 the average number of fire incidents per year is 88. The highest number of fires - 135 took place in 2010, and the least - 48 in 2002. The data has a rising trend.
When looking into fire subcategories, the most reports belonged to: Structure Fires (59.7%), and Outside Fires (29.7%).
Fire incident types reported to NFIRS in Zip Code 45660


 Nearest zip codes: 45172, 45646, 45671, 45624, 45679, 45657.
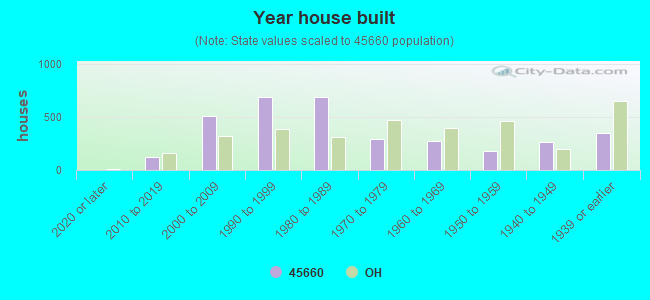


 According to the data from the years 2002 - 2018 the average number of fire incidents per year is 88. The highest number of fires - 135 took place in 2010, and the least - 48 in 2002. The data has a rising trend.
 When looking into fire subcategories, the most reports belonged to: Structure Fires (59.7%), and Outside Fires (29.7%).