Estimated zip code population in 2022: 4,614 Zip code population in 2010: 5,303 Zip code population in 2000: 5,096
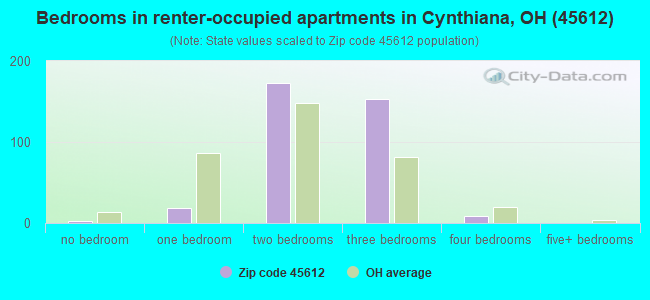
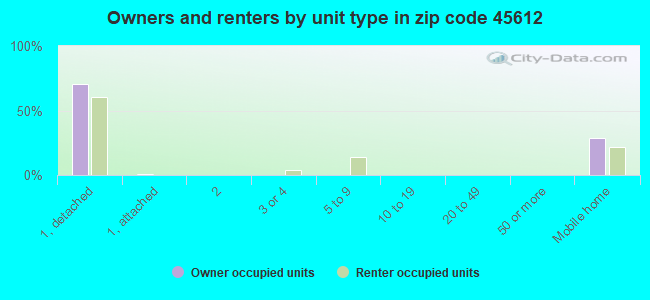
Houses and condos: 2,136 Renter-occupied apartments: 356
% of renters here:
19%
State:
33%
March 2022 cost of living index in zip code 45612: 83.0 (low, U.S. average is 100)
Land area: 113.9 sq. mi. Water area: 0.7 sq. mi.
Population density: 41 people per square mile
(very low).
OSM Map
General Map
Google Map
MSN Map
OSM Map
General Map
Google Map
MSN Map
OSM Map
General Map
Google Map
MSN Map
OSM Map
General Map
Google Map
MSN Map
Please wait while loading the map...
Real estate property taxes paid for housing units in 2022:
This zip code:
0.8% ($1,257)
Ohio:
1.3% ($2,639)
Median real estate property taxes paid for housing units with mortgages in 2022: $1,325 (0.8%) Median real estate property taxes paid for housing units with no mortgage in 2022: $1,078 (1.2%)
Business Search- 14 Million verified businesses
Males: 2,253
(48.8%)
Females: 2,361
(51.2%)
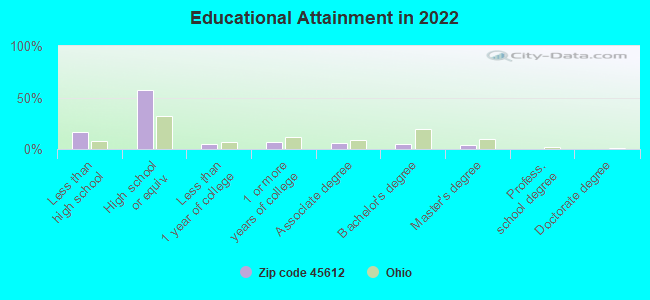
For population 25 years and over in 45612:
High school or higher: 81.6%
Bachelor's degree or higher: 8.5%
Graduate or professional degree: 3.6%
Unemployed: 2.9%
Mean travel time to work (commute): 31.1 minutes
For population 15 years and over in 45612:
Never married: 19.3%
Now married: 60.0%
Separated: 2.6%
Widowed: 7.0%
Divorced: 11.1%
Zip code 45612 compared to state average:
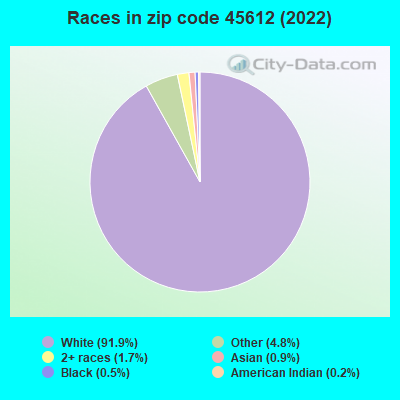
Black race population percentage significantly below state average.
Hispanic race population percentage significantly below state average.
Foreign-born population percentage significantly below state average.
Renting percentage below state average.
Length of stay since moving in above state average.
House age below state average.
Number of college students below state average.
Percentage of population with a bachelor's degree or higher significantly below state average.
Averages for the 2020 tax year for zip code 45612, filed in 2021:
Average Adjusted Gross Income (AGI) in 2020: $45,342 (Individual Income Tax Returns)
Here:
$45,342
State:
$67,288
Salary/wage: $40,843 (reported on 77.6% of returns)
Here:
$40,843
State:
$55,628
(% of AGI for various income ranges: 1221.7% for AGIs below $25k, 3472.0% for AGIs $25k-50k, 6136.2% for AGIs $50k-75k, 10755.5% for AGIs $75k-100k, 17707.8% for AGIs $100k-200k)
Taxable interest for individuals: $769 (reported on 20.5% of returns)
This zip code:
$769
Ohio:
$1,518
(% of AGI for various income ranges: 23.2% for AGIs below $25k, 22.2% for AGIs $25k-50k, 17.9% for AGIs $50k-75k, 20.0% for AGIs $75k-100k, 36.7% for AGIs $100k-200k)
Ordinary dividends: $1,700 (reported on 6.3% of returns)
Here:
$1,700
State:
$7,167
(% of AGI for various income ranges: 6.2% for AGIs below $25k, 6.3% for AGIs $25k-50k, 47.1% for AGIs $50k-75k, 51.1% for AGIs $100k-200k)
Net capital gain/loss in AGI: +$5,546 (reported on 6.3% of returns)
Here:
+$5,546
State:
+$18,919
(% of AGI for various income ranges: 0.2% for AGIs below $25k, 56.5% for AGIs $25k-50k, 35.4% for AGIs $50k-75k, 27.3% for AGIs $75k-100k, 383.3% for AGIs $100k-200k)
Profit/loss from business: +$10,988 (reported on 16.1% of returns)
Here:
+$10,988
State:
+$13,744
(% of AGI for various income ranges: 109.6% for AGIs below $25k, 276.5% for AGIs $25k-50k, 356.7% for AGIs $50k-75k, 425.5% for AGIs $75k-100k, 498.9% for AGIs $100k-200k)
Taxable individual retirement arrangement distribution: $12,577 (reported on 6.3% of returns)
45612:
$12,577
Ohio:
$18,876
(% of AGI for various income ranges: 38.1% for AGIs below $25k, 81.5% for AGIs $25k-50k, 103.3% for AGIs $50k-75k, 736.4% for AGIs $75k-100k)
Total itemized deductions: $25,760 (reported on 2.4% of returns)
Here:
$25,760
State:
$33,869
(% of AGI for various income ranges: 122.4% for AGIs $25k-50k, 659.1% for AGIs $75k-100k)
Charity contributions: $8,850 (reported on 2.0% of returns)
Here:
$8,850
State:
$14,577
(% of AGI for various income ranges: 147.5% for AGIs $50k-75k)
Taxes paid: $5,700 (reported on 2.0% of returns)
45612:
$5,700
State:
$7,681
(% of AGI for various income ranges: 16.1% for AGIs $25k-50k, 140.0% for AGIs $75k-100k)
Earned income credit: $2,371 (reported on 20.5% of returns)
Here:
$2,371
State:
$2,304
(% of AGI for various income ranges: 119.8% for AGIs below $25k, 78.5% for AGIs $25k-50k)
Percentage of individuals using paid preparers for their 2020 taxes: 95.1%
Here:
95%
State:
94%
(% for various income ranges: 96.0% for AGIs below $25k, 95.2% for AGIs $25k-50k, 93.9% for AGIs $50k-75k, 94.4% for AGIs $75k-100k, 94.1% for AGIs $100k-200k)
Averages for the 2012 tax year for zip code 45612, filed in 2013:
Average Adjusted Gross Income (AGI) in 2012: $35,497 (Individual Income Tax Returns)
Here:
$35,497
State:
$54,926
Salary/wage: $33,490 (reported on 75.8% of returns)
Here:
$33,490
State:
$45,869
(% of AGI for various income ranges: 63.9% for AGIs below $25k, 72.4% for AGIs $25k-50k, 76.7% for AGIs $50k-75k, 80.8% for AGIs $75k-100k, 62.6% for AGIs $100k-200k)
Taxable interest for individuals: $773 (reported on 22.7% of returns)
This zip code:
$773
Ohio:
$1,297
(% of AGI for various income ranges: 0.9% for AGIs below $25k, 0.5% for AGIs $25k-50k, 0.3% for AGIs $50k-75k, 0.3% for AGIs $75k-100k, 0.4% for AGIs $100k-200k)
Ordinary dividends: $992 (reported on 6.7% of returns)
Here:
$992
State:
$5,821
(% of AGI for various income ranges: 0.3% for AGIs below $25k, 0.1% for AGIs $25k-50k, 0.2% for AGIs $50k-75k, 0.4% for AGIs $75k-100k)
Net capital gain/loss in AGI: +$3,864 (reported on 5.7% of returns)
Here:
+$3,864
State:
+$11,232
(% of AGI for various income ranges: 0.3% for AGIs $25k-50k, 0.7% for AGIs $50k-75k, 2.5% for AGIs $100k-200k)
Profit/loss from business: +$8,906 (reported on 18.0% of returns)
Here:
+$8,906
State:
+$12,773
(% of AGI for various income ranges: 13.3% for AGIs below $25k, 3.4% for AGIs $25k-50k, 3.2% for AGIs $50k-75k, 3.7% for AGIs $75k-100k)
Taxable individual retirement arrangement distribution: $10,425 (reported on 6.2% of returns)
45612:
$10,425
Ohio:
$14,511
(% of AGI for various income ranges: 1.8% for AGIs below $25k, 1.3% for AGIs $25k-50k, 2.0% for AGIs $50k-75k, 4.9% for AGIs $75k-100k)
Total itemized deductions: $16,190 (24% of AGI, reported on 15.5% of returns)
Here:
$16,190
State:
$21,278
Here:
23.9% of AGI
State:
18.8% of AGI
(% of AGI for various income ranges: 2.8% for AGIs below $25k, 5.5% for AGIs $25k-50k, 8.7% for AGIs $50k-75k, 8.3% for AGIs $75k-100k, 10.6% for AGIs $100k-200k)
Charity contributions: $3,476 (reported on 8.8% of returns)
Here:
$3,476
State:
$3,943
(% of AGI for various income ranges: 0.6% for AGIs $25k-50k, 0.6% for AGIs $50k-75k, 1.0% for AGIs $75k-100k, 2.6% for AGIs $100k-200k)
Taxes paid: $4,652 (reported on 14.9% of returns)
45612:
$4,652
State:
$9,568
(% of AGI for various income ranges: 0.4% for AGIs below $25k, 1.1% for AGIs $25k-50k, 2.1% for AGIs $50k-75k, 2.9% for AGIs $75k-100k, 4.2% for AGIs $100k-200k)
Earned income credit: $2,517 (reported on 23.7% of returns)
Here:
$2,517
State:
$2,285
(% of AGI for various income ranges: 8.0% for AGIs below $25k, 1.1% for AGIs $25k-50k)
Percentage of individuals using paid preparers for their 2012 taxes: 64.4%
Here:
64%
State:
51%
(% for various income ranges: 60.2% for AGIs below $25k, 68.5% for AGIs $25k-50k, 67.9% for AGIs $50k-75k, 63.6% for AGIs $75k-100k, 75.0% for AGIs $100k-200k)
Averages for the 2004 tax year for zip code 45612, filed in 2005:
Average Adjusted Gross Income (AGI) in 2004: $29,975 (Individual Income Tax Returns)
Here:
$29,975
State:
$44,480
Salary/wage: $28,611 (reported on 84.9% of returns)
Here:
$28,611
State:
$39,198
(% of AGI for various income ranges: 94.4% for AGIs below $10k, 74.3% for AGIs $10k-25k, 82.9% for AGIs $25k-50k, 83.5% for AGIs $50k-75k, 85.8% for AGIs $75k-100k, 67.1% for AGIs over 100k)
Taxable interest for individuals: $972 (reported on 32.7% of returns)
This zip code:
$972
Ohio:
$1,532
(% of AGI for various income ranges: 2.7% for AGIs below $10k, 1.5% for AGIs $10k-25k, 1.1% for AGIs $25k-50k, 1.0% for AGIs $50k-75k, 0.3% for AGIs $75k-100k, 0.5% for AGIs over 100k)
Taxable dividends: $1,206 (reported on 8.8% of returns)
Here:
$1,206
State:
$3,496
(% of AGI for various income ranges: 0.2% for AGIs below $10k, 0.5% for AGIs $10k-25k, 0.3% for AGIs $25k-50k, 0.3% for AGIs $50k-75k, 0.0% for AGIs $75k-100k, 0.9% for AGIs over 100k)
Net capital gain/loss: +$3,076 (reported on 7.7% of returns)
Here:
+$3,076
State:
+$8,582
(% of AGI for various income ranges: 0.8% for AGIs below $10k, 0.2% for AGIs $10k-25k, 0.7% for AGIs $25k-50k, 1.0% for AGIs $50k-75k, 3.2% for AGIs over 100k)
Profit/loss from business: +$5,833 (reported on 15.9% of returns)
Here:
+$5,833
State:
+$10,813
(% of AGI for various income ranges: 6.5% for AGIs below $10k, 5.7% for AGIs $10k-25k, 3.4% for AGIs $25k-50k, 2.5% for AGIs $50k-75k, 0.6% for AGIs $75k-100k)
IRA payment deduction: $2,045 (reported on 1.1% of returns)
45612:
$2,045
Ohio:
$2,794
Total itemized deductions: $14,344 (25% of AGI, reported on 15.5% of returns)
Here:
$14,344
State:
$17,503
Here:
25.1% of AGI
State:
20.8% of AGI
(% of AGI for various income ranges: 5.0% for AGIs $10k-25k, 6.0% for AGIs $25k-50k, 8.3% for AGIs $50k-75k, 10.7% for AGIs $75k-100k, 15.2% for AGIs over 100k)
Charity contributions deductions: $2,481 (4% of AGI, reported on 9.3% of returns)
Here:
$2,481
State:
$3,087
Here:
4.0% of AGI
State:
3.4% of AGI
(% of AGI for various income ranges: 0.3% for AGIs $10k-25k, 0.4% for AGIs $25k-50k, 0.8% for AGIs $50k-75k, 1.8% for AGIs $75k-100k, 2.1% for AGIs over 100k)
Total tax: $3,087 (reported on 71.3% of returns)
45612:
$3,087
State:
$6,781
(% of AGI for various income ranges: 3.0% for AGIs below $10k, 4.1% for AGIs $10k-25k, 6.3% for AGIs $25k-50k, 8.2% for AGIs $50k-75k, 10.2% for AGIs $75k-100k, 14.8% for AGIs over 100k)
Earned income credit: $1,623 (reported on 21.3% of returns)
Here:
$1,623
State:
$1,696
Percentage of individuals using paid preparers for their 2004 taxes: 65.5%
Here:
66%
State:
55%
(% for various income ranges: 56.6% for AGIs below $10k, 71.4% for AGIs $10k-25k, 68.1% for AGIs $25k-50k, 60.3% for AGIs $50k-75k, 67.1% for AGIs $75k-100k, 62.9% for AGIs over 100k)
Likely homosexual households (counted as self-reported same-sex unmarried-partner households)
Lesbian couples: 0.1% of all households
Gay men: 0.0% of all households
Household received Food Stamps/SNAP in the past 12 months: 270 Household did not receive Food Stamps/SNAP in the past 12 months: 1,613
Women who had a birth in the past 12 months: 72 (49 now married, 22 unmarried) Women who did not have a birth in the past 12 months: 779 (453 now married, 325 unmarried)
Housing units in zip code 45612 with a mortgage: 738 (10 second mortgage, 10 both second mortgage and home equity loan) Houses without a mortgage: 16
Median monthly owner costs for units with a mortgage: $1,266 Median monthly owner costs for units without a mortgage: $404
Residents with income below the poverty level in 2022:
This zip code:
13.2%
Whole state:
13.4%
Residents with income below 50% of the poverty level in 2022:
This zip code:
8.4%
Whole state:
7.0%
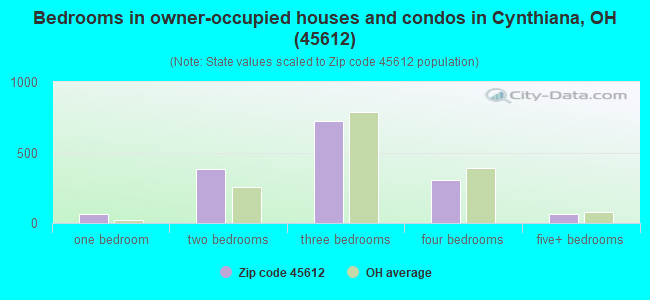
Median number of rooms in houses and condos:
Here:
6.1
State:
6.7
Median number of rooms in apartments:
Here:
4.3
State:
4.4
Notable locations in this zip code not listed on our city pages
Notable locations in zip code 45612: Valley Vista Golf Course (A), The Seven Caves (B), Pickett Run Farm (C), Shoemaker Farm (D), Paxton Township Area Life Squad (E), Bainbridge Fire Department (F). Display/hide their locations on the map
Churches in zip code 45612 include: Beech Flats Church (A), Fairview Church (B), Pinetop Chapel (C), Ross-Pike County Tabernacle (D), Storms Church (E), Sunnyside Church (F), Bainbridge Church of Christ (G), Bainbridge Presbyterian Church (H), Bainbridge United Methodist Church (I). Display/hide their locations on the map
Cemeteries: Alderman Cemetery (1), Benner Cemetery (2), Shoults Cemetery (3), Boyd Cemetery (4), Snyder Cemetery (5), Storms Cemetery (6), Summers Cemetery (7). Display/hide their locations on the map
Streams, rivers, and creeks: Heads Branch (A), Factory Branch (B), Cove Run (C), Buckskin Creek (D), Puncheon Run (E), Plum Run (F), Cliff Creek (G), Massie Run (H), Minnehan Run (I). Display/hide their locations on the map
In group quarters: 51 (-1 institutionalized population)
Size of family households: 673 2-persons, 278 3-persons, 133 4-persons, 75 5-persons, 2 6-persons, 78 7-or-more-persons
Size of nonfamily households: 531 1-person, 85 2-persons, 23 3-persons
808 married couples with children.
201 single-parent households (43 men, 158 women).
90.0% of residents of 45612 zip code speak English at home.
10.6% of residents speak other Indo-European language at home (90% very well, 7% well, 3% not well).
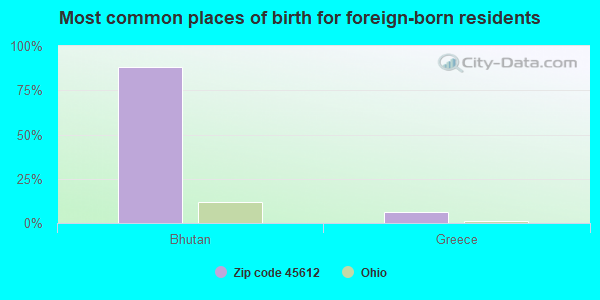
Foreign born population: 33 (0.7%) (9.2% of them are naturalized citizens)
This zip code:
0.7%
Whole state:
5.0%
88%Bhutan
6%Greece
28%American
19%German
16%English
7%Irish
5%European
2%Dutch
2%Scandinavian
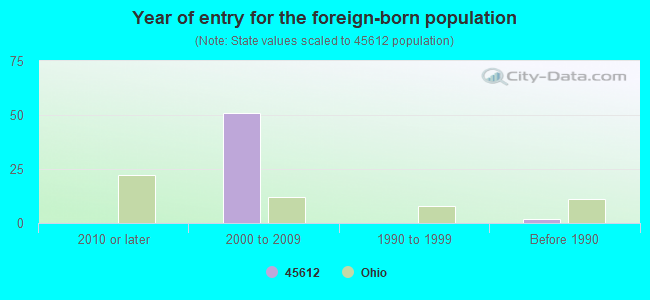
Year of entry for the foreign-born population
02010 or later
512000 to 2009
01990 to 1999
2Before 1990
Facilities with environmental interests located in this zip code:
BAINBRIDGE MANOR APTS (SHAWNEE ST in BAINBRIDGE, OH)
STATE MASTER (Ohio general info) - PCS-OH0115215, National Pollutant Discharge Elimination System Permit National Pollutant Discharge Elimination System NON-MAJOR (Tracking pollutant discharge elimination systems) - permit Business SIC classification: SEWERAGE SYSTEMS; OPERATORS OF APARTMENT BUILDINGS Organizations: POINTLAND INVESTMENT GROUP (CONTACT/OWNER)
Alternative names: POINTLAND INVESTMENT GROUP, POINTLAND INVESTMENT GROUP BAINBRIDGE MANOR APTS
Housing units lacking complete plumbing facilities: 6.4% Housing units lacking complete kitchen facilities: 4.5%
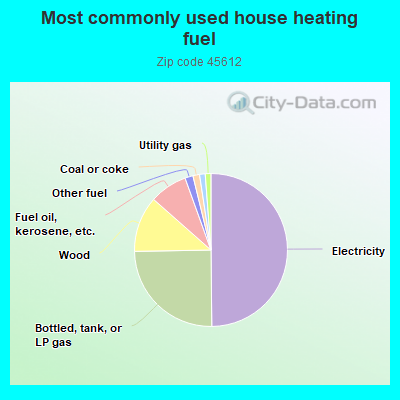
49.9%Electricity
24.9%Bottled, tank, or LP gas
11.8%Wood
8.0%Fuel oil, kerosene, etc.
1.7%Other fuel
1.4%Coal or coke
1.2%No fuel used
1.2%Utility gas
Population in 1990: 4,356. Population change in the 1990s: +740 (+17.0%).
Place of birth for U.S.-born residents:
This state: 3,915
Northeast: 278
Midwest: 109
South: 193
West: 60
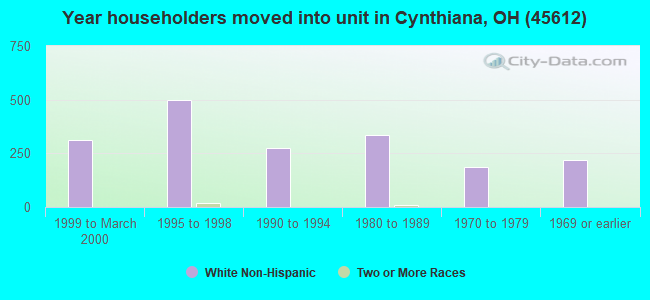
60% of the 45612 zip code residents lived in the same house 5 years ago. Out of people who lived in different houses, 54% lived in this county. Out of people who lived in different counties, 50% lived in Ohio.
97% of the 45612 zip code residents lived in the same house 1 year ago. Out of people who lived in different houses, 52% moved from this county. Out of people who lived in different houses, 38% moved from different county within same state. Out of people who lived in different houses, 28% moved from different state.
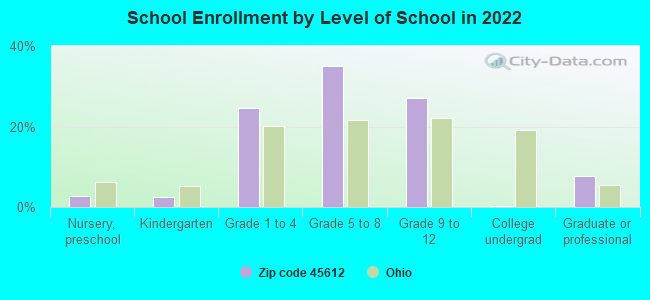
Private vs. public school enrollment:
Students in private schools in grades 1 to 8 (elementary and middle school): 116
Here:
23.0%
Ohio:
16.0%
Students in private schools in grades 9 to 12 (high school):
Here:
0.0%
Ohio:
13.1%
Students in private undergraduate colleges: 1
Here:
49.2%
Ohio:
22.3%
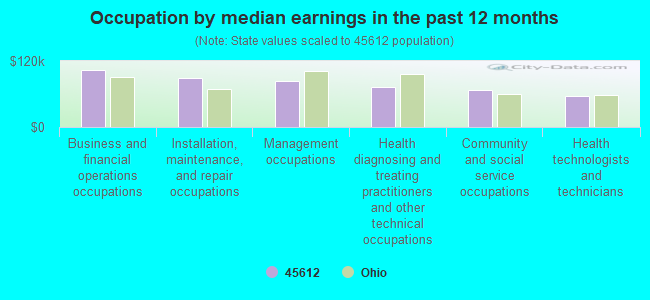
Occupation by median earnings in the past 12 months ($)
102,750Business and financial operations occupations
88,858Installation, maintenance, and repair occupations
84,465Management occupations
73,581Health diagnosing and treating practitioners and other technical occupations
67,349Community and social service occupations
56,438Health technologists and technicians
Companies with federal contracts located in this zip code:
L & D BLACKTOP MAINTENANCE (303 E 2ND in BAINBRIDGE, OH; small business) 3 employees, $30000 revenue.
$4,000 with National Park Service for Maintenance, Repair or Alteration of Real Property -- Parking Facilities Conservation. Signed on 2001-08-15. Completion date: 2001-10-15.
Top industries in this zip code by the number of employees in 2005:
Health Care and Social Assistance: Other Residential Care Facilities (50-99 employees: 1 establishment)
Health Care and Social Assistance: Nursing Care Facilities (50-99: 1)
Finance and Insurance: Commercial Banking (20-49: 1)
Accommodation and Food Services: Full-Service Restaurants (10-19: 1, 5-9: 1)
Construction: Plumbing, Heating, and Air-Conditioning Contractors (10-19: 1)
People in group quarters in 2010:
57 people in residential treatment centers for juveniles (non-correctional)
17 people in nursing facilities/skilled-nursing facilities
People in group quarters in 2000:
50 people in training schools for juvenile delinquents
20 people in nursing homes
3 people in other group homes
Fatal accident statistics in 2014:
Fatal accident count: 1
Vehicles involved in fatal accidents: 1
Fatal accidents caused by drunken drivers: 0
Fatalities: 1
Persons involved in fatal accidents: 1
Pedestrians involved in fatal accidents: 0
Fatal accident statistics in 2012:
Fatal accident count: 1
Vehicles involved in fatal accidents: 1
Fatal accidents caused by drunken drivers: 1
Fatalities: 1
Persons involved in fatal accidents: 1
Pedestrians involved in fatal accidents: 0
2002 - 2018 National Fire Incident Reporting System (NFIRS) incidents
According to the data from the years 2002 - 2018 the average number of fires per year is 45. The highest number of fire incidents - 77 took place in 2014, and the least - 16 in 2002. The data has a rising trend.
When looking into fire subcategories, the most incidents belonged to: Structure Fires (56.1%), and Outside Fires (30.7%).
Fire incident types reported to NFIRS in Zip Code 45612

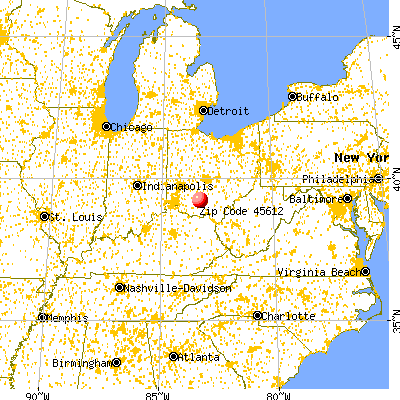


 Nearest zip codes: 45624, 45681, 45646, 45617, 45172, 45123.
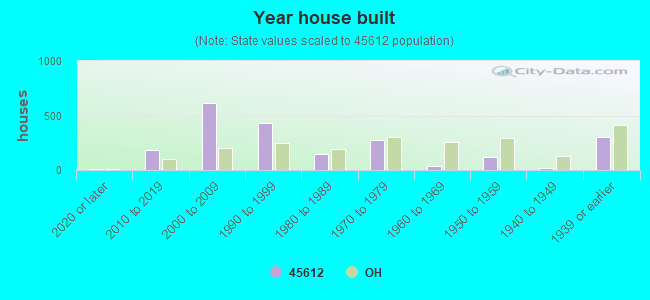


 According to the data from the years 2002 - 2018 the average number of fires per year is 45. The highest number of fire incidents - 77 took place in 2014, and the least - 16 in 2002. The data has a rising trend.
 When looking into fire subcategories, the most incidents belonged to: Structure Fires (56.1%), and Outside Fires (30.7%).