Estimated zip code population in 2022: 362 Zip code population in 2010: 376 Zip code population in 2000: 430
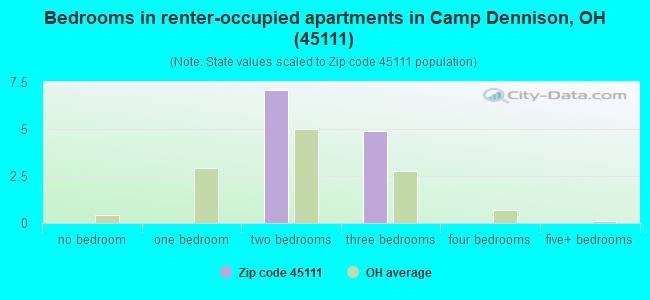
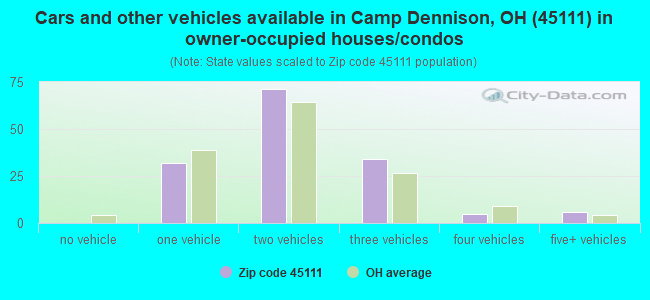
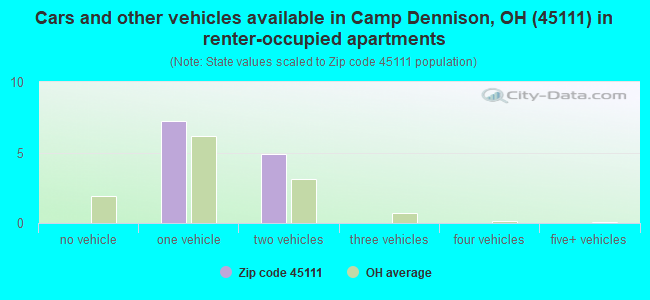
Houses and condos: 157 Renter-occupied apartments: 12
% of renters here:
8%
State:
33%
March 2022 cost of living index in zip code 45111: 85.1 (less than average, U.S. average is 100)
Land area: 0.8 sq. mi. Water area: 0.0 sq. mi.
Population density: 474 people per square mile
(low).
OSM Map
General Map
Google Map
MSN Map
OSM Map
General Map
Google Map
MSN Map
OSM Map
General Map
Google Map
MSN Map
OSM Map
General Map
Google Map
MSN Map
Please wait while loading the map...
Real estate property taxes paid for housing units in 2022:
This zip code:
1.2% ($2,751)
Ohio:
1.3% ($2,639)
Median real estate property taxes paid for housing units with mortgages in 2022: $2,565 (1.0%) Median real estate property taxes paid for housing units with no mortgage in 2022: $2,850 (1.8%)
Business Search- 14 Million verified businesses
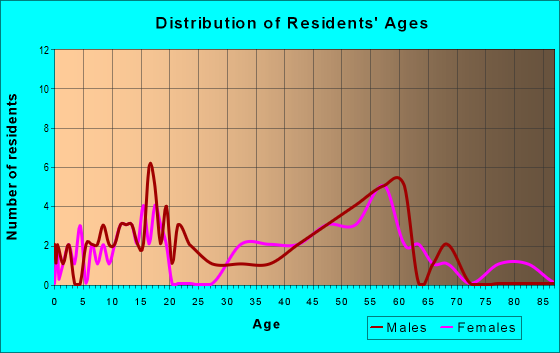
Males: 165
(45.8%)
Females: 196
(54.2%)
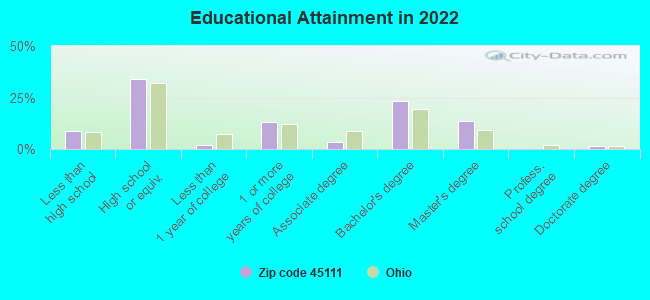
For population 25 years and over in 45111:
High school or higher: 90.7%
Bachelor's degree or higher: 38.2%
Graduate or professional degree: 15.3%
Mean travel time to work (commute): 28.0 minutes
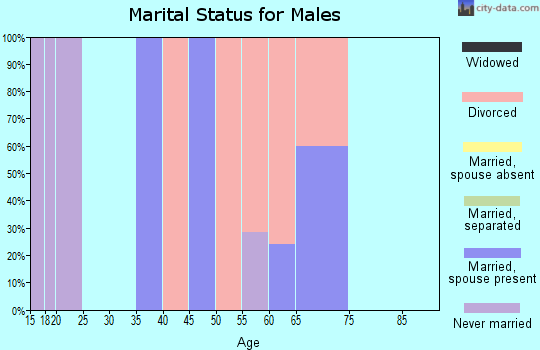
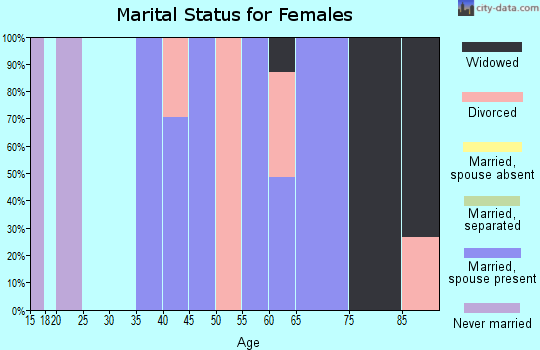
For population 15 years and over in 45111:
Never married: 25.0%
Now married: 52.1%
Separated: 1.5%
Widowed: 3.8%
Divorced: 17.6%
Zip code 45111 compared to state average:
Unemployed percentage significantly below state average.
Median age significantly above state average.
Foreign-born population percentage significantly below state average.
Renting percentage significantly below state average.
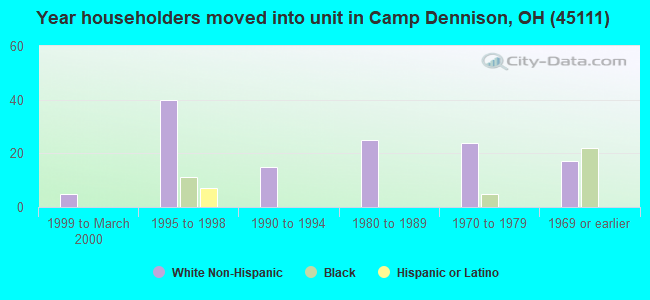
Length of stay since moving in significantly above state average.
Number of college students below state average.
Percentage of population with a bachelor's degree or higher above state average.
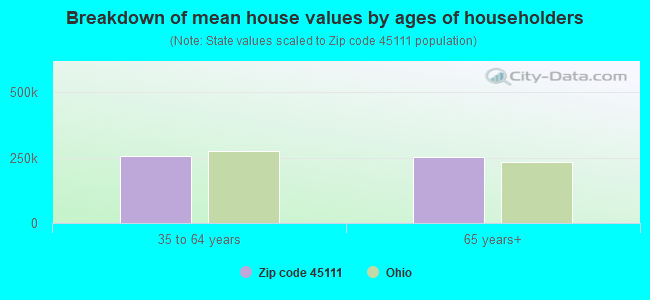
Estimated median house/condo value in 2022: $236,613
45111:
$236,613
Ohio:
$204,100
Median resident age:
This zip code:
57.4 years
Ohio median age:
39.9 years
Average household size:
This zip code:
2.3 people
Ohio:
2.4 people
Averages for the 2020 tax year for zip code 45111, filed in 2021:
Average Adjusted Gross Income (AGI) in 2020: $75,255 (Individual Income Tax Returns)
Here:
$75,255
State:
$67,288
Salary/wage: $53,678 (reported on 81.8% of returns)
Here:
$53,678
State:
$55,628
(% of AGI for various income ranges: 996.0% for AGIs below $25k, 2488.3% for AGIs $25k-50k)
Taxable interest for individuals: $350 (reported on 27.3% of returns)
This zip code:
$350
Ohio:
$1,518
(% of AGI for various income ranges: 15.0% for AGIs $25k-50k)
Ordinary dividends: $3,200 (reported on 18.2% of returns)
Here:
$3,200
State:
$7,167
(% of AGI for various income ranges: 30.0% for AGIs below $25k)
Net capital gain/loss in AGI: +$3,400 (reported on 13.6% of returns)
Here:
+$3,400
State:
+$18,919
(% of AGI for various income ranges: 170.0% for AGIs $25k-50k)
Profit/loss from business: +$13,700 (reported on 18.2% of returns)
Here:
+$13,700
State:
+$13,744
(% of AGI for various income ranges: )
Earned income credit: $2,250 (reported on 9.1% of returns)
Here:
$2,250
State:
$2,304
(% of AGI for various income ranges: 90.0% for AGIs below $25k)
Percentage of individuals using paid preparers for their 2020 taxes: 86.4%
Here:
86%
State:
94%
(% for various income ranges: 85.7% for AGIs below $25k, 83.3% for AGIs $25k-50k, 133.3% for AGIs $50k-75k, 0.0% for AGIs $75k-100k, 100.0% for AGIs $100k-200k)
Averages for the 2012 tax year for zip code 45111, filed in 2013:
Average Adjusted Gross Income (AGI) in 2012: $46,838 (Individual Income Tax Returns)
Here:
$46,838
State:
$54,926
Salary/wage: $40,067 (reported on 85.7% of returns)
Here:
$40,067
State:
$45,869
(% of AGI for various income ranges: 76.9% for AGIs below $25k, 78.0% for AGIs $25k-50k, 73.4% for AGIs $50k-75k, 69.6% for AGIs $100k-200k)
Taxable interest for individuals: $217 (reported on 28.6% of returns)
This zip code:
$217
Ohio:
$1,297
(% of AGI for various income ranges: 0.2% for AGIs below $25k, 0.4% for AGIs $50k-75k)
Ordinary dividends: $1,675 (reported on 19.0% of returns)
Here:
$1,675
State:
$5,821
(% of AGI for various income ranges: 2.3% for AGIs $50k-75k)
Net capital gain/loss in AGI: +$900 (reported on 9.5% of returns)
Here:
+$900
State:
+$11,232
(% of AGI for various income ranges: 1.9% for AGIs below $25k)
Profit/loss from business: +$11,750 (reported on 19.0% of returns)
Here:
+$11,750
State:
+$12,773
(% of AGI for various income ranges: 20.9% for AGIs $25k-50k)
Total itemized deductions: $19,167 (21% of AGI, reported on 28.6% of returns)
Here:
$19,167
State:
$21,278
Here:
21.1% of AGI
State:
18.8% of AGI
(% of AGI for various income ranges: 24.9% for AGIs $25k-50k, 15.8% for AGIs $100k-200k)
Charity contributions: $1,680 (reported on 23.8% of returns)
Here:
$1,680
State:
$3,943
(% of AGI for various income ranges: 2.9% for AGIs below $25k, 2.0% for AGIs $50k-75k)
Taxes paid: $6,086 (reported on 33.3% of returns)
45111:
$6,086
State:
$9,568
(% of AGI for various income ranges: 8.5% for AGIs $25k-50k, 6.3% for AGIs $100k-200k)
Earned income credit: $1,900 (reported on 19.0% of returns)
Here:
$1,900
State:
$2,285
(% of AGI for various income ranges: 8.1% for AGIs below $25k)
Percentage of individuals using paid preparers for their 2012 taxes: 52.4%
Here:
52%
State:
51%
(% for various income ranges: 33.3% for AGIs below $25k, 66.7% for AGIs $25k-50k, 100.0% for AGIs $50k-75k, 0.0% for AGIs $100k-200k)
Averages for the 2004 tax year for zip code 45111, filed in 2005:
Average Adjusted Gross Income (AGI) in 2004: $40,202 (Individual Income Tax Returns)
Here:
$40,202
State:
$44,480
Salary/wage: $37,847 (reported on 81.7% of returns)
Here:
$37,847
State:
$39,198
(% of AGI for various income ranges: 60.2% for AGIs below $10k, 70.1% for AGIs $10k-25k, 82.2% for AGIs $25k-50k, 90.3% for AGIs $50k-75k, 81.8% for AGIs $75k-100k, 62.7% for AGIs over 100k)
Taxable interest for individuals: $387 (reported on 36.1% of returns)
This zip code:
$387
Ohio:
$1,532
(% of AGI for various income ranges: 3.3% for AGIs below $10k, 0.6% for AGIs $10k-25k, 0.4% for AGIs $25k-50k, 0.3% for AGIs $50k-75k, 0.2% for AGIs over 100k)
Taxable dividends: $850 (reported on 19.2% of returns)
Here:
$850
State:
$3,496
Net capital gain/loss: +$1,250 (reported on 11.5% of returns)
Here:
+$1,250
State:
+$8,582
Profit/loss from business: +$7,862 (reported on 13.9% of returns)
Here:
+$7,862
State:
+$10,813
Total itemized deductions: $15,915 (23% of AGI, reported on 28.4% of returns)
Here:
$15,915
State:
$17,503
Here:
23.3% of AGI
State:
20.8% of AGI
Charity contributions deductions: $2,383 (3% of AGI, reported on 22.6% of returns)
Here:
$2,383
State:
$3,087
Here:
3.3% of AGI
State:
3.4% of AGI
Total tax: $5,518 (reported on 78.8% of returns)
45111:
$5,518
State:
$6,781
(% of AGI for various income ranges: 3.3% for AGIs below $10k, 6.1% for AGIs $10k-25k, 7.6% for AGIs $25k-50k, 9.2% for AGIs $50k-75k, 10.8% for AGIs $75k-100k, 17.9% for AGIs over 100k)
Earned income credit: $1,370 (reported on 13.0% of returns)
Here:
$1,370
State:
$1,696
Percentage of individuals using paid preparers for their 2004 taxes: 49.5%
Here:
50%
State:
55%
(% for various income ranges: 39.5% for AGIs below $10k, 47.1% for AGIs $10k-25k, 48.3% for AGIs $25k-50k, 46.9% for AGIs $50k-75k, 158.3% for AGIs $75k-100k)
Household received Food Stamps/SNAP in the past 12 months: 6 Household did not receive Food Stamps/SNAP in the past 12 months: 152
Women who did not have a birth in the past 12 months: 67 (27 now married, 39 unmarried)
Housing units in zip code 45111 with a mortgage: 71 (9 second mortgage, 9 both second mortgage and home equity loan) Median monthly owner costs for units with a mortgage: $1,536 Median monthly owner costs for units without a mortgage: $565
Residents with income below the poverty level in 2022:
This zip code:
11.3%
Whole state:
13.4%
Residents with income below 50% of the poverty level in 2022:
This zip code:
3.5%
Whole state:
7.0%
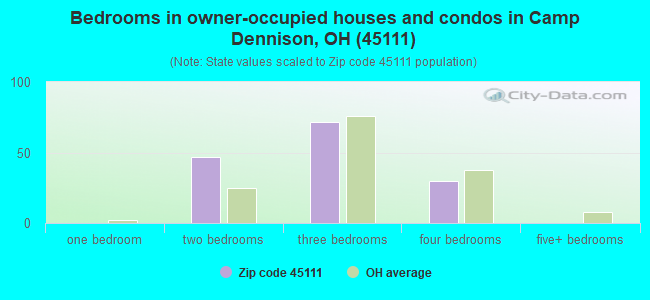
Median number of rooms in houses and condos:
Here:
6.4
State:
6.7
Notable locations in this zip code not listed on our city pages
Tourist attractions (not listed on the city page) : Camp Dennison Civil War Museum Dar (7509 Glendale Milford Road), Christian Waldschmidt Homestead Dar (Museums; 7509 Glendale Milford Road).
Size of family households: 51 2-persons, 46 3-persons, 5 4-persons, 3 5-persons
Size of nonfamily households: 39 1-person, 10 2-persons, 2 4-persons
35 married couples with children.
0 single-parent households ().
99.7% of residents of 45111 zip code speak English at home.
0.6% of residents speak Spanish at home (100% very well).
Foreign born population: 0 (0.0%)
:
0.0%
Whole state:
5.0%
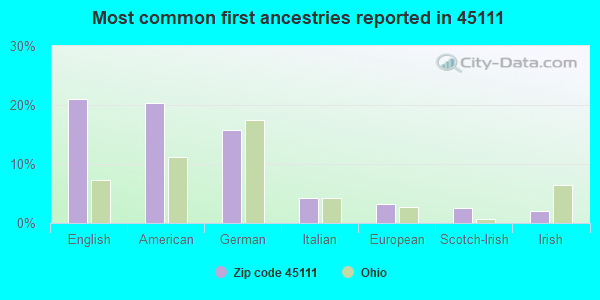
21%English
20%American
16%German
4%Italian
3%European
3%Scotch-Irish
2%Irish
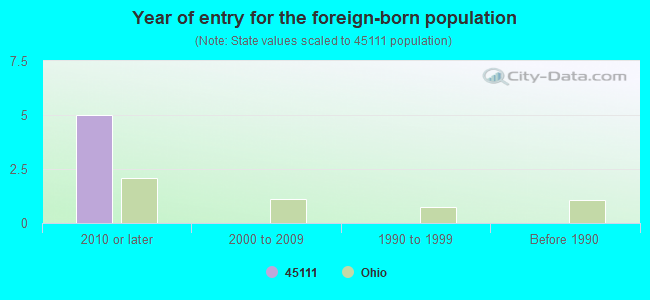
Year of entry for the foreign-born population
52010 or later
02000 to 2009
01990 to 1999
0Before 1990
Facilities with environmental interests located in this zip code:
BARRETT PAVING MATERIALS INC (US RTE BYPASS SO in LOVELAND, OH)
AIR MINOR (AIRS/AFS) STATE MASTER (Ohio general info) - AIR MAJOR Business SIC classification: ASPHALT PAVING MIXTURES AND BLOCKS
BP OIL CO (3180 W US 22 3 in LOVELAND, OH)
STATE MASTER (Ohio general info) - RCRA-OHD987014479, HAZARDOUS WASTE PROGRAM Conditionally Exempt Small Quantity Generators, less than 100 kg/month of hazardous waste (Resource Conservation and Recovery Act (tracking hazardous waste)) - notification Organizations: BP OIL COMPANY (CONTACT/OWNER)
BILLS AUTO SHOP (1583 ST RTE 28 in LOVELAND, OH)
Small Quantity Generators, between 100 kg and 1000 kg of hazardous waste/month (Resource Conservation and Recovery Act (tracking hazardous waste)) - notification Organizations: VAN DE PAS BILL (CONTACT/OWNER)
CENTURY MOTORS INC (10575 LOVELAND MADEIRA RD in LOVELAND, OH)
Conditionally Exempt Small Quantity Generators, less than 100 kg/month of hazardous waste (Resource Conservation and Recovery Act (tracking hazardous waste)) Organizations: CONNELLY EDWARD G (CONTACT/OWNER)
ALCON INC (6522 SNIDER RD in LOVELAND, OH)
Conditionally Exempt Small Quantity Generators, less than 100 kg/month of hazardous waste (Resource Conservation and Recovery Act (tracking hazardous waste)) - notification Organizations: SORFLATEN CHESTER G (CONTACT/OWNER)
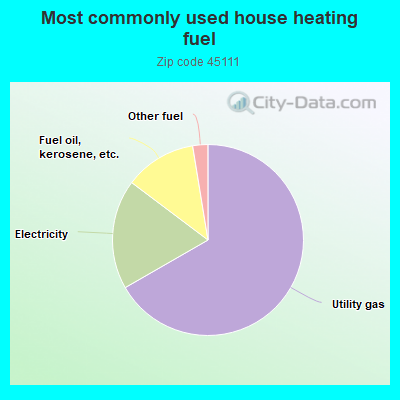
67.5%Utility gas
18.8%Electricity
12.3%Fuel oil, kerosene, etc.
2.6%Other fuel
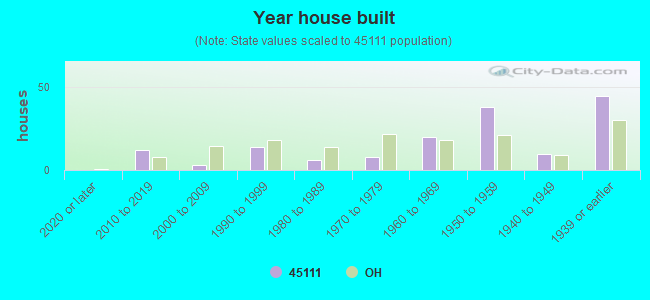
Population in 1990: 482.
Place of birth for U.S.-born residents:
This state: 311
Midwest: 9
South: 22
West: 13
70% of the 45111 zip code residents lived in the same house 5 years ago. Out of people who lived in different houses, 57% lived in this county. Out of people who lived in different counties, 50% lived in Ohio.
97% of the 45111 zip code residents lived in the same house 1 year ago. Out of people who lived in different houses, 55% moved from this county. Out of people who lived in different houses, 64% moved from abroad.
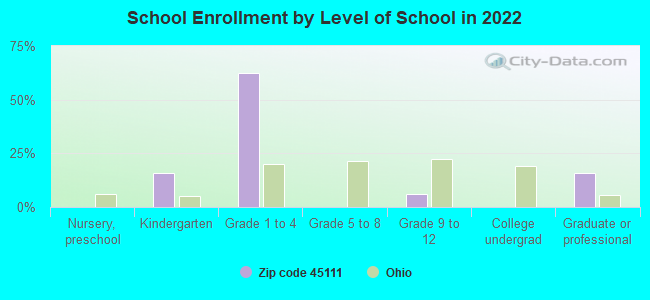
Private vs. public school enrollment:
Students in private schools in grades 1 to 8 (elementary and middle school):
Here:
0.0%
Ohio:
16.0%
Students in private schools in grades 9 to 12 (high school):
Here:
0.0%
Ohio:
13.1%
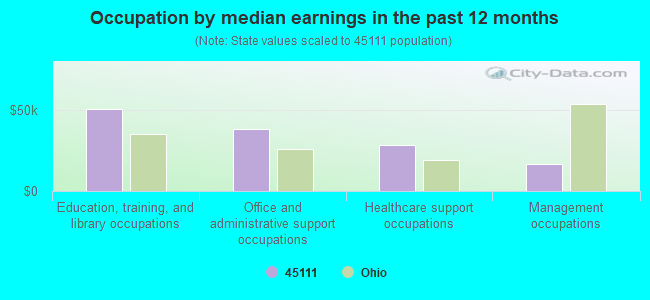
Occupation by median earnings in the past 12 months ($)
50,526Education, training, and library occupations
38,302Office and administrative support occupations
28,350Healthcare support occupations
16,658Management occupations
Companies with federal contracts located in this zip code:
AEROSPACE INTERNATIONAL MATERI (8500 GLENDALE-MILFORD ROAD in CAMP DENNISON, OH; small business) : $256,651 in 7 contractsfrom 2002 to 2005
Contracts for Additive Metal Materials, Plate, Sheet, Strip, and Foil; Nonferrous Base Metal by Air Force, Defense Logistics Agency Signed by year:2000: $0; 2001: $0; 2002: $59,019; 2003: $69,055; 2004: $54,727; 2005: $73,850; 2006: $0.
Biggest contracts:
$69,055 with Air Force for Additive Metal Materials. Signed on 2003-07-09. Completion date: 2003-07-30.
$59,019 with Air Force for Plate, Sheet, Strip, and Foil; Nonferrous Base Metal. Signed on 2002-06-07. Completion date: 2002-06-28.
$49,625 with Defense Logistics Agency for Plate, Sheet, Strip, and Foil; Nonferrous Base Metal. Signed on 2005-09-07. Completion date: 2006-03-13.
$42,987, same as above.Signed on 2004-10-26. Completion date: 2004-12-31.
Top industries in this zip code by the number of employees in 2005:
Accommodation and Food Services: Full-Service Restaurants (10-19 employees: 1 establishment)
Construction: Highway, Street, and Bridge Construction (5-9: 1)
Other Services (except Public Administration): Civic and Social Organizations (1-4: 1)
Home Mortgage Disclosure Act Aggregated Statistics For Year 2009 (Based on 2 partial tracts)
A) FHA, FSA/RHS & VA Home Purchase Loans
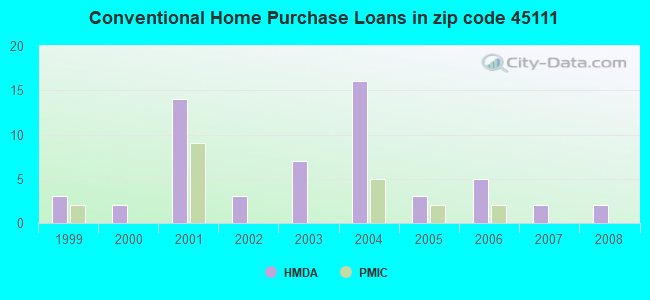
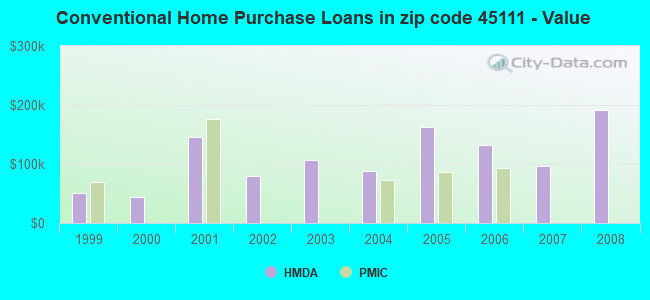
B) Conventional Home Purchase Loans
C) Refinancings
D) Home Improvement Loans
F) Non-occupant Loans on < 5 Family Dwellings (A B C & D)
G) Loans On Manufactured Home Dwelling (A B C & D)
Number
Average Value
Number
Average Value
Number
Average Value
Number
Average Value
Number
Average Value
Number
Average Value
LOANS ORIGINATED
3
$169,380
0
$0
10
$170,018
0
$0
0
$0
0
$0
APPLICATIONS APPROVED, NOT ACCEPTED
0
$0
0
$0
2
$233,185
0
$0
0
$0
0
$0
APPLICATIONS DENIED
0
$0
2
$26,975
16
$163,688
3
$89,330
2
$43,505
2
$26,975
APPLICATIONS WITHDRAWN
0
$0
0
$0
2
$95,710
0
$0
0
$0
0
$0
FILES CLOSED FOR INCOMPLETENESS
0
$0
0
$0
0
$0
0
$0
0
$0
0
$0
Aggregated Statistics For Year 2008 (Based on 2 partial tracts)
A) FHA, FSA/RHS & VA Home Purchase Loans
B) Conventional Home Purchase Loans
C) Refinancings
D) Home Improvement Loans
F) Non-occupant Loans on < 5 Family Dwellings (A B C & D)
Number
Average Value
Number
Average Value
Number
Average Value
Number
Average Value
Number
Average Value
LOANS ORIGINATED
2
$99,190
2
$192,290
5
$247,804
2
$160,970
0
$0
APPLICATIONS APPROVED, NOT ACCEPTED
0
$0
0
$0
2
$84,400
0
$0
0
$0
APPLICATIONS DENIED
0
$0
0
$0
7
$152,889
5
$109,980
2
$30,455
APPLICATIONS WITHDRAWN
0
$0
0
$0
2
$192,290
0
$0
0
$0
FILES CLOSED FOR INCOMPLETENESS
0
$0
0
$0
0
$0
0
$0
0
$0
Aggregated Statistics For Year 2007 (Based on 2 partial tracts)
B) Conventional Home Purchase Loans
C) Refinancings
D) Home Improvement Loans
F) Non-occupant Loans on < 5 Family Dwellings (A B C & D)
G) Loans On Manufactured Home Dwelling (A B C & D)
Number
Average Value
Number
Average Value
Number
Average Value
Number
Average Value
Number
Average Value
LOANS ORIGINATED
2
$97,450
23
$124,008
0
$0
3
$133,417
2
$22,625
APPLICATIONS APPROVED, NOT ACCEPTED
0
$0
10
$136,084
2
$43,505
2
$89,620
0
$0
APPLICATIONS DENIED
0
$0
10
$204,299
3
$22,623
2
$59,165
0
$0
APPLICATIONS WITHDRAWN
0
$0
16
$157,162
0
$0
2
$107,020
2
$21,755
FILES CLOSED FOR INCOMPLETENESS
0
$0
0
$0
0
$0
0
$0
0
$0
Aggregated Statistics For Year 2006 (Based on 2 partial tracts)
B) Conventional Home Purchase Loans
C) Refinancings
D) Home Improvement Loans
F) Non-occupant Loans on < 5 Family Dwellings (A B C & D)
Number
Average Value
Number
Average Value
Number
Average Value
Number
Average Value
LOANS ORIGINATED
5
$131,560
31
$130,515
2
$43,505
7
$102,423
APPLICATIONS APPROVED, NOT ACCEPTED
2
$168,800
10
$107,892
0
$0
0
$0
APPLICATIONS DENIED
0
$0
26
$121,613
7
$23,866
0
$0
APPLICATIONS WITHDRAWN
2
$609,070
12
$92,956
2
$21,755
2
$95,710
FILES CLOSED FOR INCOMPLETENESS
0
$0
3
$143,857
0
$0
0
$0
Aggregated Statistics For Year 2005 (Based on 2 partial tracts)
B) Conventional Home Purchase Loans
C) Refinancings
D) Home Improvement Loans
F) Non-occupant Loans on < 5 Family Dwellings (A B C & D)
G) Loans On Manufactured Home Dwelling (A B C & D)
Number
Average Value
Number
Average Value
Number
Average Value
Number
Average Value
Number
Average Value
LOANS ORIGINATED
3
$163,000
23
$130,818
9
$23,589
3
$63,807
0
$0
APPLICATIONS APPROVED, NOT ACCEPTED
0
$0
2
$92,230
0
$0
0
$0
0
$0
APPLICATIONS DENIED
5
$51,510
16
$101,041
3
$31,323
3
$20,303
2
$8,700
APPLICATIONS WITHDRAWN
7
$102,920
7
$109,136
0
$0
0
$0
0
$0
FILES CLOSED FOR INCOMPLETENESS
0
$0
3
$168,800
0
$0
0
$0
0
$0
Aggregated Statistics For Year 2004 (Based on 2 partial tracts)
A) FHA, FSA/RHS & VA Home Purchase Loans
B) Conventional Home Purchase Loans
C) Refinancings
D) Home Improvement Loans
F) Non-occupant Loans on < 5 Family Dwellings (A B C & D)
G) Loans On Manufactured Home Dwelling (A B C & D)
Number
Average Value
Number
Average Value
Number
Average Value
Number
Average Value
Number
Average Value
Number
Average Value
LOANS ORIGINATED
2
$92,230
16
$87,554
37
$108,316
5
$48,726
9
$82,563
0
$0
APPLICATIONS APPROVED, NOT ACCEPTED
0
$0
2
$56,555
7
$157,861
0
$0
0
$0
0
$0
APPLICATIONS DENIED
2
$104,410
3
$66,127
17
$76,057
5
$41,764
2
$25,235
2
$4,350
APPLICATIONS WITHDRAWN
0
$0
0
$0
3
$165,320
2
$30,455
0
$0
0
$0
FILES CLOSED FOR INCOMPLETENESS
0
$0
0
$0
3
$117,753
0
$0
0
$0
0
$0
Aggregated Statistics For Year 2003 (Based on 2 partial tracts)
B) Conventional Home Purchase Loans
C) Refinancings
D) Home Improvement Loans
F) Non-occupant Loans on < 5 Family Dwellings (A B C & D)
Number
Average Value
Number
Average Value
Number
Average Value
Number
Average Value
LOANS ORIGINATED
7
$106,899
38
$100,794
3
$50,467
3
$50,467
APPLICATIONS APPROVED, NOT ACCEPTED
0
$0
7
$118,086
0
$0
0
$0
APPLICATIONS DENIED
0
$0
17
$99,396
3
$26,103
2
$93,970
APPLICATIONS WITHDRAWN
0
$0
3
$138,637
0
$0
0
$0
FILES CLOSED FOR INCOMPLETENESS
0
$0
5
$157,314
0
$0
0
$0
Aggregated Statistics For Year 2002 (Based on 2 partial tracts)
A) FHA, FSA/RHS & VA Home Purchase Loans
B) Conventional Home Purchase Loans
C) Refinancings
D) Home Improvement Loans
F) Non-occupant Loans on < 5 Family Dwellings (A B C & D)
Number
Average Value
Number
Average Value
Number
Average Value
Number
Average Value
Number
Average Value
LOANS ORIGINATED
2
$89,620
3
$80,050
30
$108,124
5
$11,486
5
$56,034
APPLICATIONS APPROVED, NOT ACCEPTED
0
$0
0
$0
10
$101,628
2
$13,050
0
$0
APPLICATIONS DENIED
0
$0
2
$43,505
19
$106,610
0
$0
2
$104,410
APPLICATIONS WITHDRAWN
0
$0
2
$94,840
12
$101,367
0
$0
2
$94,840
FILES CLOSED FOR INCOMPLETENESS
2
$133,995
0
$0
2
$75,700
0
$0
0
$0
Aggregated Statistics For Year 2001 (Based on 2 partial tracts)
A) FHA, FSA/RHS & VA Home Purchase Loans
B) Conventional Home Purchase Loans
C) Refinancings
D) Home Improvement Loans
F) Non-occupant Loans on < 5 Family Dwellings (A B C & D)
Number
Average Value
Number
Average Value
Number
Average Value
Number
Average Value
Number
Average Value
LOANS ORIGINATED
2
$67,870
14
$146,426
31
$77,804
3
$9,860
2
$80,920
APPLICATIONS APPROVED, NOT ACCEPTED
2
$78,310
0
$0
7
$55,936
0
$0
0
$0
APPLICATIONS DENIED
0
$0
2
$32,195
9
$95,131
7
$5,717
2
$60,905
APPLICATIONS WITHDRAWN
0
$0
0
$0
2
$82,660
3
$23,203
0
$0
FILES CLOSED FOR INCOMPLETENESS
0
$0
3
$70,187
2
$90,490
0
$0
0
$0
Aggregated Statistics For Year 2000 (Based on 2 partial tracts)
B) Conventional Home Purchase Loans
C) Refinancings
D) Home Improvement Loans
F) Non-occupant Loans on < 5 Family Dwellings (A B C & D)
Number
Average Value
Number
Average Value
Number
Average Value
Number
Average Value
LOANS ORIGINATED
2
$43,505
14
$94,219
5
$26,104
2
$43,505
APPLICATIONS APPROVED, NOT ACCEPTED
5
$146,524
7
$116,096
3
$9,280
2
$65,260
APPLICATIONS DENIED
3
$47,567
7
$67,619
0
$0
0
$0
APPLICATIONS WITHDRAWN
2
$105,280
3
$20,303
0
$0
0
$0
FILES CLOSED FOR INCOMPLETENESS
0
$0
2
$104,410
0
$0
0
$0
Aggregated Statistics For Year 1999 (Based on 1 partial tract)
B) Conventional Home Purchase Loans
C) Refinancings
D) Home Improvement Loans
F) Non-occupant Loans on < 5 Family Dwellings (A B C & D)
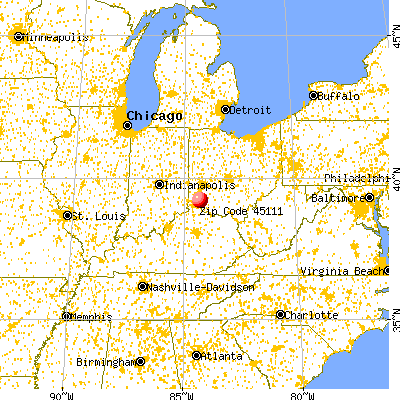


 Nearest zip codes: 45147, 45174, 45243, 45150, 45140, 45242.