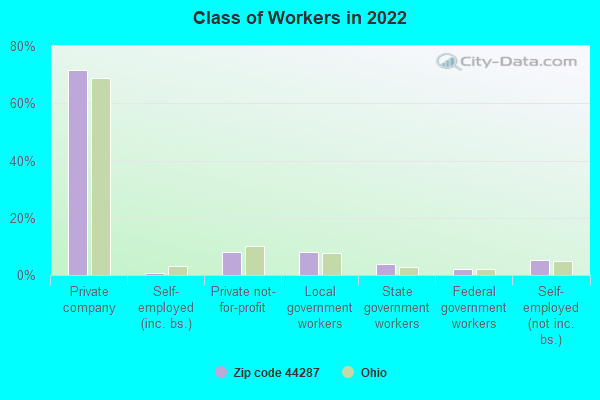
Estimated zip code population in 2022: 7,753 Zip code population in 2010: 7,559 Zip code population in 2000: 7,250
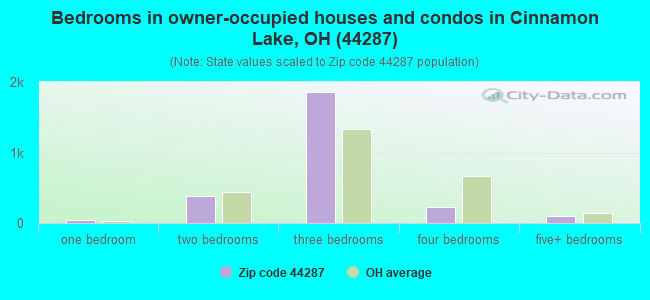
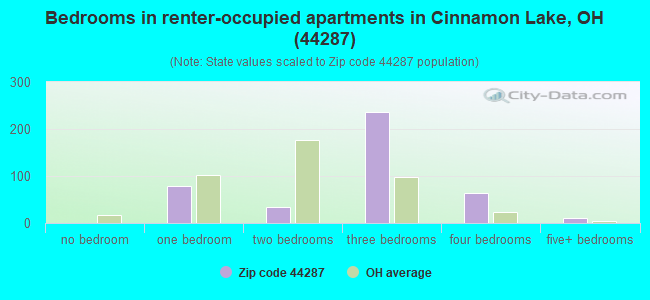
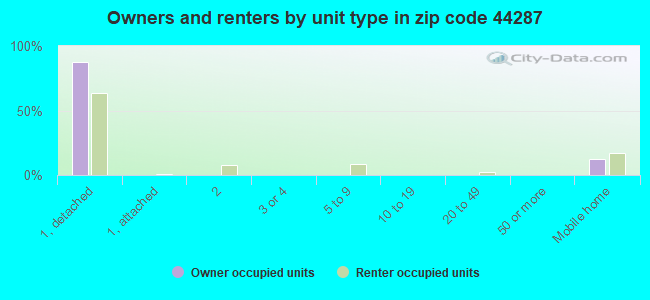
Houses and condos: 3,234 Renter-occupied apartments: 428
% of renters here:
14%
State:
33%
March 2022 cost of living index in zip code 44287: 82.5 (low, U.S. average is 100)
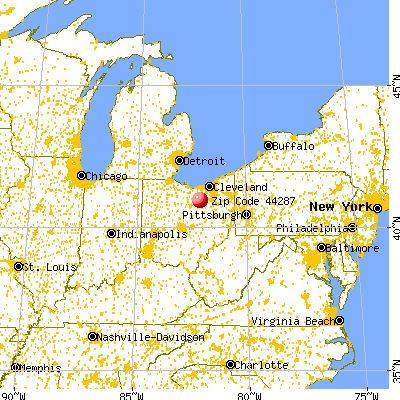
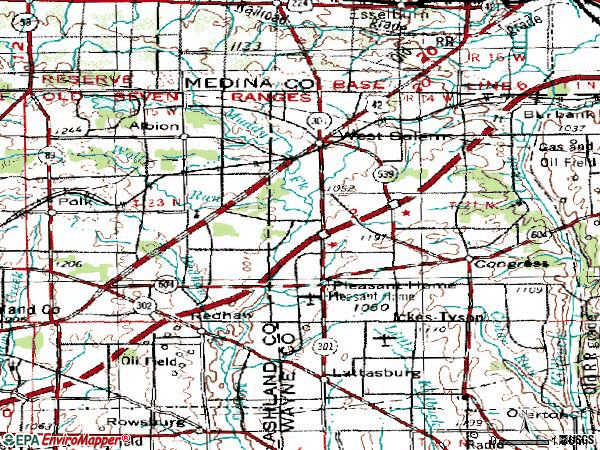
Land area: 66.8 sq. mi. Water area: 0.4 sq. mi.
Population density: 116 people per square mile
(very low).
OSM Map
General Map
Google Map
MSN Map
OSM Map
General Map
Google Map
MSN Map
OSM Map
General Map
Google Map
MSN Map
OSM Map
General Map
Google Map
MSN Map
Please wait while loading the map...
Real estate property taxes paid for housing units in 2022:
This zip code:
1.0% ($1,861)
Ohio:
1.3% ($2,639)
Median real estate property taxes paid for housing units with mortgages in 2022: $1,905 (1.0%) Median real estate property taxes paid for housing units with no mortgage in 2022: $1,787 (1.1%)
Business Search- 14 Million verified businesses
Males: 3,822
(49.3%)
Females: 3,931
(50.7%)
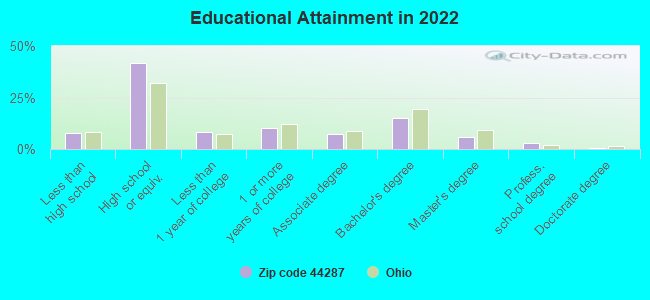
For population 25 years and over in 44287:
High school or higher: 91.3%
Bachelor's degree or higher: 24.2%
Graduate or professional degree: 9.3%
Unemployed: 3.0%
Mean travel time to work (commute): 28.7 minutes
For population 15 years and over in 44287:
Never married: 21.6%
Now married: 61.3%
Separated: 0.7%
Widowed: 7.1%
Divorced: 9.2%
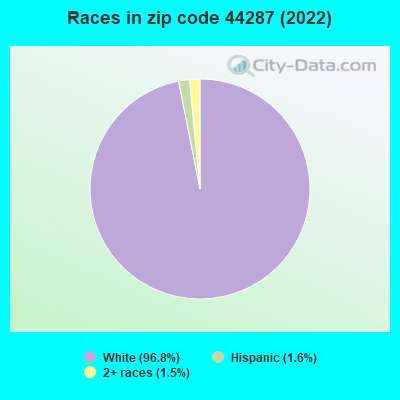
Zip code 44287 compared to state average:
Black race population percentage significantly below state average.
Hispanic race population percentage below state average.
Median age above state average.
Foreign-born population percentage significantly below state average.
Renting percentage significantly below state average.
Length of stay since moving in above state average.
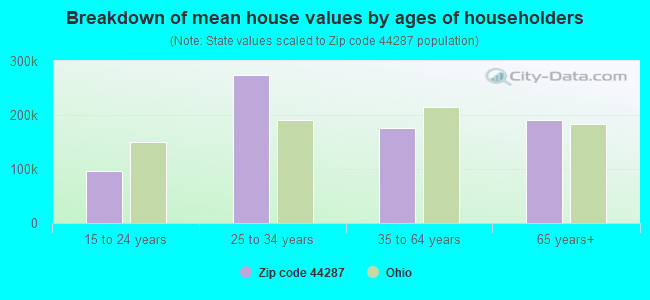
Estimated median house/condo value in 2022: $177,377
44287:
$177,377
Ohio:
$204,100
According to our research of Ohio and other state lists, there were 12 registered sex offenders living in 44287 zip code as of May 23, 2024. The ratio of all residents to sex offenders in zip code 44287 is 631 to 1. The ratio of registered sex offenders to all residents in this zip code is near the state average.
Median resident age:
This zip code:
43.9 years
Ohio median age:
39.9 years
Average household size:
This zip code:
2.5 people
Ohio:
2.4 people
Averages for the 2020 tax year for zip code 44287, filed in 2021:
Average Adjusted Gross Income (AGI) in 2020: $55,017 (Individual Income Tax Returns)
Here:
$55,017
State:
$67,288
Salary/wage: $47,333 (reported on 82.4% of returns)
Here:
$47,333
State:
$55,628
(% of AGI for various income ranges: 1170.4% for AGIs below $25k, 3558.5% for AGIs $25k-50k, 6612.3% for AGIs $50k-75k, 9466.2% for AGIs $75k-100k, 15300.0% for AGIs $100k-200k)
Taxable interest for individuals: $1,049 (reported on 24.0% of returns)
This zip code:
$1,049
Ohio:
$1,518
(% of AGI for various income ranges: 13.5% for AGIs below $25k, 10.7% for AGIs $25k-50k, 12.0% for AGIs $50k-75k, 43.5% for AGIs $75k-100k, 161.5% for AGIs $100k-200k)
Ordinary dividends: $2,724 (reported on 14.5% of returns)
Here:
$2,724
State:
$7,167
(% of AGI for various income ranges: 14.8% for AGIs below $25k, 20.7% for AGIs $25k-50k, 39.8% for AGIs $50k-75k, 85.0% for AGIs $75k-100k, 128.5% for AGIs $100k-200k)
Net capital gain/loss in AGI: +$7,105 (reported on 12.4% of returns)
Here:
+$7,105
State:
+$18,919
(% of AGI for various income ranges: 9.7% for AGIs below $25k, 29.3% for AGIs $25k-50k, 82.5% for AGIs $50k-75k, 69.6% for AGIs $75k-100k, 854.6% for AGIs $100k-200k)
Profit/loss from business: +$12,778 (reported on 14.5% of returns)
Here:
+$12,778
State:
+$13,744
(% of AGI for various income ranges: 110.4% for AGIs below $25k, 144.9% for AGIs $25k-50k, 171.6% for AGIs $50k-75k, 412.7% for AGIs $75k-100k, 1020.4% for AGIs $100k-200k)
Taxable individual retirement arrangement distribution: $15,221 (reported on 8.4% of returns)
44287:
$15,221
Ohio:
$18,876
(% of AGI for various income ranges: 68.1% for AGIs below $25k, 84.7% for AGIs $25k-50k, 186.4% for AGIs $50k-75k, 226.9% for AGIs $75k-100k, 716.2% for AGIs $100k-200k)
Total itemized deductions: $28,833 (reported on 2.6% of returns)
Here:
$28,833
State:
$33,869
(% of AGI for various income ranges: 273.4% for AGIs $50k-75k, 535.4% for AGIs $100k-200k)
Charity contributions: $11,883 (reported on 1.7% of returns)
Here:
$11,883
State:
$14,577
(% of AGI for various income ranges: 67.7% for AGIs $50k-75k, 159.6% for AGIs $100k-200k)
Taxes paid: $6,411 (reported on 2.6% of returns)
44287:
$6,411
State:
$7,681
(% of AGI for various income ranges: 53.2% for AGIs $50k-75k, 131.9% for AGIs $100k-200k)
Earned income credit: $2,200 (reported on 13.9% of returns)
Here:
$2,200
State:
$2,304
(% of AGI for various income ranges: 84.7% for AGIs below $25k, 55.3% for AGIs $25k-50k)
Percentage of individuals using paid preparers for their 2020 taxes: 92.5%
Here:
92%
State:
94%
(% for various income ranges: 90.9% for AGIs below $25k, 94.6% for AGIs $25k-50k, 93.4% for AGIs $50k-75k, 91.9% for AGIs $75k-100k, 92.7% for AGIs $100k-200k, 80.0% for AGIs over 200k)
Averages for the 2012 tax year for zip code 44287, filed in 2013:
Average Adjusted Gross Income (AGI) in 2012: $41,736 (Individual Income Tax Returns)
Here:
$41,736
State:
$54,926
Salary/wage: $37,003 (reported on 84.4% of returns)
Here:
$37,003
State:
$45,869
(% of AGI for various income ranges: 70.1% for AGIs below $25k, 79.2% for AGIs $25k-50k, 79.5% for AGIs $50k-75k, 78.7% for AGIs $75k-100k, 63.1% for AGIs $100k-200k)
Taxable interest for individuals: $581 (reported on 26.7% of returns)
This zip code:
$581
Ohio:
$1,297
(% of AGI for various income ranges: 0.8% for AGIs below $25k, 0.4% for AGIs $25k-50k, 0.3% for AGIs $50k-75k, 0.2% for AGIs $75k-100k, 0.4% for AGIs $100k-200k)
Ordinary dividends: $1,312 (reported on 15.3% of returns)
Here:
$1,312
State:
$5,821
(% of AGI for various income ranges: 1.0% for AGIs below $25k, 0.3% for AGIs $25k-50k, 0.5% for AGIs $50k-75k, 0.4% for AGIs $75k-100k, 0.4% for AGIs $100k-200k)
Net capital gain/loss in AGI: +$2,026 (reported on 10.2% of returns)
Here:
+$2,026
State:
+$11,232
(% of AGI for various income ranges: 0.2% for AGIs below $25k, 0.7% for AGIs $25k-50k, 0.4% for AGIs $50k-75k, 0.5% for AGIs $75k-100k, 0.5% for AGIs $100k-200k)
Profit/loss from business: +$9,102 (reported on 15.3% of returns)
Here:
+$9,102
State:
+$12,773
(% of AGI for various income ranges: 6.7% for AGIs below $25k, 3.2% for AGIs $25k-50k, 3.0% for AGIs $50k-75k, 2.6% for AGIs $75k-100k, 2.6% for AGIs $100k-200k)
Taxable individual retirement arrangement distribution: $10,654 (reported on 7.8% of returns)
44287:
$10,654
Ohio:
$14,511
(% of AGI for various income ranges: 2.9% for AGIs below $25k, 2.2% for AGIs $25k-50k, 1.5% for AGIs $50k-75k, 2.3% for AGIs $75k-100k, 1.5% for AGIs $100k-200k)
Total itemized deductions: $16,826 (23% of AGI, reported on 25.2% of returns)
Here:
$16,826
State:
$21,278
Here:
23.4% of AGI
State:
18.8% of AGI
(% of AGI for various income ranges: 7.3% for AGIs below $25k, 9.3% for AGIs $25k-50k, 10.4% for AGIs $50k-75k, 10.6% for AGIs $75k-100k, 12.2% for AGIs $100k-200k)
Charity contributions: $2,730 (reported on 17.1% of returns)
Here:
$2,730
State:
$3,943
(% of AGI for various income ranges: 0.6% for AGIs below $25k, 0.8% for AGIs $25k-50k, 1.2% for AGIs $50k-75k, 1.1% for AGIs $75k-100k, 1.8% for AGIs $100k-200k)
Taxes paid: $5,604 (reported on 25.2% of returns)
44287:
$5,604
State:
$9,568
(% of AGI for various income ranges: 1.1% for AGIs below $25k, 2.5% for AGIs $25k-50k, 3.0% for AGIs $50k-75k, 3.7% for AGIs $75k-100k, 6.0% for AGIs $100k-200k)
Earned income credit: $2,207 (reported on 18.3% of returns)
Here:
$2,207
State:
$2,285
(% of AGI for various income ranges: 6.2% for AGIs below $25k, 1.0% for AGIs $25k-50k)
Percentage of individuals using paid preparers for their 2012 taxes: 54.1%
Here:
54%
State:
51%
(% for various income ranges: 46.7% for AGIs below $25k, 58.5% for AGIs $25k-50k, 60.0% for AGIs $50k-75k, 56.7% for AGIs $75k-100k, 63.2% for AGIs $100k-200k)
Averages for the 2004 tax year for zip code 44287, filed in 2005:
Average Adjusted Gross Income (AGI) in 2004: $36,185 (Individual Income Tax Returns)
Here:
$36,185
State:
$44,480
Salary/wage: $33,679 (reported on 87.4% of returns)
Here:
$33,679
State:
$39,198
(% of AGI for various income ranges: 149.2% for AGIs below $10k, 74.9% for AGIs $10k-25k, 84.5% for AGIs $25k-50k, 84.1% for AGIs $50k-75k, 80.9% for AGIs $75k-100k, 66.1% for AGIs over 100k)
Taxable interest for individuals: $950 (reported on 38.5% of returns)
This zip code:
$950
Ohio:
$1,532
(% of AGI for various income ranges: 2.9% for AGIs below $10k, 2.0% for AGIs $10k-25k, 0.8% for AGIs $25k-50k, 0.5% for AGIs $50k-75k, 0.6% for AGIs $75k-100k, 2.1% for AGIs over 100k)
Taxable dividends: $1,875 (reported on 18.2% of returns)
Here:
$1,875
State:
$3,496
(% of AGI for various income ranges: 3.0% for AGIs below $10k, 0.8% for AGIs $10k-25k, 0.5% for AGIs $25k-50k, 0.3% for AGIs $50k-75k, 0.5% for AGIs $75k-100k, 3.9% for AGIs over 100k)
Net capital gain/loss: +$3,435 (reported on 12.6% of returns)
Here:
+$3,435
State:
+$8,582
(% of AGI for various income ranges: -0.9% for AGIs below $10k, 1.1% for AGIs $10k-25k, 0.6% for AGIs $25k-50k, 1.0% for AGIs $50k-75k, 1.4% for AGIs $75k-100k, 3.4% for AGIs over 100k)
Profit/loss from business: +$7,780 (reported on 15.4% of returns)
Here:
+$7,780
State:
+$10,813
(% of AGI for various income ranges: 5.3% for AGIs below $10k, 6.3% for AGIs $10k-25k, 3.2% for AGIs $25k-50k, 3.4% for AGIs $50k-75k, 2.3% for AGIs $75k-100k, 1.7% for AGIs over 100k)
IRA payment deduction: $2,247 (reported on 2.4% of returns)
44287:
$2,247
Ohio:
$2,794
Total itemized deductions: $13,759 (24% of AGI, reported on 32.2% of returns)
Here:
$13,759
State:
$17,503
Here:
23.5% of AGI
State:
20.8% of AGI
(% of AGI for various income ranges: 8.1% for AGIs below $10k, 8.1% for AGIs $10k-25k, 10.5% for AGIs $25k-50k, 13.8% for AGIs $50k-75k, 15.1% for AGIs $75k-100k, 14.6% for AGIs over 100k)
Charity contributions deductions: $2,041 (3% of AGI, reported on 23.1% of returns)
Here:
$2,041
State:
$3,087
Here:
3.3% of AGI
State:
3.4% of AGI
(% of AGI for various income ranges: 0.8% for AGIs $10k-25k, 1.0% for AGIs $25k-50k, 1.3% for AGIs $50k-75k, 2.0% for AGIs $75k-100k, 2.0% for AGIs over 100k)
Total tax: $3,936 (reported on 77.8% of returns)
44287:
$3,936
State:
$6,781
(% of AGI for various income ranges: 4.6% for AGIs below $10k, 4.4% for AGIs $10k-25k, 6.9% for AGIs $25k-50k, 8.5% for AGIs $50k-75k, 10.1% for AGIs $75k-100k, 14.9% for AGIs over 100k)
Earned income credit: $1,634 (reported on 13.5% of returns)
Here:
$1,634
State:
$1,696
Percentage of individuals using paid preparers for their 2004 taxes: 57.0%
Here:
57%
State:
55%
(% for various income ranges: 46.7% for AGIs below $10k, 56.8% for AGIs $10k-25k, 59.9% for AGIs $25k-50k, 60.0% for AGIs $50k-75k, 58.2% for AGIs $75k-100k, 67.2% for AGIs over 100k)
Likely homosexual households (counted as self-reported same-sex unmarried-partner households)
Lesbian couples: 0.0% of all households
Gay men: 0.0% of all households
Household received Food Stamps/SNAP in the past 12 months: 312 Household did not receive Food Stamps/SNAP in the past 12 months: 2,731
Women who had a birth in the past 12 months: 110 (59 now married, 50 unmarried) Women who did not have a birth in the past 12 months: 1,284 (660 now married, 623 unmarried)
Housing units in zip code 44287 with a mortgage: 1,497 (267 second mortgage, 206 both second mortgage and home equity loan) Houses without a mortgage: 239
Median monthly owner costs for units with a mortgage: $1,188 Median monthly owner costs for units without a mortgage: $480
Residents with income below the poverty level in 2022:
This zip code:
7.4%
Whole state:
13.4%
Residents with income below 50% of the poverty level in 2022:
This zip code:
4.7%
Whole state:
7.0%
Median number of rooms in houses and condos:
Here:
6.1
State:
6.7
Median number of rooms in apartments:
Here:
6.1
State:
4.4
Notable locations in this zip code not listed on our city pages
Notable locations in zip code 44287: Morlock Farms (A), Schirm Jersey Farm (B), Camp Pee Wee (C), Heritage Poultry Farm (D), Badger Farms (E), Tegtmeier Farm (F), Foltz Farms (G), Haley Farms (H), Lin - Dar Farms (I), Macdonald Farm (J), Miley Holsteins Farms (K), Dawson Farm (L), France Farms (M), Spidel Farm (N), Peacock Farms (O), Shade Creek Farms (P), Twin Parks Farm (Q), Wellert Farm (R), Town and Country Fire District (S), Tri County Animal Clinic (T). Display/hide their locations on the map
Churches in zip code 44287 include: Aukerman Church (A), Fairhaven Church (B), Congress Community Church (C), Mohican Church of the Brethren (D), Saint Johns Church (E). Display/hide their locations on the map
Cemeteries: Albion Cemetery (1), Aukerman Cemetery (2), Van Cleve Cemetery (3), Stanley Cemetery (4), Swope Cemetery (5), Warners-Congress Cemetery (6), Hazzard Cemetery (7). Display/hide their locations on the map
In group quarters: 2 (-1 institutionalized population)
Size of family households: 1,174 2-persons, 450 3-persons, 262 4-persons, 147 5-persons, 102 6-persons, 82 7-or-more-persons
Size of nonfamily households: 739 1-person, 72 2-persons, 4 3-persons
1,253 married couples with children.
331 single-parent households (179 men, 152 women).
93.7% of residents of 44287 zip code speak English at home.
0.1% of residents speak Spanish at home (100% very well).
5.8% of residents speak other Indo-European language at home (44% very well, 22% well, 25% not well, 9% not at all).
Foreign born population: 120 (1.6%) (6.8% of them are naturalized citizens)
This zip code:
1.6%
Whole state:
5.0%
8%United Kingdom, excluding England and Scotland
7%Sweden
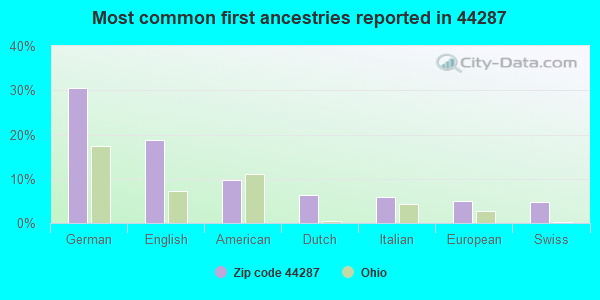
30%German
19%English
10%American
6%Dutch
6%Italian
5%European
5%Swiss
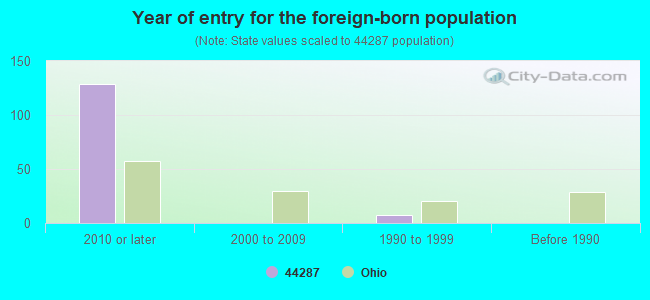
Year of entry for the foreign-born population
1292010 or later
02000 to 2009
71990 to 1999
0Before 1990
Facilities with environmental interests located in this zip code:
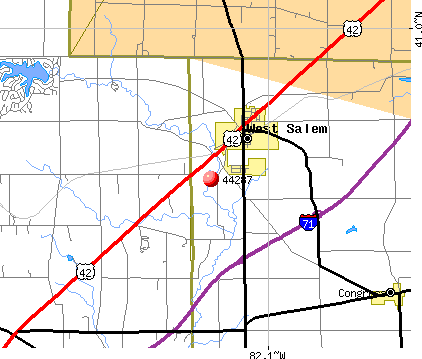
AMERICAN AUGERS INC (135 US RTE 42 in WEST SALEM, OH)
AIR MINOR (AIRS/AFS) STATE MASTER (Ohio general info) - AIR MAJOR, PCS-OH0130524, National Pollutant Discharge Elimination System Permit National Pollutant Discharge Elimination System NON-MAJOR (Tracking pollutant discharge elimination systems) - permit Small Quantity Generators, between 100 kg and 1000 kg of hazardous waste/month (Resource Conservation and Recovery Act (tracking hazardous waste)) - notification Business SIC classification: MINING MACHINERY AND EQUIPMENT, EXCEPT OIL AND GAS FIELD MACHINERY AND EQUIPMENT; SANITARY SERVICES Organizations: AMERICAN AUGERS INC. (CONTACT/OWNER)
Alternative names: AMERICAN AUGERS, INCORPORAT
BP OIL CO * (PUBLIC SQUARE in WEST SALEM, OH)
STATE MASTER (Ohio general info) - RCRA-OHD987017399, HAZARDOUS WASTE PROGRAM Conditionally Exempt Small Quantity Generators, less than 100 kg/month of hazardous waste (Resource Conservation and Recovery Act (tracking hazardous waste)) - notification Organizations: BP OIL COMPANY (CONTACT/OWNER)
ALLTEL - WEST SALEM (NE CORNER OF ST RT 71 & 171 in WEST SALEM, OH)
(Integrated Compliance Information System) - ICIS-HQ-2000-6004, FORMAL ENFORCEMENT ACTION
Housing units lacking complete plumbing facilities: 5.1% Housing units lacking complete kitchen facilities: 4.5%
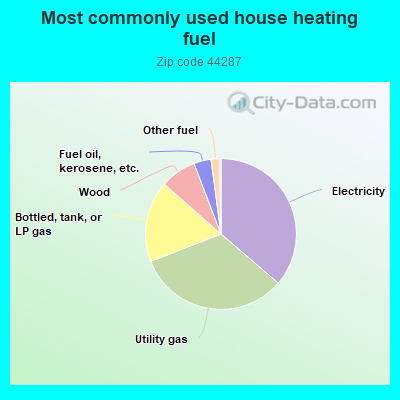
36.3%Electricity
32.8%Utility gas
17.4%Bottled, tank, or LP gas
7.7%Wood
3.7%Fuel oil, kerosene, etc.
1.8%Other fuel
Population in 1990: 5,351. Population change in the 1990s: +1,899 (+35.5%).
Place of birth for U.S.-born residents:
This state: 6,772
Northeast: 291
Midwest: 92
South: 427
West: 41
66% of the 44287 zip code residents lived in the same house 5 years ago. Out of people who lived in different houses, 34% lived in this county. Out of people who lived in different counties, 50% lived in Ohio.
96% of the 44287 zip code residents lived in the same house 1 year ago. Out of people who lived in different houses, 40% moved from this county. Out of people who lived in different houses, 76% moved from different county within same state.
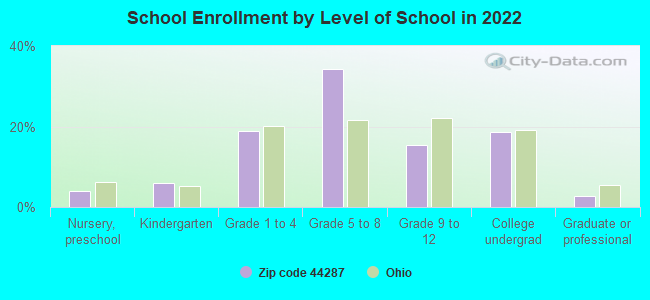
Private vs. public school enrollment:
Students in private schools in grades 1 to 8 (elementary and middle school): 168
Here:
19.6%
Ohio:
16.0%
Students in private schools in grades 9 to 12 (high school): 14
Here:
5.7%
Ohio:
13.1%
Students in private undergraduate colleges: 91
Here:
30.3%
Ohio:
22.3%
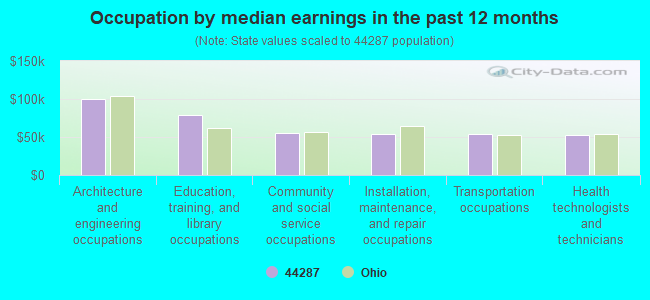
Occupation by median earnings in the past 12 months ($)
100,284Architecture and engineering occupations
78,916Education, training, and library occupations
55,280Community and social service occupations
54,478Installation, maintenance, and repair occupations
53,388Transportation occupations
52,372Health technologists and technicians
Top industries in this zip code by the number of employees in 2005:
Finance and Insurance: Commercial Banking (20-49 employees: 1 establishment)
Accommodation and Food Services: Limited-Service Restaurants (5-9: 3, 1-4: 1)
Other Services (except Public Administration): Religious Organizations (5-9: 2, 1-4: 3)
Construction: Plumbing, Heating, and Air-Conditioning Contractors (10-19: 1)
People in group quarters in 2010:
4 people in other noninstitutional facilities
Fatal accident statistics in 2014:
Fatal accident count: 2
Vehicles involved in fatal accidents: 2
Fatal accidents caused by drunken drivers: 1
Fatalities: 2
Persons involved in fatal accidents: 4
Pedestrians involved in fatal accidents: 0
Fatal accident statistics in 2013:
Fatal accident count: 2
Vehicles involved in fatal accidents: 3
Fatal accidents caused by drunken drivers: 0
Fatalities: 2
Persons involved in fatal accidents: 3
Pedestrians involved in fatal accidents: 1
Home Mortgage Disclosure Act Aggregated Statistics For Year 2009 (Based on 2 partial tracts)
A) FHA, FSA/RHS & VA Home Purchase Loans
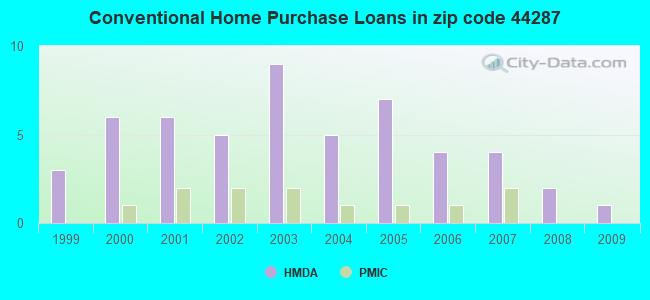
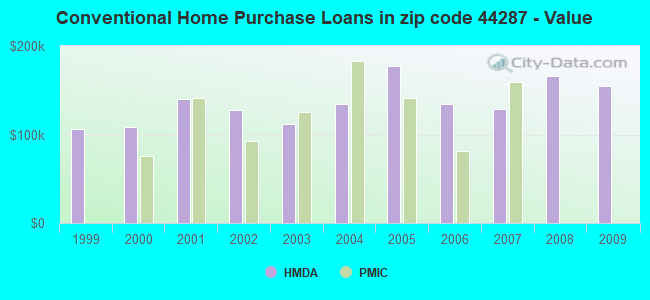
B) Conventional Home Purchase Loans
C) Refinancings
D) Home Improvement Loans
G) Loans On Manufactured Home Dwelling (A B C & D)
Number
Average Value
Number
Average Value
Number
Average Value
Number
Average Value
Number
Average Value
LOANS ORIGINATED
1
$141,520
1
$154,710
9
$130,743
0
$0
1
$85,460
APPLICATIONS APPROVED, NOT ACCEPTED
0
$0
0
$0
1
$88,210
0
$0
0
$0
APPLICATIONS DENIED
0
$0
0
$0
3
$184,573
1
$11,540
0
$0
APPLICATIONS WITHDRAWN
0
$0
0
$0
2
$139,600
0
$0
0
$0
FILES CLOSED FOR INCOMPLETENESS
0
$0
0
$0
0
$0
0
$0
0
$0
Aggregated Statistics For Year 2008 (Based on 2 partial tracts)
A) FHA, FSA/RHS & VA Home Purchase Loans
B) Conventional Home Purchase Loans
C) Refinancings
D) Home Improvement Loans
F) Non-occupant Loans on < 5 Family Dwellings (A B C & D)
Number
Average Value
Number
Average Value
Number
Average Value
Number
Average Value
Number
Average Value
LOANS ORIGINATED
1
$108,550
2
$166,530
5
$156,196
1
$6,600
1
$65,680
APPLICATIONS APPROVED, NOT ACCEPTED
0
$0
0
$0
1
$134,100
0
$0
0
$0
APPLICATIONS DENIED
0
$0
0
$0
5
$166,694
0
$0
0
$0
APPLICATIONS WITHDRAWN
1
$38,750
0
$0
2
$153,065
0
$0
0
$0
FILES CLOSED FOR INCOMPLETENESS
0
$0
0
$0
0
$0
0
$0
0
$0
Aggregated Statistics For Year 2007 (Based on 2 partial tracts)
A) FHA, FSA/RHS & VA Home Purchase Loans
B) Conventional Home Purchase Loans
C) Refinancings
D) Home Improvement Loans
F) Non-occupant Loans on < 5 Family Dwellings (A B C & D)
Number
Average Value
Number
Average Value
Number
Average Value
Number
Average Value
Number
Average Value
LOANS ORIGINATED
1
$69,250
4
$128,333
10
$159,769
1
$24,730
1
$86,560
APPLICATIONS APPROVED, NOT ACCEPTED
0
$0
1
$49,460
1
$103,050
1
$56,880
0
$0
APPLICATIONS DENIED
0
$0
1
$224,790
7
$133,867
1
$79,970
0
$0
APPLICATIONS WITHDRAWN
0
$0
1
$40,120
3
$144,727
0
$0
0
$0
FILES CLOSED FOR INCOMPLETENESS
0
$0
0
$0
1
$175,050
0
$0
0
$0
Aggregated Statistics For Year 2006 (Based on 2 partial tracts)
A) FHA, FSA/RHS & VA Home Purchase Loans
B) Conventional Home Purchase Loans
C) Refinancings
D) Home Improvement Loans
F) Non-occupant Loans on < 5 Family Dwellings (A B C & D)
G) Loans On Manufactured Home Dwelling (A B C & D)
Number
Average Value
Number
Average Value
Number
Average Value
Number
Average Value
Number
Average Value
Number
Average Value
LOANS ORIGINATED
1
$82,170
4
$134,582
9
$111,997
2
$36,685
1
$51,660
0
$0
APPLICATIONS APPROVED, NOT ACCEPTED
0
$0
2
$64,440
4
$79,072
1
$15,940
0
$0
0
$0
APPLICATIONS DENIED
0
$0
2
$79,690
10
$141,522
1
$81,070
1
$98,380
1
$54,960
APPLICATIONS WITHDRAWN
0
$0
1
$92,330
3
$156,543
1
$77,770
0
$0
0
$0
FILES CLOSED FOR INCOMPLETENESS
0
$0
0
$0
2
$73,370
0
$0
0
$0
0
$0
Aggregated Statistics For Year 2005 (Based on 2 partial tracts)
A) FHA, FSA/RHS & VA Home Purchase Loans
B) Conventional Home Purchase Loans
C) Refinancings
D) Home Improvement Loans
F) Non-occupant Loans on < 5 Family Dwellings (A B C & D)
G) Loans On Manufactured Home Dwelling (A B C & D)
Number
Average Value
Number
Average Value
Number
Average Value
Number
Average Value
Number
Average Value
Number
Average Value
LOANS ORIGINATED
1
$130,530
7
$177,953
11
$136,275
3
$35,450
1
$194,010
2
$98,105
APPLICATIONS APPROVED, NOT ACCEPTED
0
$0
1
$145,640
2
$117,750
1
$6,870
0
$0
0
$0
APPLICATIONS DENIED
0
$0
2
$63,755
10
$169,469
2
$53,035
0
$0
0
$0
APPLICATIONS WITHDRAWN
0
$0
1
$198,960
7
$170,494
1
$84,640
0
$0
0
$0
FILES CLOSED FOR INCOMPLETENESS
0
$0
0
$0
2
$132,040
1
$25,280
0
$0
0
$0
Aggregated Statistics For Year 2004 (Based on 2 partial tracts)
B) Conventional Home Purchase Loans
C) Refinancings
D) Home Improvement Loans
G) Loans On Manufactured Home Dwelling (A B C & D)
Number
Average Value
Number
Average Value
Number
Average Value
Number
Average Value
LOANS ORIGINATED
5
$134,652
15
$119,227
1
$76,120
0
$0
APPLICATIONS APPROVED, NOT ACCEPTED
0
$0
4
$151,758
0
$0
0
$0
APPLICATIONS DENIED
3
$116,057
9
$162,957
2
$39,570
1
$9,620
APPLICATIONS WITHDRAWN
0
$0
7
$138,303
1
$13,740
0
$0
FILES CLOSED FOR INCOMPLETENESS
0
$0
2
$142,485
0
$0
0
$0
Aggregated Statistics For Year 2003 (Based on 2 partial tracts)
A) FHA, FSA/RHS & VA Home Purchase Loans
B) Conventional Home Purchase Loans
C) Refinancings
D) Home Improvement Loans
F) Non-occupant Loans on < 5 Family Dwellings (A B C & D)
Number
Average Value
Number
Average Value
Number
Average Value
Number
Average Value
Number
Average Value
LOANS ORIGINATED
1
$100,030
9
$112,240
32
$107,833
1
$21,710
1
$148,390
APPLICATIONS APPROVED, NOT ACCEPTED
0
$0
1
$79,970
3
$129,430
0
$0
0
$0
APPLICATIONS DENIED
0
$0
1
$164,060
7
$159,894
1
$35,450
0
$0
APPLICATIONS WITHDRAWN
0
$0
1
$84,360
8
$132,008
0
$0
0
$0
FILES CLOSED FOR INCOMPLETENESS
0
$0
1
$73,650
1
$143,720
0
$0
0
$0
Aggregated Statistics For Year 2002 (Based on 2 partial tracts)
B) Conventional Home Purchase Loans
C) Refinancings
D) Home Improvement Loans
F) Non-occupant Loans on < 5 Family Dwellings (A B C & D)
Number
Average Value
Number
Average Value
Number
Average Value
Number
Average Value
LOANS ORIGINATED
5
$127,232
22
$119,400
1
$29,130
1
$43,690
APPLICATIONS APPROVED, NOT ACCEPTED
1
$92,880
4
$125,720
0
$0
0
$0
APPLICATIONS DENIED
0
$0
8
$156,774
1
$15,110
0
$0
APPLICATIONS WITHDRAWN
0
$0
3
$100,670
0
$0
0
$0
FILES CLOSED FOR INCOMPLETENESS
0
$0
1
$187,140
0
$0
0
$0
Aggregated Statistics For Year 2001 (Based on 2 partial tracts)
A) FHA, FSA/RHS & VA Home Purchase Loans
B) Conventional Home Purchase Loans
C) Refinancings
D) Home Improvement Loans
Number
Average Value
Number
Average Value
Number
Average Value
Number
Average Value
LOANS ORIGINATED
1
$69,520
6
$140,057
25
$110,546
1
$11,270
APPLICATIONS APPROVED, NOT ACCEPTED
0
$0
0
$0
3
$136,393
0
$0
APPLICATIONS DENIED
0
$0
1
$144,540
7
$104,149
1
$15,390
APPLICATIONS WITHDRAWN
0
$0
1
$110,190
6
$108,958
1
$7,420
FILES CLOSED FOR INCOMPLETENESS
0
$0
0
$0
2
$80,790
0
$0
Aggregated Statistics For Year 2000 (Based on 2 partial tracts)
A) FHA, FSA/RHS & VA Home Purchase Loans
B) Conventional Home Purchase Loans
C) Refinancings
D) Home Improvement Loans
Number
Average Value
Number
Average Value
Number
Average Value
Number
Average Value
LOANS ORIGINATED
1
$108,820
6
$108,683
8
$92,058
2
$26,105
APPLICATIONS APPROVED, NOT ACCEPTED
0
$0
0
$0
3
$122,470
1
$2,750
APPLICATIONS DENIED
0
$0
1
$162,410
3
$161,950
1
$4,950
APPLICATIONS WITHDRAWN
0
$0
0
$0
3
$77,770
0
$0
FILES CLOSED FOR INCOMPLETENESS
0
$0
0
$0
1
$66,230
0
$0
Aggregated Statistics For Year 1999 (Based on 1 partial tract)
Detailed PMIC statistics for the following Tracts:4110.01
2002 - 2018 National Fire Incident Reporting System (NFIRS) incidents
According to the data from the years 2002 - 2018 the average number of fire incidents per year is 42. The highest number of reported fire incidents - 90 took place in 2015, and the least - 21 in 2011. The data has a rising trend.
When looking into fire subcategories, the most reports belonged to: Structure Fires (48.8%), and Outside Fires (31.8%).
Fire incident types reported to NFIRS in Zip Code 44287


 Nearest zip codes: 44235, 44214, 44866, 44254, 44880, 44275.


 According to the data from the years 2002 - 2018 the average number of fire incidents per year is 42. The highest number of reported fire incidents - 90 took place in 2015, and the least - 21 in 2011. The data has a rising trend.
 When looking into fire subcategories, the most reports belonged to: Structure Fires (48.8%), and Outside Fires (31.8%).