Estimated zip code population in 2022: 1,868 Zip code population in 2010: 2,220 Zip code population in 2000: 1,834
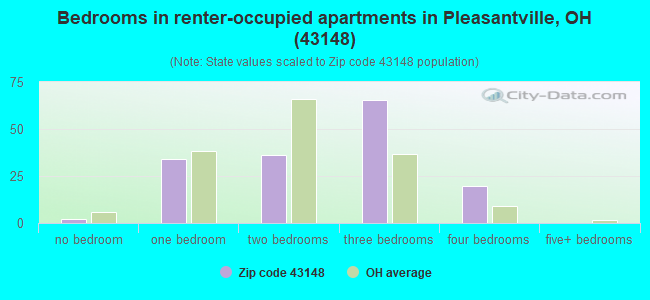
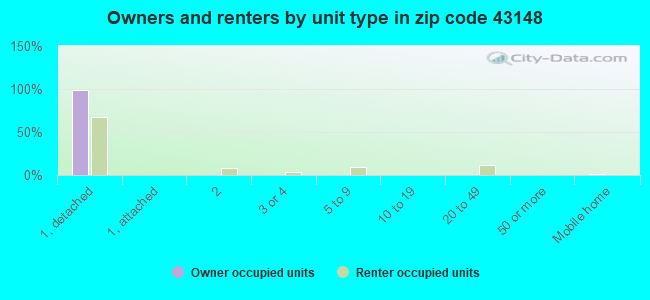
Houses and condos: 748 Renter-occupied apartments: 158
% of renters here:
22%
State:
33%
March 2022 cost of living index in zip code 43148: 83.6 (less than average, U.S. average is 100)
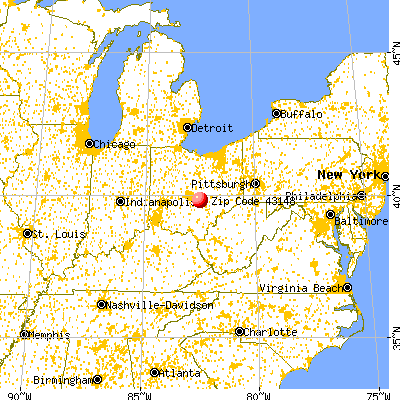
Land area: 24.8 sq. mi. Water area: 0.0 sq. mi.
Population density: 75 people per square mile
(very low).
OSM Map
General Map
Google Map
MSN Map
OSM Map
General Map
Google Map
MSN Map
OSM Map
General Map
Google Map
MSN Map
OSM Map
General Map
Google Map
MSN Map
Please wait while loading the map...
Real estate property taxes paid for housing units in 2022:
This zip code:
1.2% ($2,339)
Ohio:
1.3% ($2,639)
Median real estate property taxes paid for housing units with mortgages in 2022: $2,291 (1.3%) Median real estate property taxes paid for housing units with no mortgage in 2022: $2,440 (1.9%)
Averages for the 2020 tax year for zip code 43148, filed in 2021:
Average Adjusted Gross Income (AGI) in 2020: $59,176 (Individual Income Tax Returns)
Here:
$59,176
State:
$67,288
Salary/wage: $52,421 (reported on 82.7% of returns)
Here:
$52,421
State:
$55,628
(% of AGI for various income ranges: 1048.8% for AGIs below $25k, 3444.8% for AGIs $25k-50k, 6832.3% for AGIs $50k-75k, 9628.9% for AGIs $75k-100k, 24512.5% for AGIs $100k-200k)
Taxable interest for individuals: $508 (reported on 21.8% of returns)
This zip code:
$508
Ohio:
$1,518
(% of AGI for various income ranges: 3.6% for AGIs below $25k, 14.3% for AGIs $25k-50k, 6.9% for AGIs $50k-75k, 4.4% for AGIs $75k-100k, 83.8% for AGIs $100k-200k)
Ordinary dividends: $2,077 (reported on 11.8% of returns)
Here:
$2,077
State:
$7,167
(% of AGI for various income ranges: 22.6% for AGIs $25k-50k, 24.6% for AGIs $50k-75k, 232.5% for AGIs $100k-200k)
Net capital gain/loss in AGI: +$11,708 (reported on 10.9% of returns)
Here:
+$11,708
State:
+$18,919
(% of AGI for various income ranges: 27.8% for AGIs $25k-50k, 75.4% for AGIs $50k-75k, 1553.8% for AGIs $100k-200k)
Profit/loss from business: +$12,706 (reported on 14.5% of returns)
Here:
+$12,706
State:
+$13,744
(% of AGI for various income ranges: 128.8% for AGIs below $25k, 183.0% for AGIs $25k-50k, 469.2% for AGIs $50k-75k, 850.0% for AGIs $100k-200k)
Taxable individual retirement arrangement distribution: $14,588 (reported on 7.3% of returns)
43148:
$14,588
Ohio:
$18,876
(% of AGI for various income ranges: 257.4% for AGIs $25k-50k, 638.9% for AGIs $75k-100k)
Total itemized deductions: $30,750 (reported on 3.6% of returns)
Here:
$30,750
State:
$33,869
(% of AGI for various income ranges: 1537.5% for AGIs $100k-200k)
Charity contributions: $6,400 (reported on 2.7% of returns)
Here:
$6,400
State:
$14,577
(% of AGI for various income ranges: 213.3% for AGIs $75k-100k)
Taxes paid: $8,225 (reported on 3.6% of returns)
43148:
$8,225
State:
$7,681
(% of AGI for various income ranges: 411.2% for AGIs $100k-200k)
Earned income credit: $2,553 (reported on 17.3% of returns)
Here:
$2,553
State:
$2,304
(% of AGI for various income ranges: 109.2% for AGIs below $25k, 92.2% for AGIs $25k-50k)
Percentage of individuals using paid preparers for their 2020 taxes: 94.5%
Here:
95%
State:
94%
(% for various income ranges: 93.9% for AGIs below $25k, 96.4% for AGIs $25k-50k, 94.4% for AGIs $50k-75k, 92.3% for AGIs $75k-100k, 100.0% for AGIs $100k-200k, 66.7% for AGIs over 200k)
Averages for the 2012 tax year for zip code 43148, filed in 2013:
Average Adjusted Gross Income (AGI) in 2012: $44,650 (Individual Income Tax Returns)
Here:
$44,650
State:
$54,926
Salary/wage: $41,174 (reported on 83.3% of returns)
Here:
$41,174
State:
$45,869
(% of AGI for various income ranges: 74.9% for AGIs below $25k, 79.9% for AGIs $25k-50k, 83.0% for AGIs $50k-75k, 81.3% for AGIs $75k-100k, 66.7% for AGIs $100k-200k)
Taxable interest for individuals: $433 (reported on 26.5% of returns)
This zip code:
$433
Ohio:
$1,297
(% of AGI for various income ranges: 0.6% for AGIs below $25k, 0.2% for AGIs $25k-50k, 0.1% for AGIs $50k-75k, 0.4% for AGIs $75k-100k, 0.2% for AGIs $100k-200k)
Ordinary dividends: $1,523 (reported on 12.7% of returns)
Here:
$1,523
State:
$5,821
(% of AGI for various income ranges: 0.3% for AGIs $25k-50k, 0.2% for AGIs $50k-75k, 0.2% for AGIs $75k-100k, 1.0% for AGIs $100k-200k)
Net capital gain/loss in AGI: +$2,212 (reported on 7.8% of returns)
Here:
+$2,212
State:
+$11,232
(% of AGI for various income ranges: 0.1% for AGIs below $25k, 0.3% for AGIs $50k-75k, 1.1% for AGIs $100k-200k)
Profit/loss from business: +$9,636 (reported on 13.7% of returns)
Here:
+$9,636
State:
+$12,773
(% of AGI for various income ranges: 6.9% for AGIs below $25k, 5.2% for AGIs $25k-50k, 2.2% for AGIs $50k-75k, 3.4% for AGIs $75k-100k)
Taxable individual retirement arrangement distribution: $8,538 (reported on 7.8% of returns)
43148:
$8,538
Ohio:
$14,511
(% of AGI for various income ranges: 2.2% for AGIs below $25k, 3.1% for AGIs $25k-50k, 3.2% for AGIs $75k-100k)
Total itemized deductions: $17,052 (22% of AGI, reported on 30.4% of returns)
Here:
$17,052
State:
$21,278
Here:
21.9% of AGI
State:
18.8% of AGI
(% of AGI for various income ranges: 9.7% for AGIs $25k-50k, 13.0% for AGIs $50k-75k, 13.3% for AGIs $75k-100k, 15.3% for AGIs $100k-200k)
Charity contributions: $2,674 (reported on 22.5% of returns)
Here:
$2,674
State:
$3,943
(% of AGI for various income ranges: 0.8% for AGIs $25k-50k, 1.6% for AGIs $50k-75k, 1.4% for AGIs $75k-100k, 2.1% for AGIs $100k-200k)
Taxes paid: $6,997 (reported on 30.4% of returns)
43148:
$6,997
State:
$9,568
(% of AGI for various income ranges: 2.6% for AGIs $25k-50k, 4.9% for AGIs $50k-75k, 5.8% for AGIs $75k-100k, 7.6% for AGIs $100k-200k)
Earned income credit: $2,159 (reported on 21.6% of returns)
Here:
$2,159
State:
$2,285
(% of AGI for various income ranges: 7.8% for AGIs below $25k, 1.1% for AGIs $25k-50k)
Percentage of individuals using paid preparers for their 2012 taxes: 50.0%
Here:
50%
State:
51%
(% for various income ranges: 38.5% for AGIs below $25k, 57.1% for AGIs $25k-50k, 52.9% for AGIs $50k-75k, 55.6% for AGIs $75k-100k, 66.7% for AGIs $100k-200k)
Averages for the 2004 tax year for zip code 43148, filed in 2005:
Average Adjusted Gross Income (AGI) in 2004: $35,998 (Individual Income Tax Returns)
Here:
$35,998
State:
$44,480
Salary/wage: $34,405 (reported on 86.0% of returns)
Here:
$34,405
State:
$39,198
(% of AGI for various income ranges: 87.1% for AGIs below $10k, 73.2% for AGIs $10k-25k, 86.3% for AGIs $25k-50k, 85.5% for AGIs $50k-75k, 89.0% for AGIs $75k-100k, 64.5% for AGIs over 100k)
Taxable interest for individuals: $982 (reported on 39.8% of returns)
This zip code:
$982
Ohio:
$1,532
(% of AGI for various income ranges: 5.2% for AGIs below $10k, 2.5% for AGIs $10k-25k, 1.1% for AGIs $25k-50k, 0.7% for AGIs $50k-75k, 0.2% for AGIs $75k-100k, 1.0% for AGIs over 100k)
Taxable dividends: $595 (reported on 15.6% of returns)
Here:
$595
State:
$3,496
(% of AGI for various income ranges: 0.7% for AGIs below $10k, 0.7% for AGIs $10k-25k, 0.2% for AGIs $25k-50k, 0.2% for AGIs $50k-75k, 0.1% for AGIs $75k-100k, 0.3% for AGIs over 100k)
Net capital gain/loss: +$2,898 (reported on 13.0% of returns)
Here:
+$2,898
State:
+$8,582
(% of AGI for various income ranges: -0.8% for AGIs below $10k, 0.4% for AGIs $10k-25k, 0.5% for AGIs $25k-50k, 0.8% for AGIs $50k-75k, 0.9% for AGIs $75k-100k, 3.8% for AGIs over 100k)
Profit/loss from business: +$4,135 (reported on 12.9% of returns)
Here:
+$4,135
State:
+$10,813
(% of AGI for various income ranges: 11.8% for AGIs below $10k, 4.9% for AGIs $10k-25k, 1.4% for AGIs $25k-50k, 0.6% for AGIs $50k-75k, 0.5% for AGIs $75k-100k)
IRA payment deduction: $1,500 (reported on 1.4% of returns)
43148:
$1,500
Ohio:
$2,794
Total itemized deductions: $14,319 (23% of AGI, reported on 30.7% of returns)
Here:
$14,319
State:
$17,503
Here:
22.8% of AGI
State:
20.8% of AGI
(% of AGI for various income ranges: 5.3% for AGIs $10k-25k, 10.9% for AGIs $25k-50k, 14.8% for AGIs $50k-75k, 16.2% for AGIs $75k-100k, 13.1% for AGIs over 100k)
Charity contributions deductions: $2,084 (3% of AGI, reported on 24.4% of returns)
Here:
$2,084
State:
$3,087
Here:
3.2% of AGI
State:
3.4% of AGI
(% of AGI for various income ranges: 0.5% for AGIs $10k-25k, 1.1% for AGIs $25k-50k, 1.8% for AGIs $50k-75k, 1.7% for AGIs $75k-100k, 2.1% for AGIs over 100k)
Total tax: $4,011 (reported on 73.5% of returns)
43148:
$4,011
State:
$6,781
(% of AGI for various income ranges: 2.7% for AGIs below $10k, 3.9% for AGIs $10k-25k, 6.4% for AGIs $25k-50k, 7.5% for AGIs $50k-75k, 10.1% for AGIs $75k-100k, 15.8% for AGIs over 100k)
Earned income credit: $1,782 (reported on 16.9% of returns)
Here:
$1,782
State:
$1,696
Percentage of individuals using paid preparers for their 2004 taxes: 52.6%
Here:
53%
State:
55%
(% for various income ranges: 42.9% for AGIs below $10k, 53.6% for AGIs $10k-25k, 55.8% for AGIs $25k-50k, 55.3% for AGIs $50k-75k, 52.1% for AGIs $75k-100k, 63.6% for AGIs over 100k)
Likely homosexual households (counted as self-reported same-sex unmarried-partner households)
Lesbian couples: 0.5% of all households
Gay men: 0.0% of all households
Household received Food Stamps/SNAP in the past 12 months: 134 Household did not receive Food Stamps/SNAP in the past 12 months: 593
Women who had a birth in the past 12 months: 35 (6 now married, 28 unmarried) Women who did not have a birth in the past 12 months: 312 (145 now married, 167 unmarried)
Housing units in zip code 43148 with a mortgage: 309 (18 second mortgage, 16 both second mortgage and home equity loan) Median monthly owner costs for units with a mortgage: $1,373 Median monthly owner costs for units without a mortgage: $467
Residents with income below the poverty level in 2022:
This zip code:
8.8%
Whole state:
13.4%
Residents with income below 50% of the poverty level in 2022:
This zip code:
2.4%
Whole state:
7.0%
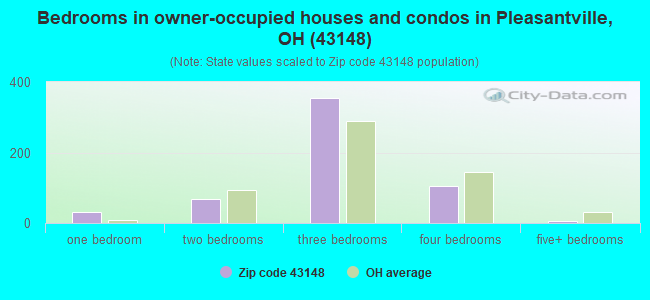
Median number of rooms in houses and condos:
Here:
6.7
State:
6.7
Median number of rooms in apartments:
Here:
5.6
State:
4.4
Notable locations in this zip code not listed on our city pages
Cemeteries: New Salem Methodist Protestant Cemetery (1), New Saint Peters Cemetery (2), Baptist Cemetery (3), Hampson Cemetery (4), New Salem Methodist Episcopal Cemetery (5). Display/hide their locations on the map
In group quarters: 6 (-1 institutionalized population)
Size of family households: 266 2-persons, 136 3-persons, 53 4-persons, 67 5-persons, 9 6-persons, 8 7-or-more-persons
Size of nonfamily households: 142 1-person, 34 2-persons, 4 4-persons
267 married couples with children.
70 single-parent households (43 men, 27 women).
98.2% of residents of 43148 zip code speak English at home.
0.4% of residents speak Spanish at home (100% very well).
0.8% of residents speak Asian or Pacific Island language at home (93% very well, 7% well).
0.2% of residents speak other language at home (100% very well).
Foreign born population: 3 (0.2%) (0.0% of them are naturalized citizens)
:
0.2%
Whole state:
5.0%
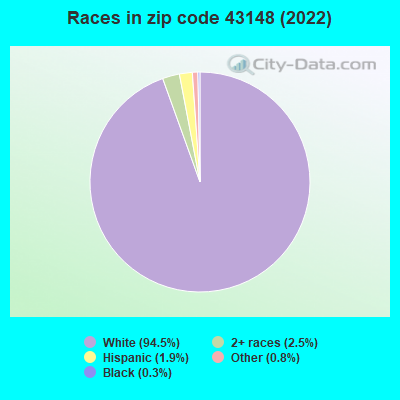
33%Cameroon
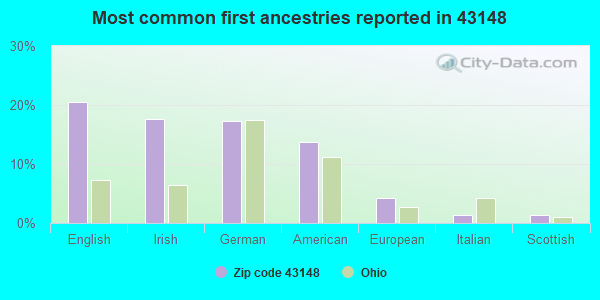
20%English
18%Irish
17%German
14%American
4%European
1%Italian
1%Scottish
Year of entry for the foreign-born population
32010 or later
02000 to 2009
01990 to 1999
1Before 1990
Facilities with environmental interests located in this zip code:
BAY PACKING CO (4095 LANCASTER-THORNVILLE in PLEASANTVILLE, OH)
STATE MASTER (Ohio general info) - PCS-OH0034568, National Pollutant Discharge Elimination System Permit National Pollutant Discharge Elimination System NON-MAJOR (Tracking pollutant discharge elimination systems) - permit Business SIC classification: MEAT PACKING PLANTS Organizations: BAY PACKING COMPANY (CONTACT/OWNER)
Housing units lacking complete plumbing facilities: 0.7% Housing units lacking complete kitchen facilities: 0.7%
32.5%Electricity
31.1%Utility gas
21.4%Bottled, tank, or LP gas
8.0%Wood
7.3%Fuel oil, kerosene, etc.
Population in 1990: 1,272. Population change in the 1990s: +562 (+44.2%).
Place of birth for U.S.-born residents:
This state: 1,659
Northeast: 27
Midwest: 43
South: 103
West: 26
61% of the 43148 zip code residents lived in the same house 5 years ago. Out of people who lived in different houses, 77% lived in this county. Out of people who lived in different counties, 50% lived in Ohio.
94% of the 43148 zip code residents lived in the same house 1 year ago. Out of people who lived in different houses, 36% moved from this county. Out of people who lived in different houses, 66% moved from different county within same state. Out of people who lived in different houses, 3% moved from abroad.
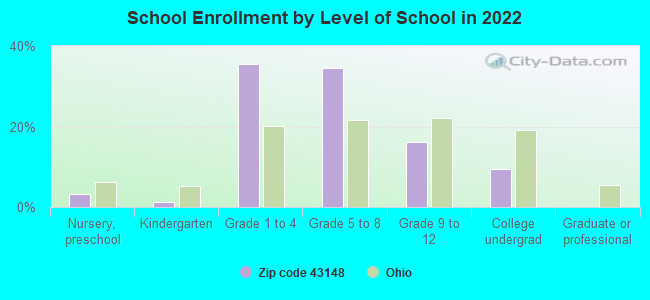
Private vs. public school enrollment:
Students in private schools in grades 1 to 8 (elementary and middle school): 7
Here:
3.2%
Ohio:
16.0%
Students in private schools in grades 9 to 12 (high school): 3
Here:
5.6%
Ohio:
13.1%
Students in private undergraduate colleges: 4
Here:
13.9%
Ohio:
22.3%
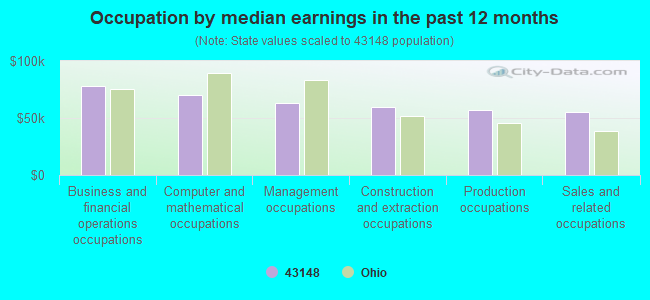
Occupation by median earnings in the past 12 months ($)
77,916Business and financial operations occupations
70,164Computer and mathematical occupations
63,341Management occupations
59,754Construction and extraction occupations
56,965Production occupations
55,484Sales and related occupations
Companies with federal contracts located in this zip code:
HEALTH CARE AND RETIREMENT COR (0000) (7820 PLEASANTVILLE RD in PLEASANTVILLE, OH) : $119,966 in 12 contractsfrom 2000 to 2006
Contracts for Nursing Home Care Contracts by Department of Veterans Affairs Signed by year:2000: $4,000; 2001: $37,000; 2002: $27,000; 2003: $0; 2004: $48,334; 2005: $0; 2006: $3,632.
Biggest contracts:
$19,000 with Department of Veterans Affairs for Nursing Home Care Contracts. Signed on 2002-07-15. Completion date: 2002-12-15.
$16,761, same as above.Signed on 2004-04-01. Completion date: 2004-06-30.
$14,000, same as above.Signed on 2001-01-15. Completion date: 2001-03-15.
$13,000, same as above.Signed on 2001-04-15. Completion date: 2001-07-15.
Top industries in this zip code by the number of employees in 2005:
Health Care and Social Assistance: Nursing Care Facilities (100-249 employees: 1 establishment)
Administrative and Support and Waste Management and Remediation Services: Temporary Help Services (10-19: 1, 1-4: 1)
Accommodation and Food Services: Limited-Service Restaurants (10-19: 1)
Other Services (except Public Administration): General Automotive Repair (1-4: 2)
Accommodation and Food Services: Rooming and Boarding Houses (1-4: 1)
Construction: Flooring Contractors (1-4: 1)
Real Estate and Rental and Leasing: Lessors of Nonresidential Buildings (except Miniwarehouses) (1-4: 1)
Administrative and Support and Waste Management and Remediation Services: Collection Agencies (1-4: 1)
People in group quarters in 2010:
16 people in group homes intended for adults
6 people in workers' group living quarters and job corps centers
People in group quarters in 2000:
9 people in hospitals/wards and hospices for chronically ill
9 people in military hospitals or wards for chronically ill
Fatal accident statistics in 2014:
Fatal accident count: 1
Vehicles involved in fatal accidents: 2
Fatal accidents caused by drunken drivers: 0
Fatalities: 1
Persons involved in fatal accidents: 2
Pedestrians involved in fatal accidents: 0
Fatal accident statistics in 2012:
Fatal accident count: 1
Vehicles involved in fatal accidents: 1
Fatal accidents caused by drunken drivers: 1
Fatalities: 1
Persons involved in fatal accidents: 2
Pedestrians involved in fatal accidents: 0
Home Mortgage Disclosure Act Aggregated Statistics For Year 2009 (Based on 4 partial tracts)
A) FHA, FSA/RHS & VA Home Purchase Loans
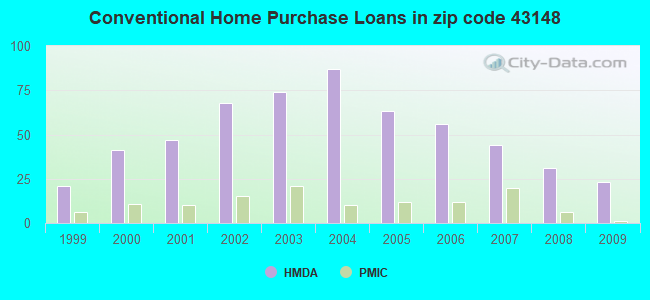
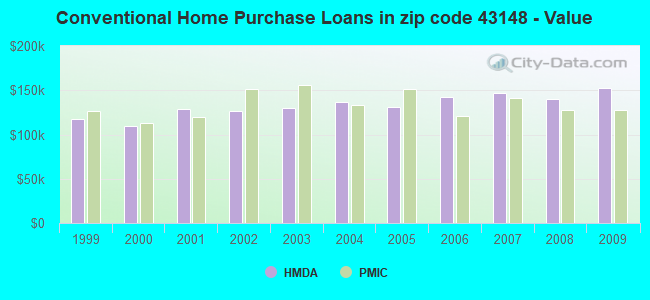
B) Conventional Home Purchase Loans
C) Refinancings
D) Home Improvement Loans
F) Non-occupant Loans on < 5 Family Dwellings (A B C & D)
G) Loans On Manufactured Home Dwelling (A B C & D)
Number
Average Value
Number
Average Value
Number
Average Value
Number
Average Value
Number
Average Value
Number
Average Value
LOANS ORIGINATED
12
$145,928
23
$151,984
121
$144,390
6
$19,037
5
$74,310
5
$96,154
APPLICATIONS APPROVED, NOT ACCEPTED
1
$24,480
2
$156,010
6
$125,480
2
$98,710
0
$0
1
$53,310
APPLICATIONS DENIED
5
$109,834
4
$129,150
51
$153,289
2
$15,935
1
$144,720
2
$100,260
APPLICATIONS WITHDRAWN
1
$109,890
2
$164,895
14
$173,524
1
$8,290
1
$44,970
1
$70,180
FILES CLOSED FOR INCOMPLETENESS
0
$0
1
$13,600
3
$224,063
0
$0
0
$0
0
$0
Aggregated Statistics For Year 2008 (Based on 4 partial tracts)
A) FHA, FSA/RHS & VA Home Purchase Loans
B) Conventional Home Purchase Loans
C) Refinancings
D) Home Improvement Loans
E) Loans on Dwellings For 5+ Families
F) Non-occupant Loans on < 5 Family Dwellings (A B C & D)
G) Loans On Manufactured Home Dwelling (A B C & D)
Number
Average Value
Number
Average Value
Number
Average Value
Number
Average Value
Number
Average Value
Number
Average Value
Number
Average Value
LOANS ORIGINATED
15
$150,951
31
$140,406
63
$135,644
8
$54,890
1
$57,120
10
$77,526
2
$97,920
APPLICATIONS APPROVED, NOT ACCEPTED
1
$35,530
2
$125,525
8
$136,466
2
$8,885
0
$0
1
$33,730
1
$22,300
APPLICATIONS DENIED
1
$152,860
5
$126,608
42
$148,125
7
$53,890
0
$0
1
$53,850
1
$83,780
APPLICATIONS WITHDRAWN
2
$86,345
1
$72,180
15
$167,451
1
$115,960
0
$0
1
$338,630
2
$99,095
FILES CLOSED FOR INCOMPLETENESS
1
$53,860
1
$13,060
4
$128,632
0
$0
0
$0
1
$13,060
0
$0
Aggregated Statistics For Year 2007 (Based on 4 partial tracts)
A) FHA, FSA/RHS & VA Home Purchase Loans
B) Conventional Home Purchase Loans
C) Refinancings
D) Home Improvement Loans
F) Non-occupant Loans on < 5 Family Dwellings (A B C & D)
G) Loans On Manufactured Home Dwelling (A B C & D)
Number
Average Value
Number
Average Value
Number
Average Value
Number
Average Value
Number
Average Value
Number
Average Value
LOANS ORIGINATED
4
$122,565
44
$147,292
73
$129,631
13
$68,597
7
$76,587
3
$111,850
APPLICATIONS APPROVED, NOT ACCEPTED
0
$0
3
$145,620
13
$158,283
2
$54,130
1
$32,640
1
$31,010
APPLICATIONS DENIED
3
$171,823
16
$192,730
78
$128,974
9
$58,024
3
$131,163
4
$82,095
APPLICATIONS WITHDRAWN
1
$160,480
4
$131,055
19
$122,196
1
$64,740
1
$264,010
1
$89,760
FILES CLOSED FOR INCOMPLETENESS
0
$0
2
$150,860
6
$161,110
0
$0
0
$0
0
$0
Aggregated Statistics For Year 2006 (Based on 4 partial tracts)
A) FHA, FSA/RHS & VA Home Purchase Loans
B) Conventional Home Purchase Loans
C) Refinancings
D) Home Improvement Loans
E) Loans on Dwellings For 5+ Families
F) Non-occupant Loans on < 5 Family Dwellings (A B C & D)
G) Loans On Manufactured Home Dwelling (A B C & D)
Number
Average Value
Number
Average Value
Number
Average Value
Number
Average Value
Number
Average Value
Number
Average Value
Number
Average Value
LOANS ORIGINATED
4
$116,408
56
$142,055
106
$123,087
18
$54,949
0
$0
11
$88,896
3
$85,053
APPLICATIONS APPROVED, NOT ACCEPTED
0
$0
6
$121,680
24
$138,503
4
$21,992
0
$0
1
$51,630
0
$0
APPLICATIONS DENIED
1
$28,830
10
$122,882
92
$135,791
14
$57,277
1
$2,780
4
$101,778
4
$77,740
APPLICATIONS WITHDRAWN
1
$91,610
12
$137,928
31
$157,095
2
$38,730
0
$0
1
$48,960
1
$115,330
FILES CLOSED FOR INCOMPLETENESS
0
$0
2
$104,100
12
$132,840
1
$12,510
0
$0
0
$0
0
$0
Aggregated Statistics For Year 2005 (Based on 4 partial tracts)
A) FHA, FSA/RHS & VA Home Purchase Loans
B) Conventional Home Purchase Loans
C) Refinancings
D) Home Improvement Loans
F) Non-occupant Loans on < 5 Family Dwellings (A B C & D)
G) Loans On Manufactured Home Dwelling (A B C & D)
Number
Average Value
Number
Average Value
Number
Average Value
Number
Average Value
Number
Average Value
Number
Average Value
LOANS ORIGINATED
6
$125,780
63
$130,596
111
$131,074
22
$77,065
11
$110,451
5
$78,362
APPLICATIONS APPROVED, NOT ACCEPTED
1
$78,840
7
$94,313
23
$115,586
4
$38,680
2
$48,055
1
$13,200
APPLICATIONS DENIED
1
$31,550
17
$106,384
80
$138,609
12
$40,662
3
$89,587
3
$62,450
APPLICATIONS WITHDRAWN
0
$0
5
$181,032
51
$152,483
6
$157,032
2
$272,500
1
$49,410
FILES CLOSED FOR INCOMPLETENESS
0
$0
1
$127,040
8
$177,536
0
$0
0
$0
0
$0
Aggregated Statistics For Year 2004 (Based on 4 partial tracts)
A) FHA, FSA/RHS & VA Home Purchase Loans
B) Conventional Home Purchase Loans
C) Refinancings
D) Home Improvement Loans
F) Non-occupant Loans on < 5 Family Dwellings (A B C & D)
G) Loans On Manufactured Home Dwelling (A B C & D)
Number
Average Value
Number
Average Value
Number
Average Value
Number
Average Value
Number
Average Value
Number
Average Value
LOANS ORIGINATED
5
$160,472
87
$136,918
112
$125,117
20
$55,226
8
$92,138
5
$82,686
APPLICATIONS APPROVED, NOT ACCEPTED
0
$0
8
$101,455
19
$121,850
3
$8,050
1
$70,180
1
$17,410
APPLICATIONS DENIED
3
$101,857
21
$103,729
68
$136,293
7
$85,620
3
$54,337
4
$47,825
APPLICATIONS WITHDRAWN
0
$0
12
$119,968
50
$127,470
3
$81,983
2
$79,150
0
$0
FILES CLOSED FOR INCOMPLETENESS
1
$52,770
2
$111,250
11
$144,194
2
$9,520
0
$0
0
$0
Aggregated Statistics For Year 2003 (Based on 4 partial tracts)
A) FHA, FSA/RHS & VA Home Purchase Loans
B) Conventional Home Purchase Loans
C) Refinancings
D) Home Improvement Loans
F) Non-occupant Loans on < 5 Family Dwellings (A B C & D)
Number
Average Value
Number
Average Value
Number
Average Value
Number
Average Value
Number
Average Value
LOANS ORIGINATED
7
$116,397
74
$130,117
312
$122,132
8
$34,862
7
$90,293
APPLICATIONS APPROVED, NOT ACCEPTED
0
$0
5
$60,312
32
$129,282
1
$11,660
1
$76,160
APPLICATIONS DENIED
1
$48,860
7
$118,331
85
$133,744
8
$39,748
2
$118,700
APPLICATIONS WITHDRAWN
1
$159,390
6
$105,618
46
$126,891
0
$0
1
$19,430
FILES CLOSED FOR INCOMPLETENESS
0
$0
2
$133,800
9
$139,208
1
$17,210
0
$0
Aggregated Statistics For Year 2002 (Based on 4 partial tracts)
A) FHA, FSA/RHS & VA Home Purchase Loans
B) Conventional Home Purchase Loans
C) Refinancings
D) Home Improvement Loans
F) Non-occupant Loans on < 5 Family Dwellings (A B C & D)
Number
Average Value
Number
Average Value
Number
Average Value
Number
Average Value
Number
Average Value
LOANS ORIGINATED
14
$135,586
68
$126,690
203
$116,393
13
$26,712
8
$100,496
APPLICATIONS APPROVED, NOT ACCEPTED
1
$152,680
7
$97,951
30
$106,002
2
$39,140
1
$5,550
APPLICATIONS DENIED
0
$0
9
$97,144
78
$112,499
7
$47,507
1
$46,080
APPLICATIONS WITHDRAWN
2
$119,135
6
$134,525
50
$118,814
1
$63,840
0
$0
FILES CLOSED FOR INCOMPLETENESS
0
$0
1
$100,640
11
$131,598
0
$0
1
$43,520
Aggregated Statistics For Year 2001 (Based on 4 partial tracts)
A) FHA, FSA/RHS & VA Home Purchase Loans
B) Conventional Home Purchase Loans
C) Refinancings
D) Home Improvement Loans
F) Non-occupant Loans on < 5 Family Dwellings (A B C & D)
Number
Average Value
Number
Average Value
Number
Average Value
Number
Average Value
Number
Average Value
LOANS ORIGINATED
10
$117,031
47
$129,193
215
$108,003
20
$37,451
4
$84,468
APPLICATIONS APPROVED, NOT ACCEPTED
1
$76,620
7
$116,806
34
$124,775
3
$12,573
1
$73,830
APPLICATIONS DENIED
1
$169,340
13
$94,202
80
$115,859
9
$29,156
2
$55,800
APPLICATIONS WITHDRAWN
2
$126,445
9
$109,843
36
$119,014
1
$24,430
0
$0
FILES CLOSED FOR INCOMPLETENESS
1
$63,290
2
$66,765
8
$115,065
1
$15,780
0
$0
Aggregated Statistics For Year 2000 (Based on 4 partial tracts)
A) FHA, FSA/RHS & VA Home Purchase Loans
B) Conventional Home Purchase Loans
C) Refinancings
D) Home Improvement Loans
F) Non-occupant Loans on < 5 Family Dwellings (A B C & D)
Number
Average Value
Number
Average Value
Number
Average Value
Number
Average Value
Number
Average Value
LOANS ORIGINATED
11
$129,360
41
$109,295
71
$94,215
18
$14,836
3
$50,707
APPLICATIONS APPROVED, NOT ACCEPTED
5
$44,172
4
$109,518
16
$85,812
5
$17,268
0
$0
APPLICATIONS DENIED
3
$67,103
15
$80,787
42
$108,128
11
$16,364
1
$71,070
APPLICATIONS WITHDRAWN
1
$113,900
8
$102,319
16
$83,972
1
$13,320
1
$54,960
FILES CLOSED FOR INCOMPLETENESS
0
$0
1
$94,940
4
$96,175
0
$0
1
$42,430
Aggregated Statistics For Year 1999 (Based on 2 partial tracts)
A) FHA, FSA/RHS & VA Home Purchase Loans
B) Conventional Home Purchase Loans
C) Refinancings
D) Home Improvement Loans
F) Non-occupant Loans on < 5 Family Dwellings (A B C & D)
Detailed PMIC statistics for the following Tracts:0302.00
, 0310.00
2002 - 2018 National Fire Incident Reporting System (NFIRS) incidents
According to the data from the years 2002 - 2018 the average number of fires per year is 19. The highest number of reported fire incidents - 44 took place in 2003, and the least - 5 in 2017. The data has an increasing trend.
When looking into fire subcategories, the most incidents belonged to: Structure Fires (66.4%), and Outside Fires (23.5%).
Fire incident types reported to NFIRS in Zip Code 43148


 Nearest zip codes: 43157, 43046, 43150, 43008, 43105, 43076.
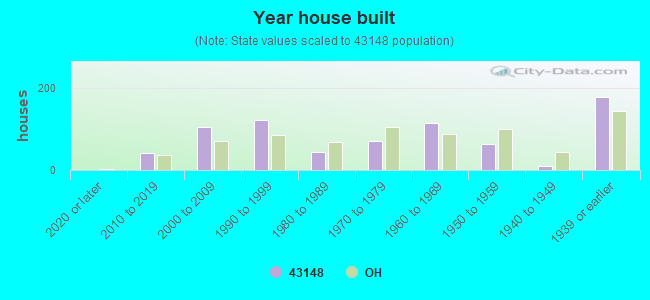


 According to the data from the years 2002 - 2018 the average number of fires per year is 19. The highest number of reported fire incidents - 44 took place in 2003, and the least - 5 in 2017. The data has an increasing trend.
 When looking into fire subcategories, the most incidents belonged to: Structure Fires (66.4%), and Outside Fires (23.5%).