Estimated median house/condo value in 2022: $134,730
43115:
$134,730
Ohio:
$204,100
According to our research of Ohio and other state lists, there was 1 registered sex offender living in 43115 zip code as of June 03, 2024. The ratio of all residents to sex offenders in zip code 43115 is 1,471 to 1. The ratio of registered sex offenders to all residents in this zip code is much lower than the state average.
Median resident age:
This zip code:
37.7 years
Ohio median age:
39.9 years
Average household size:
This zip code:
3.4 people
Ohio:
2.4 people
Averages for the 2020 tax year for zip code 43115, filed in 2021:
Average Adjusted Gross Income (AGI) in 2020: $53,169 (Individual Income Tax Returns)
Here:
$53,169
State:
$67,288
Salary/wage: $45,833 (reported on 79.3% of returns)
Here:
$45,833
State:
$55,628
(% of AGI for various income ranges: 1144.6% for AGIs below $25k, 3460.0% for AGIs $25k-50k, 7828.3% for AGIs $50k-75k, 9177.5% for AGIs $75k-100k, 16822.5% for AGIs $100k-200k)
Taxable interest for individuals: $429 (reported on 29.3% of returns)
This zip code:
$429
Ohio:
$1,518
(% of AGI for various income ranges: 5.4% for AGIs below $25k, 11.5% for AGIs $25k-50k, 13.3% for AGIs $50k-75k, 15.0% for AGIs $75k-100k, 92.5% for AGIs $100k-200k)
Ordinary dividends: $3,640 (reported on 8.6% of returns)
Here:
$3,640
State:
$7,167
(% of AGI for various income ranges: 18.5% for AGIs below $25k, 395.0% for AGIs $75k-100k)
Net capital gain/loss in AGI: +$5,460 (reported on 8.6% of returns)
Here:
+$5,460
State:
+$18,919
(% of AGI for various income ranges: 24.6% for AGIs $25k-50k, 602.5% for AGIs $100k-200k)
Profit/loss from business: +$7,362 (reported on 13.8% of returns)
Here:
+$7,362
State:
+$13,744
(% of AGI for various income ranges: 115.4% for AGIs below $25k, 116.9% for AGIs $25k-50k, 717.5% for AGIs $75k-100k)
Taxable individual retirement arrangement distribution: $16,750 (reported on 6.9% of returns)
43115:
$16,750
Ohio:
$18,876
(% of AGI for various income ranges: 152.3% for AGIs below $25k, 786.7% for AGIs $50k-75k)
Earned income credit: $2,683 (reported on 20.7% of returns)
Here:
$2,683
State:
$2,304
(% of AGI for various income ranges: 159.2% for AGIs below $25k, 88.5% for AGIs $25k-50k)
Percentage of individuals using paid preparers for their 2020 taxes: 91.4%
Here:
91%
State:
94%
(% for various income ranges: 88.2% for AGIs below $25k, 94.1% for AGIs $25k-50k, 90.0% for AGIs $50k-75k, 100.0% for AGIs $75k-100k, 87.5% for AGIs $100k-200k)
Averages for the 2012 tax year for zip code 43115, filed in 2013:
Average Adjusted Gross Income (AGI) in 2012: $44,651 (Individual Income Tax Returns)
Here:
$44,651
State:
$54,926
Salary/wage: $36,827 (reported on 86.0% of returns)
Here:
$36,827
State:
$45,869
(% of AGI for various income ranges: 80.1% for AGIs below $25k, 76.8% for AGIs $25k-50k, 73.3% for AGIs $50k-75k, 85.9% for AGIs $75k-100k, 51.7% for AGIs $100k-200k)
Taxable interest for individuals: $650 (reported on 24.6% of returns)
This zip code:
$650
Ohio:
$1,297
(% of AGI for various income ranges: 0.4% for AGIs below $25k, 0.4% for AGIs $25k-50k, 0.3% for AGIs $50k-75k, 0.5% for AGIs $100k-200k)
Ordinary dividends: $3,071 (reported on 12.3% of returns)
Here:
$3,071
State:
$5,821
(% of AGI for various income ranges: 0.9% for AGIs $25k-50k, 4.0% for AGIs $75k-100k)
Net capital gain/loss in AGI: +$567 (reported on 5.3% of returns)
Here:
+$567
State:
+$11,232
(% of AGI for various income ranges: 0.3% for AGIs $25k-50k)
Profit/loss from business: +$3,567 (reported on 10.5% of returns)
Here:
+$3,567
State:
+$12,773
(% of AGI for various income ranges: 6.0% for AGIs below $25k, 0.8% for AGIs $50k-75k)
Taxable individual retirement arrangement distribution: $9,100 (reported on 5.3% of returns)
43115:
$9,100
Ohio:
$14,511
(% of AGI for various income ranges: 4.7% for AGIs $25k-50k)
Total itemized deductions: $17,067 (19% of AGI, reported on 15.8% of returns)
Here:
$17,067
State:
$21,278
Here:
18.9% of AGI
State:
18.8% of AGI
(% of AGI for various income ranges: 4.6% for AGIs $25k-50k, 12.6% for AGIs $50k-75k, 8.0% for AGIs $100k-200k)
Charity contributions: $1,950 (reported on 10.5% of returns)
Here:
$1,950
State:
$3,943
(% of AGI for various income ranges: 1.1% for AGIs $50k-75k, 0.8% for AGIs $100k-200k)
Taxes paid: $5,456 (reported on 15.8% of returns)
43115:
$5,456
State:
$9,568
(% of AGI for various income ranges: 1.1% for AGIs $25k-50k, 3.6% for AGIs $50k-75k, 3.2% for AGIs $100k-200k)
Earned income credit: $2,500 (reported on 26.3% of returns)
Here:
$2,500
State:
$2,285
(% of AGI for various income ranges: 10.6% for AGIs below $25k, 1.3% for AGIs $25k-50k)
Percentage of individuals using paid preparers for their 2012 taxes: 57.9%
Here:
58%
State:
51%
(% for various income ranges: 54.5% for AGIs below $25k, 62.5% for AGIs $25k-50k, 55.6% for AGIs $50k-75k, 60.0% for AGIs $75k-100k, 60.0% for AGIs $100k-200k)
Averages for the 2004 tax year for zip code 43115, filed in 2005:
Average Adjusted Gross Income (AGI) in 2004: $35,642 (Individual Income Tax Returns)
Here:
$35,642
State:
$44,480
Salary/wage: $32,776 (reported on 87.1% of returns)
Here:
$32,776
State:
$39,198
(% of AGI for various income ranges: 122.7% for AGIs below $10k, 78.0% for AGIs $10k-25k, 83.1% for AGIs $25k-50k, 79.6% for AGIs $50k-75k, 84.5% for AGIs $75k-100k, 56.2% for AGIs over 100k)
Taxable interest for individuals: $750 (reported on 42.7% of returns)
This zip code:
$750
Ohio:
$1,532
(% of AGI for various income ranges: 6.8% for AGIs below $10k, 1.4% for AGIs $10k-25k, 0.6% for AGIs $25k-50k, 1.1% for AGIs $50k-75k, 0.4% for AGIs $75k-100k, 0.4% for AGIs over 100k)
Taxable dividends: $1,127 (reported on 13.4% of returns)
Here:
$1,127
State:
$3,496
(% of AGI for various income ranges: 2.3% for AGIs below $10k, 0.1% for AGIs $10k-25k, 0.2% for AGIs $25k-50k, 0.3% for AGIs $50k-75k, 1.2% for AGIs $75k-100k)
Profit/loss from business: +$1,262 (reported on 10.3% of returns)
Here:
+$1,262
State:
+$10,813
(% of AGI for various income ranges: -0.7% for AGIs below $10k, 0.0% for AGIs $25k-50k, 0.0% for AGIs $50k-75k, 2.1% for AGIs $75k-100k)
IRA payment deduction: $2,273 (reported on 1.9% of returns)
43115:
$2,273
Ohio:
$2,794
Total itemized deductions: $13,008 (21% of AGI, reported on 20.0% of returns)
Here:
$13,008
State:
$17,503
Here:
21.2% of AGI
State:
20.8% of AGI
Charity contributions deductions: $1,566 (2% of AGI, reported on 12.9% of returns)
Here:
$1,566
State:
$3,087
Here:
2.4% of AGI
State:
3.4% of AGI
Total tax: $4,119 (reported on 78.6% of returns)
43115:
$4,119
State:
$6,781
(% of AGI for various income ranges: 3.2% for AGIs below $10k, 4.7% for AGIs $10k-25k, 6.8% for AGIs $25k-50k, 9.6% for AGIs $50k-75k, 11.6% for AGIs $75k-100k, 17.4% for AGIs over 100k)
Earned income credit: $1,689 (reported on 15.3% of returns)
Here:
$1,689
State:
$1,696
Percentage of individuals using paid preparers for their 2004 taxes: 64.9%
Here:
65%
State:
55%
(% for various income ranges: 58.8% for AGIs below $10k, 68.4% for AGIs $10k-25k, 65.3% for AGIs $25k-50k, 70.3% for AGIs $50k-75k, 79.5% for AGIs $75k-100k)
Household received Food Stamps/SNAP in the past 12 months: 139 Household did not receive Food Stamps/SNAP in the past 12 months: 438
Women who had a birth in the past 12 months: 12 (8 now married, 4 unmarried) Women who did not have a birth in the past 12 months: 330 (121 now married, 208 unmarried)
Housing units in zip code 43115 with a mortgage: 316 (26 second mortgage, 24 both second mortgage and home equity loan) Houses without a mortgage: 9
Median monthly owner costs for units with a mortgage: $1,311 Median monthly owner costs for units without a mortgage: $523
Residents with income below the poverty level in 2022:
This zip code:
11.1%
Whole state:
13.4%
Residents with income below 50% of the poverty level in 2022:
This zip code:
6.1%
Whole state:
7.0%
Median number of rooms in houses and condos:
Here:
6.1
State:
6.7
Median number of rooms in apartments:
Here:
5.1
State:
4.4
Notable locations in this zip code not listed on our city pages
Size of family households: 163 2-persons, 48 3-persons, 83 4-persons, 42 5-persons, 111 6-persons, 5 7-or-more-persons
Size of nonfamily households: 94 1-person, 22 2-persons
219 married couples with children.
333 single-parent households (7 men, 326 women).
97.4% of residents of 43115 zip code speak English at home.
0.8% of residents speak Spanish at home (53% very well, 47% well).
0.1% of residents speak other Indo-European language at home (100% very well).
0.6% of residents speak Asian or Pacific Island language at home (9% very well, 27% well, 64% not well).
Foreign born population: 13 (0.7%) (100.0% of them are naturalized citizens)
This zip code:
0.7%
Whole state:
5.0%
69%Marshall Islands
20%English
14%German
12%American
6%Irish
2%Scottish
2%European
1%Scotch-Irish
Year of entry for the foreign-born population
152010 or later
02000 to 2009
01990 to 1999
35Before 1990
Housing units lacking complete plumbing facilities: 0.6% Housing units lacking complete kitchen facilities: 4.4%
42.7%Electricity
25.8%Bottled, tank, or LP gas
13.7%Fuel oil, kerosene, etc.
8.7%Utility gas
5.5%Wood
3.7%Other fuel
Population in 1990: 1,523.
Place of birth for U.S.-born residents:
This state: 1,760
Northeast: 3
Midwest: 36
South: 67
West: 16
69% of the 43115 zip code residents lived in the same house 5 years ago. Out of people who lived in different houses, 60% lived in this county. Out of people who lived in different counties, 50% lived in Ohio.
93% of the 43115 zip code residents lived in the same house 1 year ago. Out of people who lived in different houses, 54% moved from this county. Out of people who lived in different houses, 48% moved from different county within same state.
Private vs. public school enrollment:
Students in private schools in grades 1 to 8 (elementary and middle school): 17
Here:
3.9%
Ohio:
16.0%
Students in private schools in grades 9 to 12 (high school):
Here:
0.0%
Ohio:
13.1%
Students in private undergraduate colleges:
Here:
0.0%
Ohio:
22.3%
Occupation by median earnings in the past 12 months ($)
67,383Management occupations
67,164Education, training, and library occupations
62,908Health technologists and technicians
57,064Construction and extraction occupations
52,306Office and administrative support occupations
47,728Installation, maintenance, and repair occupations
Top industries in this zip code by the number of employees in 2005:
Health Care and Social Assistance: Nursing Care Facilities (20-49 employees: 1 establishment)
Finance and Insurance: Commercial Banking (10-19: 1)
Accommodation and Food Services: Limited-Service Restaurants (5-9: 1)
Construction: Plumbing, Heating, and Air-Conditioning Contractors (5-9: 1)
Construction: All Other Specialty Trade Contractors (5-9: 1)
Construction: Framing Contractors (1-4: 1)
Other Services (except Public Administration): General Automotive Repair (1-4: 1)
People in group quarters in 2000:
18 people in nursing homes
Fatal accident statistics in 2014:
Fatal accident count: 1
Vehicles involved in fatal accidents: 1
Fatal accidents caused by drunken drivers: 0
Fatalities: 2
Persons involved in fatal accidents: 2
Pedestrians involved in fatal accidents: 0
Fatal accident statistics in 2010:
Fatal accident count: 1
Vehicles involved in fatal accidents: 1
Fatal accidents caused by drunken drivers: 1
Fatalities: 1
Persons involved in fatal accidents: 1
Pedestrians involved in fatal accidents: 0
Home Mortgage Disclosure Act Aggregated Statistics For Year 2009 (Based on 2 partial tracts)
A) FHA, FSA/RHS & VA Home Purchase Loans
B) Conventional Home Purchase Loans
C) Refinancings
D) Home Improvement Loans
G) Loans On Manufactured Home Dwelling (A B C & D)
Number
Average Value
Number
Average Value
Number
Average Value
Number
Average Value
Number
Average Value
LOANS ORIGINATED
3
$101,577
1
$168,540
13
$105,081
0
$0
1
$74,180
APPLICATIONS APPROVED, NOT ACCEPTED
0
$0
0
$0
1
$106,760
0
$0
0
$0
APPLICATIONS DENIED
0
$0
0
$0
7
$135,463
1
$19,700
0
$0
APPLICATIONS WITHDRAWN
0
$0
0
$0
3
$120,223
0
$0
0
$0
FILES CLOSED FOR INCOMPLETENESS
0
$0
0
$0
1
$81,720
0
$0
0
$0
Aggregated Statistics For Year 2008 (Based on 2 partial tracts)
A) FHA, FSA/RHS & VA Home Purchase Loans
B) Conventional Home Purchase Loans
C) Refinancings
D) Home Improvement Loans
F) Non-occupant Loans on < 5 Family Dwellings (A B C & D)
G) Loans On Manufactured Home Dwelling (A B C & D)
Number
Average Value
Number
Average Value
Number
Average Value
Number
Average Value
Number
Average Value
Number
Average Value
LOANS ORIGINATED
2
$113,090
3
$99,143
6
$103,765
2
$59,825
1
$68,340
1
$77,090
APPLICATIONS APPROVED, NOT ACCEPTED
0
$0
0
$0
0
$0
1
$6,570
0
$0
0
$0
APPLICATIONS DENIED
1
$78,800
1
$60,310
10
$96,550
1
$19,700
0
$0
0
$0
APPLICATIONS WITHDRAWN
0
$0
0
$0
1
$233,720
0
$0
0
$0
0
$0
FILES CLOSED FOR INCOMPLETENESS
0
$0
0
$0
0
$0
0
$0
0
$0
0
$0
Aggregated Statistics For Year 2007 (Based on 2 partial tracts)
A) FHA, FSA/RHS & VA Home Purchase Loans
B) Conventional Home Purchase Loans
C) Refinancings
D) Home Improvement Loans
F) Non-occupant Loans on < 5 Family Dwellings (A B C & D)
G) Loans On Manufactured Home Dwelling (A B C & D)
Number
Average Value
Number
Average Value
Number
Average Value
Number
Average Value
Number
Average Value
Number
Average Value
LOANS ORIGINATED
2
$114,305
6
$128,328
8
$97,979
1
$18,730
1
$65,420
0
$0
APPLICATIONS APPROVED, NOT ACCEPTED
0
$0
0
$0
2
$75,270
0
$0
0
$0
0
$0
APPLICATIONS DENIED
0
$0
2
$64,205
11
$114,635
4
$47,060
1
$82,690
1
$67,370
APPLICATIONS WITHDRAWN
0
$0
0
$0
4
$119,230
0
$0
0
$0
0
$0
FILES CLOSED FOR INCOMPLETENESS
0
$0
0
$0
1
$191,400
0
$0
0
$0
0
$0
Aggregated Statistics For Year 2006 (Based on 2 partial tracts)
A) FHA, FSA/RHS & VA Home Purchase Loans
B) Conventional Home Purchase Loans
C) Refinancings
D) Home Improvement Loans
F) Non-occupant Loans on < 5 Family Dwellings (A B C & D)
G) Loans On Manufactured Home Dwelling (A B C & D)
Number
Average Value
Number
Average Value
Number
Average Value
Number
Average Value
Number
Average Value
Number
Average Value
LOANS ORIGINATED
2
$103,480
8
$90,896
16
$102,995
1
$50,830
2
$57,760
1
$85,360
APPLICATIONS APPROVED, NOT ACCEPTED
0
$0
2
$37,695
3
$74,743
0
$0
0
$0
1
$18,480
APPLICATIONS DENIED
0
$0
3
$81,553
17
$90,471
2
$45,845
0
$0
1
$81,720
APPLICATIONS WITHDRAWN
0
$0
1
$222,040
8
$118,012
1
$56,910
0
$0
0
$0
FILES CLOSED FOR INCOMPLETENESS
0
$0
0
$0
1
$110,170
0
$0
0
$0
0
$0
Aggregated Statistics For Year 2005 (Based on 2 partial tracts)
A) FHA, FSA/RHS & VA Home Purchase Loans
B) Conventional Home Purchase Loans
C) Refinancings
D) Home Improvement Loans
F) Non-occupant Loans on < 5 Family Dwellings (A B C & D)
G) Loans On Manufactured Home Dwelling (A B C & D)
Number
Average Value
Number
Average Value
Number
Average Value
Number
Average Value
Number
Average Value
Number
Average Value
LOANS ORIGINATED
2
$146,040
8
$92,659
18
$91,673
3
$79,607
4
$56,788
2
$74,055
APPLICATIONS APPROVED, NOT ACCEPTED
0
$0
2
$55,450
4
$101,352
1
$15,810
1
$27,240
0
$0
APPLICATIONS DENIED
0
$0
4
$93,450
18
$86,174
3
$29,267
0
$0
1
$104,090
APPLICATIONS WITHDRAWN
0
$0
0
$0
10
$121,868
1
$346,070
0
$0
0
$0
FILES CLOSED FOR INCOMPLETENESS
0
$0
0
$0
2
$125,490
0
$0
0
$0
0
$0
Aggregated Statistics For Year 2004 (Based on 2 partial tracts)
A) FHA, FSA/RHS & VA Home Purchase Loans
B) Conventional Home Purchase Loans
C) Refinancings
D) Home Improvement Loans
F) Non-occupant Loans on < 5 Family Dwellings (A B C & D)
G) Loans On Manufactured Home Dwelling (A B C & D)
Number
Average Value
Number
Average Value
Number
Average Value
Number
Average Value
Number
Average Value
Number
Average Value
LOANS ORIGINATED
1
$128,170
10
$108,467
19
$98,368
3
$77,093
2
$77,945
1
$50,100
APPLICATIONS APPROVED, NOT ACCEPTED
0
$0
1
$47,420
5
$122,184
0
$0
0
$0
0
$0
APPLICATIONS DENIED
0
$0
3
$60,477
17
$103,274
3
$26,997
1
$30,400
2
$73,935
APPLICATIONS WITHDRAWN
0
$0
1
$84,150
10
$104,357
1
$15,320
0
$0
1
$65,660
FILES CLOSED FOR INCOMPLETENESS
0
$0
0
$0
4
$82,202
0
$0
0
$0
0
$0
Aggregated Statistics For Year 2003 (Based on 2 partial tracts)
A) FHA, FSA/RHS & VA Home Purchase Loans
B) Conventional Home Purchase Loans
C) Refinancings
D) Home Improvement Loans
F) Non-occupant Loans on < 5 Family Dwellings (A B C & D)
Number
Average Value
Number
Average Value
Number
Average Value
Number
Average Value
Number
Average Value
LOANS ORIGINATED
2
$95,335
7
$92,103
35
$94,591
4
$39,398
4
$62,745
APPLICATIONS APPROVED, NOT ACCEPTED
0
$0
2
$56,785
6
$97,767
0
$0
0
$0
APPLICATIONS DENIED
0
$0
1
$89,500
21
$108,340
2
$16,900
1
$35,020
APPLICATIONS WITHDRAWN
0
$0
0
$0
7
$111,837
1
$12,650
0
$0
FILES CLOSED FOR INCOMPLETENESS
0
$0
0
$0
3
$117,870
0
$0
0
$0
Aggregated Statistics For Year 2002 (Based on 2 partial tracts)
A) FHA, FSA/RHS & VA Home Purchase Loans
B) Conventional Home Purchase Loans
C) Refinancings
D) Home Improvement Loans
F) Non-occupant Loans on < 5 Family Dwellings (A B C & D)
Number
Average Value
Number
Average Value
Number
Average Value
Number
Average Value
Number
Average Value
LOANS ORIGINATED
2
$94,605
9
$92,200
27
$95,271
2
$10,945
2
$49,980
APPLICATIONS APPROVED, NOT ACCEPTED
0
$0
1
$176,320
10
$83,855
0
$0
0
$0
APPLICATIONS DENIED
0
$0
2
$58,975
18
$85,296
1
$16,050
1
$109,930
APPLICATIONS WITHDRAWN
0
$0
1
$42,320
10
$95,383
0
$0
1
$42,320
FILES CLOSED FOR INCOMPLETENESS
0
$0
0
$0
3
$93,063
0
$0
0
$0
Aggregated Statistics For Year 2001 (Based on 2 partial tracts)
A) FHA, FSA/RHS & VA Home Purchase Loans
B) Conventional Home Purchase Loans
C) Refinancings
D) Home Improvement Loans
F) Non-occupant Loans on < 5 Family Dwellings (A B C & D)
Number
Average Value
Number
Average Value
Number
Average Value
Number
Average Value
Number
Average Value
LOANS ORIGINATED
3
$110,170
8
$101,292
25
$83,943
4
$15,688
1
$58,120
APPLICATIONS APPROVED, NOT ACCEPTED
0
$0
1
$113,090
4
$107,190
0
$0
0
$0
APPLICATIONS DENIED
0
$0
2
$80,865
14
$72,022
3
$8,027
0
$0
APPLICATIONS WITHDRAWN
0
$0
1
$38,430
14
$88,646
1
$24,320
0
$0
FILES CLOSED FOR INCOMPLETENESS
0
$0
0
$0
2
$47,425
0
$0
0
$0
Aggregated Statistics For Year 2000 (Based on 2 partial tracts)
A) FHA, FSA/RHS & VA Home Purchase Loans
B) Conventional Home Purchase Loans
C) Refinancings
D) Home Improvement Loans
F) Non-occupant Loans on < 5 Family Dwellings (A B C & D)
Number
Average Value
Number
Average Value
Number
Average Value
Number
Average Value
Number
Average Value
LOANS ORIGINATED
3
$88,523
8
$76,486
13
$81,079
5
$10,458
2
$58,125
APPLICATIONS APPROVED, NOT ACCEPTED
0
$0
2
$67,730
4
$51,680
2
$17,995
0
$0
APPLICATIONS DENIED
2
$38,545
5
$70,868
11
$78,929
4
$20,065
0
$0
APPLICATIONS WITHDRAWN
1
$71,990
0
$0
6
$66,798
0
$0
0
$0
FILES CLOSED FOR INCOMPLETENESS
0
$0
0
$0
1
$85,120
0
$0
0
$0
Aggregated Statistics For Year 1999 (Based on 1 partial tract)
A) FHA, FSA/RHS & VA Home Purchase Loans
B) Conventional Home Purchase Loans
C) Refinancings
D) Home Improvement Loans
F) Non-occupant Loans on < 5 Family Dwellings (A B C & D)
Detailed PMIC statistics for the following Tracts:0216.00
2002 - 2018 National Fire Incident Reporting System (NFIRS) incidents
Based on the data from the years 2002 - 2018 the average number of fire incidents per year is 13. The highest number of fire incidents - 32 took place in 2010, and the least - 1 in 2002. The data has a growing trend.
When looking into fire subcategories, the most incidents belonged to: Outside Fires (42.7%), and Structure Fires (42.2%).
Fire incident types reported to NFIRS in Zip Code 43115


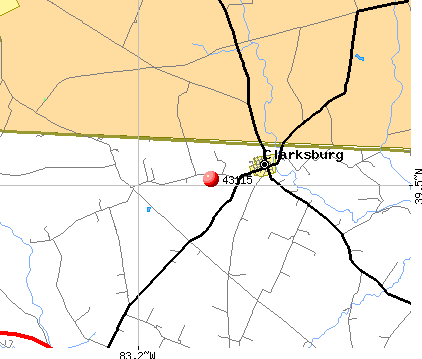 Nearest zip codes: 43164, 45628, 43145, 45681, 45617, 43113.


 Based on the data from the years 2002 - 2018 the average number of fire incidents per year is 13. The highest number of fire incidents - 32 took place in 2010, and the least - 1 in 2002. The data has a growing trend.
 When looking into fire subcategories, the most incidents belonged to: Outside Fires (42.7%), and Structure Fires (42.2%).