Cities: Pataskala, OH (34.77%) ,
Beechwood Trails, OH (4.96%) ,
New Albany, OH (1.09%) ,
Etna, OH (0.80%) ,
Kirkersville, OH (0.17%) ,
Reynoldsburg, OH (0.17%) Counties: Licking County, OH (98.17%) ,
Fairfield County, OH (1.83%) Estimated zip code population in 2022: 31,516
Zip code population in 2010: 27,644
Zip code population in 2000: 19,468
Houses and condos: 12,035
Renter-occupied apartments: 2,073
% of renters here:
18%State:
33%
March 2022 cost of living index in zip code 43062: 95.4
(near average, U.S. average is 100)
Land area: 78.8
sq. mi.
Water area: 0.4
sq. mi.
Population density: 400 people per square mile (very low).
OSM Map
General Map
Google Map
MSN Map
OSM Map
General Map
Google Map
MSN Map
OSM Map
General Map
Google Map
MSN Map
OSM Map
General Map
Google Map
MSN Map
Please wait while loading the map...
Real estate property taxes paid for housing units in 2022:
This zip code:
1.4% ($3,956)Ohio:
1.3% ($2,639)
Median real estate property taxes paid for housing units with mortgages in 2022: $4,082 (1.3%)
Median real estate property taxes paid for housing units with no mortgage in 2022: $3,615 (1.4%)
Profiles of local businesses
Business Search - 14 Million verified businesses
Males: 15,777 Females: 15,738
For population 25 years and over in 43062:
High school or higher: 93.9%Bachelor's degree or higher: 33.7%Graduate or professional degree: 11.3%Unemployed: 2.1%Mean travel time to work (commute): 29.0 minutes
For population 15 years and over in 43062:
Never married: 23.2%Now married: 63.4%Separated: 1.2%Widowed: 3.7%Divorced: 8.5%
Zip code 43062 compared to state average:
Unemployed percentage below state average. Black race population percentage below state average. Foreign-born population percentage above state average. Renting percentage below state average. House age below state average. 25,871 82.1% White 2,176 6.9% Asian 1,554 4.9% Black 977 3.1% Hispanic or Latino 909 2.9% Two or more races 26 0.08% American Indian
Data:
Median household income ($)
Median household income (% change since 2000)
Household income diversity
Ratio of average income to average house value (%)
Ratio of average income to average rent
Median household income ($) - White
Median household income ($) - Black or African American
Median household income ($) - Asian
Median household income ($) - Hispanic or Latino
Median household income ($) - American Indian and Alaska Native
Median household income ($) - Multirace
Median household income ($) - Other Race
Median household income for houses/condos with a mortgage ($)
Median household income for apartments without a mortgage ($)
Races - White alone (%)
Races - White alone (% change since 2000)
Races - Black alone (%)
Races - Black alone (% change since 2000)
Races - American Indian alone (%)
Races - American Indian alone (% change since 2000)
Races - Asian alone (%)
Races - Asian alone (% change since 2000)
Races - Hispanic (%)
Races - Hispanic (% change since 2000)
Races - Native Hawaiian and Other Pacific Islander alone (%)
Races - Native Hawaiian and Other Pacific Islander alone (% change since 2000)
Races - Two or more races (%)
Races - Two or more races (% change since 2000)
Races - Other race alone (%)
Races - Other race alone (% change since 2000)
Racial diversity
Unemployment (%)
Unemployment (% change since 2000)
Unemployment (%) - White
Unemployment (%) - Black or African American
Unemployment (%) - Asian
Unemployment (%) - Hispanic or Latino
Unemployment (%) - American Indian and Alaska Native
Unemployment (%) - Multirace
Unemployment (%) - Other Race
Population density (people per square mile)
Population - Males (%)
Population - Females (%)
Population - Males (%) - White
Population - Males (%) - Black or African American
Population - Males (%) - Asian
Population - Males (%) - Hispanic or Latino
Population - Males (%) - American Indian and Alaska Native
Population - Males (%) - Multirace
Population - Males (%) - Other Race
Population - Females (%) - White
Population - Females (%) - Black or African American
Population - Females (%) - Asian
Population - Females (%) - Hispanic or Latino
Population - Females (%) - American Indian and Alaska Native
Population - Females (%) - Multirace
Population - Females (%) - Other Race
Coronavirus confirmed cases (Jun 03, 2024)
Deaths caused by coronavirus (Jun 03, 2024)
Coronavirus confirmed cases (per 100k population) (Jun 03, 2024)
Deaths caused by coronavirus (per 100k population) (Jun 03, 2024)
Daily increase in number of cases (Jun 03, 2024)
Weekly increase in number of cases (Jun 03, 2024)
Cases doubled (in days) (Jun 03, 2024)
Hospitalized patients (Apr 18, 2022)
Negative test results (Apr 18, 2022)
Total test results (Apr 18, 2022)
COVID Vaccine doses distributed (per 100k population) (Sep 19, 2023)
COVID Vaccine doses administered (per 100k population) (Sep 19, 2023)
COVID Vaccine doses distributed (Sep 19, 2023)
COVID Vaccine doses administered (Sep 19, 2023)
Likely homosexual households (%)
Likely homosexual households (% change since 2000)
Likely homosexual households - Lesbian couples (%)
Likely homosexual households - Lesbian couples (% change since 2000)
Likely homosexual households - Gay men (%)
Likely homosexual households - Gay men (% change since 2000)
Cost of living index
Median gross rent ($)
Median contract rent ($)
Median monthly housing costs ($)
Median house or condo value ($)
Median house or condo value ($ change since 2000)
Mean house or condo value by units in structure - 1, detached ($)
Mean house or condo value by units in structure - 1, attached ($)
Mean house or condo value by units in structure - 2 ($)
Mean house or condo value by units in structure by units in structure - 3 or 4 ($)
Mean house or condo value by units in structure - 5 or more ($)
Mean house or condo value by units in structure - Boat, RV, van, etc. ($)
Mean house or condo value by units in structure - Mobile home ($)
Median house or condo value ($) - White
Median house or condo value ($) - Black or African American
Median house or condo value ($) - Asian
Median house or condo value ($) - Hispanic or Latino
Median house or condo value ($) - American Indian and Alaska Native
Median house or condo value ($) - Multirace
Median house or condo value ($) - Other Race
Median resident age
Resident age diversity
Median resident age - Males
Median resident age - Females
Median resident age - White
Median resident age - Black or African American
Median resident age - Asian
Median resident age - Hispanic or Latino
Median resident age - American Indian and Alaska Native
Median resident age - Multirace
Median resident age - Other Race
Median resident age - Males - White
Median resident age - Males - Black or African American
Median resident age - Males - Asian
Median resident age - Males - Hispanic or Latino
Median resident age - Males - American Indian and Alaska Native
Median resident age - Males - Multirace
Median resident age - Males - Other Race
Median resident age - Females - White
Median resident age - Females - Black or African American
Median resident age - Females - Asian
Median resident age - Females - Hispanic or Latino
Median resident age - Females - American Indian and Alaska Native
Median resident age - Females - Multirace
Median resident age - Females - Other Race
Commute - mean travel time to work (minutes)
Travel time to work - Less than 5 minutes (%)
Travel time to work - Less than 5 minutes (% change since 2000)
Travel time to work - 5 to 9 minutes (%)
Travel time to work - 5 to 9 minutes (% change since 2000)
Travel time to work - 10 to 19 minutes (%)
Travel time to work - 10 to 19 minutes (% change since 2000)
Travel time to work - 20 to 29 minutes (%)
Travel time to work - 20 to 29 minutes (% change since 2000)
Travel time to work - 30 to 39 minutes (%)
Travel time to work - 30 to 39 minutes (% change since 2000)
Travel time to work - 40 to 59 minutes (%)
Travel time to work - 40 to 59 minutes (% change since 2000)
Travel time to work - 60 to 89 minutes (%)
Travel time to work - 60 to 89 minutes (% change since 2000)
Travel time to work - 90 or more minutes (%)
Travel time to work - 90 or more minutes (% change since 2000)
Marital status - Never married (%)
Marital status - Now married (%)
Marital status - Separated (%)
Marital status - Widowed (%)
Marital status - Divorced (%)
Median family income ($)
Median family income (% change since 2000)
Median non-family income ($)
Median non-family income (% change since 2000)
Median per capita income ($)
Median per capita income (% change since 2000)
Median family income ($) - White
Median family income ($) - Black or African American
Median family income ($) - Asian
Median family income ($) - Hispanic or Latino
Median family income ($) - American Indian and Alaska Native
Median family income ($) - Multirace
Median family income ($) - Other Race
Median year house/condo built
Median year apartment built
Year house built - Built 2005 or later (%)
Year house built - Built 2000 to 2004 (%)
Year house built - Built 1990 to 1999 (%)
Year house built - Built 1980 to 1989 (%)
Year house built - Built 1970 to 1979 (%)
Year house built - Built 1960 to 1969 (%)
Year house built - Built 1950 to 1959 (%)
Year house built - Built 1940 to 1949 (%)
Year house built - Built 1939 or earlier (%)
Average household size
Household density (households per square mile)
Average household size - White
Average household size - Black or African American
Average household size - Asian
Average household size - Hispanic or Latino
Average household size - American Indian and Alaska Native
Average household size - Multirace
Average household size - Other Race
Occupied housing units (%)
Vacant housing units (%)
Owner occupied housing units (%)
Renter occupied housing units (%)
Vacancy status - For rent (%)
Vacancy status - For sale only (%)
Vacancy status - Rented or sold, not occupied (%)
Vacancy status - For seasonal, recreational, or occasional use (%)
Vacancy status - For migrant workers (%)
Vacancy status - Other vacant (%)
Residents with income below the poverty level (%)
Residents with income below 50% of the poverty level (%)
Children below poverty level (%)
Poor families by family type - Married-couple family (%)
Poor families by family type - Male, no wife present (%)
Poor families by family type - Female, no husband present (%)
Poverty status for native-born residents (%)
Poverty status for foreign-born residents (%)
Poverty among high school graduates not in families (%)
Poverty among people who did not graduate high school not in families (%)
Residents with income below the poverty level (%) - White
Residents with income below the poverty level (%) - Black or African American
Residents with income below the poverty level (%) - Asian
Residents with income below the poverty level (%) - Hispanic or Latino
Residents with income below the poverty level (%) - American Indian and Alaska Native
Residents with income below the poverty level (%) - Multirace
Residents with income below the poverty level (%) - Other Race
Air pollution - Air Quality Index (AQI)
Air pollution - CO
Air pollution - NO2
Air pollution - SO2
Air pollution - Ozone
Air pollution - PM10
Air pollution - PM25
Air pollution - Pb
Crime - Murders per 100,000 population
Crime - Rapes per 100,000 population
Crime - Robberies per 100,000 population
Crime - Assaults per 100,000 population
Crime - Burglaries per 100,000 population
Crime - Thefts per 100,000 population
Crime - Auto thefts per 100,000 population
Crime - Arson per 100,000 population
Crime - City-data.com crime index
Crime - Violent crime index
Crime - Property crime index
Crime - Murders per 100,000 population (5 year average)
Crime - Rapes per 100,000 population (5 year average)
Crime - Robberies per 100,000 population (5 year average)
Crime - Assaults per 100,000 population (5 year average)
Crime - Burglaries per 100,000 population (5 year average)
Crime - Thefts per 100,000 population (5 year average)
Crime - Auto thefts per 100,000 population (5 year average)
Crime - Arson per 100,000 population (5 year average)
Crime - City-data.com crime index (5 year average)
Crime - Violent crime index (5 year average)
Crime - Property crime index (5 year average)
1996 Presidential Elections Results (%) - Democratic Party (Clinton)
1996 Presidential Elections Results (%) - Republican Party (Dole)
1996 Presidential Elections Results (%) - Other
2000 Presidential Elections Results (%) - Democratic Party (Gore)
2000 Presidential Elections Results (%) - Republican Party (Bush)
2000 Presidential Elections Results (%) - Other
2004 Presidential Elections Results (%) - Democratic Party (Kerry)
2004 Presidential Elections Results (%) - Republican Party (Bush)
2004 Presidential Elections Results (%) - Other
2008 Presidential Elections Results (%) - Democratic Party (Obama)
2008 Presidential Elections Results (%) - Republican Party (McCain)
2008 Presidential Elections Results (%) - Other
2012 Presidential Elections Results (%) - Democratic Party (Obama)
2012 Presidential Elections Results (%) - Republican Party (Romney)
2012 Presidential Elections Results (%) - Other
2016 Presidential Elections Results (%) - Democratic Party (Clinton)
2016 Presidential Elections Results (%) - Republican Party (Trump)
2016 Presidential Elections Results (%) - Other
2020 Presidential Elections Results (%) - Democratic Party (Biden)
2020 Presidential Elections Results (%) - Republican Party (Trump)
2020 Presidential Elections Results (%) - Other
Ancestries Reported - Arab (%)
Ancestries Reported - Czech (%)
Ancestries Reported - Danish (%)
Ancestries Reported - Dutch (%)
Ancestries Reported - English (%)
Ancestries Reported - French (%)
Ancestries Reported - French Canadian (%)
Ancestries Reported - German (%)
Ancestries Reported - Greek (%)
Ancestries Reported - Hungarian (%)
Ancestries Reported - Irish (%)
Ancestries Reported - Italian (%)
Ancestries Reported - Lithuanian (%)
Ancestries Reported - Norwegian (%)
Ancestries Reported - Polish (%)
Ancestries Reported - Portuguese (%)
Ancestries Reported - Russian (%)
Ancestries Reported - Scotch-Irish (%)
Ancestries Reported - Scottish (%)
Ancestries Reported - Slovak (%)
Ancestries Reported - Subsaharan African (%)
Ancestries Reported - Swedish (%)
Ancestries Reported - Swiss (%)
Ancestries Reported - Ukrainian (%)
Ancestries Reported - United States (%)
Ancestries Reported - Welsh (%)
Ancestries Reported - West Indian (%)
Ancestries Reported - Other (%)
Educational Attainment - No schooling completed (%)
Educational Attainment - Less than high school (%)
Educational Attainment - High school or equivalent (%)
Educational Attainment - Less than 1 year of college (%)
Educational Attainment - 1 or more years of college (%)
Educational Attainment - Associate degree (%)
Educational Attainment - Bachelor's degree (%)
Educational Attainment - Master's degree (%)
Educational Attainment - Professional school degree (%)
Educational Attainment - Doctorate degree (%)
School Enrollment - Nursery, preschool (%)
School Enrollment - Kindergarten (%)
School Enrollment - Grade 1 to 4 (%)
School Enrollment - Grade 5 to 8 (%)
School Enrollment - Grade 9 to 12 (%)
School Enrollment - College undergrad (%)
School Enrollment - Graduate or professional (%)
School Enrollment - Not enrolled in school (%)
School enrollment - Public schools (%)
School enrollment - Private schools (%)
School enrollment - Not enrolled (%)
Median number of rooms in houses and condos
Median number of rooms in apartments
Housing units lacking complete plumbing facilities (%)
Housing units lacking complete kitchen facilities (%)
Density of houses
Urban houses (%)
Rural houses (%)
Households with people 60 years and over (%)
Households with people 65 years and over (%)
Households with people 75 years and over (%)
Households with one or more nonrelatives (%)
Households with no nonrelatives (%)
Population in households (%)
Family households (%)
Nonfamily households (%)
Population in families (%)
Family households with own children (%)
Median number of bedrooms in owner occupied houses
Mean number of bedrooms in owner occupied houses
Median number of bedrooms in renter occupied houses
Mean number of bedrooms in renter occupied houses
Median number of vehichles in owner occupied houses
Mean number of vehichles in owner occupied houses
Median number of vehichles in renter occupied houses
Mean number of vehichles in renter occupied houses
Mortgage status - with mortgage (%)
Mortgage status - with second mortgage (%)
Mortgage status - with home equity loan (%)
Mortgage status - with both second mortgage and home equity loan (%)
Mortgage status - without a mortgage (%)
Average family size
Average family size - White
Average family size - Black or African American
Average family size - Asian
Average family size - Hispanic or Latino
Average family size - American Indian and Alaska Native
Average family size - Multirace
Average family size - Other Race
Geographical mobility - Same house 1 year ago (%)
Geographical mobility - Moved within same county (%)
Geographical mobility - Moved from different county within same state (%)
Geographical mobility - Moved from different state (%)
Geographical mobility - Moved from abroad (%)
Place of birth - Born in state of residence (%)
Place of birth - Born in other state (%)
Place of birth - Native, outside of US (%)
Place of birth - Foreign born (%)
Housing units in structures - 1, detached (%)
Housing units in structures - 1, attached (%)
Housing units in structures - 2 (%)
Housing units in structures - 3 or 4 (%)
Housing units in structures - 5 to 9 (%)
Housing units in structures - 10 to 19 (%)
Housing units in structures - 20 to 49 (%)
Housing units in structures - 50 or more (%)
Housing units in structures - Mobile home (%)
Housing units in structures - Boat, RV, van, etc. (%)
House/condo owner moved in on average (years ago)
Renter moved in on average (years ago)
Year householder moved into unit - Moved in 1999 to March 2000 (%)
Year householder moved into unit - Moved in 1995 to 1998 (%)
Year householder moved into unit - Moved in 1990 to 1994 (%)
Year householder moved into unit - Moved in 1980 to 1989 (%)
Year householder moved into unit - Moved in 1970 to 1979 (%)
Year householder moved into unit - Moved in 1969 or earlier (%)
Means of transportation to work - Drove car alone (%)
Means of transportation to work - Carpooled (%)
Means of transportation to work - Public transportation (%)
Means of transportation to work - Bus or trolley bus (%)
Means of transportation to work - Streetcar or trolley car (%)
Means of transportation to work - Subway or elevated (%)
Means of transportation to work - Railroad (%)
Means of transportation to work - Ferryboat (%)
Means of transportation to work - Taxicab (%)
Means of transportation to work - Motorcycle (%)
Means of transportation to work - Bicycle (%)
Means of transportation to work - Walked (%)
Means of transportation to work - Other means (%)
Working at home (%)
Industry diversity
Most Common Industries - Agriculture, forestry, fishing and hunting, and mining (%)
Most Common Industries - Agriculture, forestry, fishing and hunting (%)
Most Common Industries - Mining, quarrying, and oil and gas extraction (%)
Most Common Industries - Construction (%)
Most Common Industries - Manufacturing (%)
Most Common Industries - Wholesale trade (%)
Most Common Industries - Retail trade (%)
Most Common Industries - Transportation and warehousing, and utilities (%)
Most Common Industries - Transportation and warehousing (%)
Most Common Industries - Utilities (%)
Most Common Industries - Information (%)
Most Common Industries - Finance and insurance, and real estate and rental and leasing (%)
Most Common Industries - Finance and insurance (%)
Most Common Industries - Real estate and rental and leasing (%)
Most Common Industries - Professional, scientific, and management, and administrative and waste management services (%)
Most Common Industries - Professional, scientific, and technical services (%)
Most Common Industries - Management of companies and enterprises (%)
Most Common Industries - Administrative and support and waste management services (%)
Most Common Industries - Educational services, and health care and social assistance (%)
Most Common Industries - Educational services (%)
Most Common Industries - Health care and social assistance (%)
Most Common Industries - Arts, entertainment, and recreation, and accommodation and food services (%)
Most Common Industries - Arts, entertainment, and recreation (%)
Most Common Industries - Accommodation and food services (%)
Most Common Industries - Other services, except public administration (%)
Most Common Industries - Public administration (%)
Occupation diversity
Most Common Occupations - Management, business, science, and arts occupations (%)
Most Common Occupations - Management, business, and financial occupations (%)
Most Common Occupations - Management occupations (%)
Most Common Occupations - Business and financial operations occupations (%)
Most Common Occupations - Computer, engineering, and science occupations (%)
Most Common Occupations - Computer and mathematical occupations (%)
Most Common Occupations - Architecture and engineering occupations (%)
Most Common Occupations - Life, physical, and social science occupations (%)
Most Common Occupations - Education, legal, community service, arts, and media occupations (%)
Most Common Occupations - Community and social service occupations (%)
Most Common Occupations - Legal occupations (%)
Most Common Occupations - Education, training, and library occupations (%)
Most Common Occupations - Arts, design, entertainment, sports, and media occupations (%)
Most Common Occupations - Healthcare practitioners and technical occupations (%)
Most Common Occupations - Health diagnosing and treating practitioners and other technical occupations (%)
Most Common Occupations - Health technologists and technicians (%)
Most Common Occupations - Service occupations (%)
Most Common Occupations - Healthcare support occupations (%)
Most Common Occupations - Protective service occupations (%)
Most Common Occupations - Fire fighting and prevention, and other protective service workers including supervisors (%)
Most Common Occupations - Law enforcement workers including supervisors (%)
Most Common Occupations - Food preparation and serving related occupations (%)
Most Common Occupations - Building and grounds cleaning and maintenance occupations (%)
Most Common Occupations - Personal care and service occupations (%)
Most Common Occupations - Sales and office occupations (%)
Most Common Occupations - Sales and related occupations (%)
Most Common Occupations - Office and administrative support occupations (%)
Most Common Occupations - Natural resources, construction, and maintenance occupations (%)
Most Common Occupations - Farming, fishing, and forestry occupations (%)
Most Common Occupations - Construction and extraction occupations (%)
Most Common Occupations - Installation, maintenance, and repair occupations (%)
Most Common Occupations - Production, transportation, and material moving occupations (%)
Most Common Occupations - Production occupations (%)
Most Common Occupations - Transportation occupations (%)
Most Common Occupations - Material moving occupations (%)
People in Group quarters - Institutionalized population (%)
People in Group quarters - Correctional institutions (%)
People in Group quarters - Federal prisons and detention centers (%)
People in Group quarters - Halfway houses (%)
People in Group quarters - Local jails and other confinement facilities (including police lockups) (%)
People in Group quarters - Military disciplinary barracks (%)
People in Group quarters - State prisons (%)
People in Group quarters - Other types of correctional institutions (%)
People in Group quarters - Nursing homes (%)
People in Group quarters - Hospitals/wards, hospices, and schools for the handicapped (%)
People in Group quarters - Hospitals/wards and hospices for chronically ill (%)
People in Group quarters - Hospices or homes for chronically ill (%)
People in Group quarters - Military hospitals or wards for chronically ill (%)
People in Group quarters - Other hospitals or wards for chronically ill (%)
People in Group quarters - Hospitals or wards for drug/alcohol abuse (%)
People in Group quarters - Mental (Psychiatric) hospitals or wards (%)
People in Group quarters - Schools, hospitals, or wards for the mentally retarded (%)
People in Group quarters - Schools, hospitals, or wards for the physically handicapped (%)
People in Group quarters - Institutions for the deaf (%)
People in Group quarters - Institutions for the blind (%)
People in Group quarters - Orthopedic wards and institutions for the physically handicapped (%)
People in Group quarters - Wards in general hospitals for patients who have no usual home elsewhere (%)
People in Group quarters - Wards in military hospitals for patients who have no usual home elsewhere (%)
People in Group quarters - Juvenile institutions (%)
People in Group quarters - Long-term care (%)
People in Group quarters - Homes for abused, dependent, and neglected children (%)
People in Group quarters - Residential treatment centers for emotionally disturbed children (%)
People in Group quarters - Training schools for juvenile delinquents (%)
People in Group quarters - Short-term care, detention or diagnostic centers for delinquent children (%)
People in Group quarters - Type of juvenile institution unknown (%)
People in Group quarters - Noninstitutionalized population (%)
People in Group quarters - College dormitories (includes college quarters off campus) (%)
People in Group quarters - Military quarters (%)
People in Group quarters - On base (%)
People in Group quarters - Barracks, unaccompanied personnel housing (UPH), (Enlisted/Officer), ;and similar group living quarters for military personnel (%)
People in Group quarters - Transient quarters for temporary residents (%)
People in Group quarters - Military ships (%)
People in Group quarters - Group homes (%)
People in Group quarters - Homes or halfway houses for drug/alcohol abuse (%)
People in Group quarters - Homes for the mentally ill (%)
People in Group quarters - Homes for the mentally retarded (%)
People in Group quarters - Homes for the physically handicapped (%)
People in Group quarters - Other group homes (%)
People in Group quarters - Religious group quarters (%)
People in Group quarters - Dormitories (%)
People in Group quarters - Agriculture workers' dormitories on farms (%)
People in Group quarters - Job Corps and vocational training facilities (%)
People in Group quarters - Other workers' dormitories (%)
People in Group quarters - Crews of maritime vessels (%)
People in Group quarters - Other nonhousehold living situations (%)
People in Group quarters - Other noninstitutional group quarters (%)
Residents speaking English at home (%)
Residents speaking English at home - Born in the United States (%)
Residents speaking English at home - Native, born elsewhere (%)
Residents speaking English at home - Foreign born (%)
Residents speaking Spanish at home (%)
Residents speaking Spanish at home - Born in the United States (%)
Residents speaking Spanish at home - Native, born elsewhere (%)
Residents speaking Spanish at home - Foreign born (%)
Residents speaking other language at home (%)
Residents speaking other language at home - Born in the United States (%)
Residents speaking other language at home - Native, born elsewhere (%)
Residents speaking other language at home - Foreign born (%)
Class of Workers - Employee of private company (%)
Class of Workers - Self-employed in own incorporated business (%)
Class of Workers - Private not-for-profit wage and salary workers (%)
Class of Workers - Local government workers (%)
Class of Workers - State government workers (%)
Class of Workers - Federal government workers (%)
Class of Workers - Self-employed workers in own not incorporated business and Unpaid family workers (%)
House heating fuel used in houses and condos - Utility gas (%)
House heating fuel used in houses and condos - Bottled, tank, or LP gas (%)
House heating fuel used in houses and condos - Electricity (%)
House heating fuel used in houses and condos - Fuel oil, kerosene, etc. (%)
House heating fuel used in houses and condos - Coal or coke (%)
House heating fuel used in houses and condos - Wood (%)
House heating fuel used in houses and condos - Solar energy (%)
House heating fuel used in houses and condos - Other fuel (%)
House heating fuel used in houses and condos - No fuel used (%)
House heating fuel used in apartments - Utility gas (%)
House heating fuel used in apartments - Bottled, tank, or LP gas (%)
House heating fuel used in apartments - Electricity (%)
House heating fuel used in apartments - Fuel oil, kerosene, etc. (%)
House heating fuel used in apartments - Coal or coke (%)
House heating fuel used in apartments - Wood (%)
House heating fuel used in apartments - Solar energy (%)
House heating fuel used in apartments - Other fuel (%)
House heating fuel used in apartments - No fuel used (%)
Armed forces status - In Armed Forces (%)
Armed forces status - Civilian (%)
Armed forces status - Civilian - Veteran (%)
Armed forces status - Civilian - Nonveteran (%)
Fatal accidents locations in years 2005-2021
Fatal accidents locations in 2005
Fatal accidents locations in 2006
Fatal accidents locations in 2007
Fatal accidents locations in 2008
Fatal accidents locations in 2009
Fatal accidents locations in 2010
Fatal accidents locations in 2011
Fatal accidents locations in 2012
Fatal accidents locations in 2013
Fatal accidents locations in 2014
Fatal accidents locations in 2015
Fatal accidents locations in 2016
Fatal accidents locations in 2017
Fatal accidents locations in 2018
Fatal accidents locations in 2019
Fatal accidents locations in 2020
Fatal accidents locations in 2021
Alcohol use - People drinking some alcohol every month (%)
Alcohol use - People not drinking at all (%)
Alcohol use - Average days/month drinking alcohol
Alcohol use - Average drinks/week
Alcohol use - Average days/year people drink much
Audiometry - Average condition of hearing (%)
Audiometry - People that can hear a whisper from across a quiet room (%)
Audiometry - People that can hear normal voice from across a quiet room (%)
Audiometry - Ears ringing, roaring, buzzing (%)
Audiometry - Had a job exposure to loud noise (%)
Audiometry - Had off-work exposure to loud noise (%)
Blood Pressure & Cholesterol - Has high blood pressure (%)
Blood Pressure & Cholesterol - Checking blood pressure at home (%)
Blood Pressure & Cholesterol - Frequently checking blood cholesterol (%)
Blood Pressure & Cholesterol - Has high cholesterol level (%)
Consumer Behavior - Money monthly spent on food at supermarket/grocery store
Consumer Behavior - Money monthly spent on food at other stores
Consumer Behavior - Money monthly spent on eating out
Consumer Behavior - Money monthly spent on carryout/delivered foods
Consumer Behavior - Income spent on food at supermarket/grocery store (%)
Consumer Behavior - Income spent on food at other stores (%)
Consumer Behavior - Income spent on eating out (%)
Consumer Behavior - Income spent on carryout/delivered foods (%)
Current Health Status - General health condition (%)
Current Health Status - Blood donors (%)
Current Health Status - Has blood ever tested for HIV virus (%)
Current Health Status - Left-handed people (%)
Dermatology - People using sunscreen (%)
Diabetes - Diabetics (%)
Diabetes - Had a blood test for high blood sugar (%)
Diabetes - People taking insulin (%)
Diet Behavior & Nutrition - Diet health (%)
Diet Behavior & Nutrition - Milk product consumption (# of products/month)
Diet Behavior & Nutrition - Meals not home prepared (#/week)
Diet Behavior & Nutrition - Meals from fast food or pizza place (#/week)
Diet Behavior & Nutrition - Ready-to-eat foods (#/month)
Diet Behavior & Nutrition - Frozen meals/pizza (#/month)
Drug Use - People that ever used marijuana or hashish (%)
Drug Use - Ever used hard drugs (%)
Drug Use - Ever used any form of cocaine (%)
Drug Use - Ever used heroin (%)
Drug Use - Ever used methamphetamine (%)
Health Insurance - People covered by health insurance (%)
Kidney Conditions-Urology - Avg. # of times urinating at night
Medical Conditions - People with asthma (%)
Medical Conditions - People with anemia (%)
Medical Conditions - People with psoriasis (%)
Medical Conditions - People with overweight (%)
Medical Conditions - Elderly people having difficulties in thinking or remembering (%)
Medical Conditions - People who ever received blood transfusion (%)
Medical Conditions - People having trouble seeing even with glass/contacts (%)
Medical Conditions - People with arthritis (%)
Medical Conditions - People with gout (%)
Medical Conditions - People with congestive heart failure (%)
Medical Conditions - People with coronary heart disease (%)
Medical Conditions - People with angina pectoris (%)
Medical Conditions - People who ever had heart attack (%)
Medical Conditions - People who ever had stroke (%)
Medical Conditions - People with emphysema (%)
Medical Conditions - People with thyroid problem (%)
Medical Conditions - People with chronic bronchitis (%)
Medical Conditions - People with any liver condition (%)
Medical Conditions - People who ever had cancer or malignancy (%)
Mental Health - People who have little interest in doing things (%)
Mental Health - People feeling down, depressed, or hopeless (%)
Mental Health - People who have trouble sleeping or sleeping too much (%)
Mental Health - People feeling tired or having little energy (%)
Mental Health - People with poor appetite or overeating (%)
Mental Health - People feeling bad about themself (%)
Mental Health - People who have trouble concentrating on things (%)
Mental Health - People moving or speaking slowly or too fast (%)
Mental Health - People having thoughts they would be better off dead (%)
Oral Health - Average years since last visit a dentist
Oral Health - People embarrassed because of mouth (%)
Oral Health - People with gum disease (%)
Oral Health - General health of teeth and gums (%)
Oral Health - Average days a week using dental floss/device
Oral Health - Average days a week using mouthwash for dental problem
Oral Health - Average number of teeth
Pesticide Use - Households using pesticides to control insects (%)
Pesticide Use - Households using pesticides to kill weeds (%)
Physical Activity - People doing vigorous-intensity work activities (%)
Physical Activity - People doing moderate-intensity work activities (%)
Physical Activity - People walking or bicycling (%)
Physical Activity - People doing vigorous-intensity recreational activities (%)
Physical Activity - People doing moderate-intensity recreational activities (%)
Physical Activity - Average hours a day doing sedentary activities
Physical Activity - Average hours a day watching TV or videos
Physical Activity - Average hours a day using computer
Physical Functioning - People having limitations keeping them from working (%)
Physical Functioning - People limited in amount of work they can do (%)
Physical Functioning - People that need special equipment to walk (%)
Physical Functioning - People experiencing confusion/memory problems (%)
Physical Functioning - People requiring special healthcare equipment (%)
Prescription Medications - Average number of prescription medicines taking
Preventive Aspirin Use - Adults 40+ taking low-dose aspirin (%)
Reproductive Health - Vaginal deliveries (%)
Reproductive Health - Cesarean deliveries (%)
Reproductive Health - Deliveries resulted in a live birth (%)
Reproductive Health - Pregnancies resulted in a delivery (%)
Reproductive Health - Women breastfeeding newborns (%)
Reproductive Health - Women that had a hysterectomy (%)
Reproductive Health - Women that had both ovaries removed (%)
Reproductive Health - Women that have ever taken birth control pills (%)
Reproductive Health - Women taking birth control pills (%)
Reproductive Health - Women that have ever used Depo-Provera or injectables (%)
Reproductive Health - Women that have ever used female hormones (%)
Sexual Behavior - People 18+ that ever had sex (vaginal, anal, or oral) (%)
Sexual Behavior - Males 18+ that ever had vaginal sex with a woman (%)
Sexual Behavior - Males 18+ that ever performed oral sex on a woman (%)
Sexual Behavior - Males 18+ that ever had anal sex with a woman (%)
Sexual Behavior - Males 18+ that ever had any sex with a man (%)
Sexual Behavior - Females 18+ that ever had vaginal sex with a man (%)
Sexual Behavior - Females 18+ that ever performed oral sex on a man (%)
Sexual Behavior - Females 18+ that ever had anal sex with a man (%)
Sexual Behavior - Females 18+ that ever had any kind of sex with a woman (%)
Sexual Behavior - Average age people first had sex
Sexual Behavior - Average number of female sex partners in lifetime (males 18+)
Sexual Behavior - Average number of female vaginal sex partners in lifetime (males 18+)
Sexual Behavior - Average age people first performed oral sex on a woman (18+)
Sexual Behavior - Average number of woman performed oral sex on in lifetime (18+)
Sexual Behavior - Average number of male sex partners in lifetime (males 18+)
Sexual Behavior - Average number of male anal sex partners in lifetime (males 18+)
Sexual Behavior - Average age people first performed oral sex on a man (18+)
Sexual Behavior - Average number of male oral sex partners in lifetime (18+)
Sexual Behavior - People using protection when performing oral sex (%)
Sexual Behavior - Average number of times people have vaginal or anal sex a year
Sexual Behavior - People having sex without condom (%)
Sexual Behavior - Average number of male sex partners in lifetime (females 18+)
Sexual Behavior - Average number of male vaginal sex partners in lifetime (females 18+)
Sexual Behavior - Average number of female sex partners in lifetime (females 18+)
Sexual Behavior - Circumcised males 18+ (%)
Sleep Disorders - Average hours sleeping at night
Sleep Disorders - People that has trouble sleeping (%)
Smoking-Cigarette Use - People smoking cigarettes (%)
Taste & Smell - People 40+ having problems with smell (%)
Taste & Smell - People 40+ having problems with taste (%)
Taste & Smell - People 40+ that ever had wisdom teeth removed (%)
Taste & Smell - People 40+ that ever had tonsils teeth removed (%)
Taste & Smell - People 40+ that ever had a loss of consciousness because of a head injury (%)
Taste & Smell - People 40+ that ever had a broken nose or other serious injury to face or skull (%)
Taste & Smell - People 40+ that ever had two or more sinus infections (%)
Weight - Average height (inches)
Weight - Average weight (pounds)
Weight - Average BMI
Weight - People that are obese (%)
Weight - People that ever were obese (%)
Weight - People trying to lose weight (%)
Urban population: 14,985
Rural population: 16,530
Estimated median house/condo value in 2022: $287,388
43062:
$287,388Ohio:
$204,100
According to our research of Ohio and other state lists, there were 23 registered sex offenders living in 43062 zip code as of June 03, 2024 . The ratio of all residents to sex offenders in zip code 43062 is 1,258 to 1.The ratio of registered sex offenders to all residents in this zip code is lower than the state average.
Median resident age: This zip code:
38.6 yearsOhio median age:
39.9 years
Average household size: This zip code:
2.7 peopleOhio:
2.4 people
Averages for the 2020 tax year for zip code 43062, filed in 2021:
Average Adjusted Gross Income (AGI) in 2020: $69,254 (Individual Income Tax Returns) Here:
$69,254State:
$67,288
Salary/wage: $62,585 (reported on 84.3% of returns )Here:
$62,585State:
$55,628
(% of AGI for various income ranges: 1193.0% for AGIs below $25k , 3637.2% for AGIs $25k-50k , 6492.4% for AGIs $50k-75k , 9810.9% for AGIs $75k-100k , 17496.9% for AGIs $100k-200k , 58311.8% for AGIs over 200k ) Taxable interest for individuals: $922 (reported on 24.6% of returns )This zip code:
$922Ohio:
$1,518
(% of AGI for various income ranges: 11.0% for AGIs below $25k , 13.7% for AGIs $25k-50k , 21.2% for AGIs $50k-75k , 31.3% for AGIs $75k-100k , 63.5% for AGIs $100k-200k , 491.8% for AGIs over 200k ) Ordinary dividends: $3,071 (reported on 17.5% of returns )(% of AGI for various income ranges: 15.0% for AGIs below $25k , 26.2% for AGIs $25k-50k , 48.4% for AGIs $50k-75k , 72.7% for AGIs $75k-100k , 133.2% for AGIs $100k-200k , 1694.1% for AGIs over 200k ) Net capital gain/loss in AGI: +$9,895 (reported on 15.1% of returns )Here:
+$9,895State:
+$18,919
(% of AGI for various income ranges: 6.8% for AGIs below $25k , 22.9% for AGIs $25k-50k , 59.0% for AGIs $50k-75k , 83.8% for AGIs $75k-100k , 331.2% for AGIs $100k-200k , 8404.1% for AGIs over 200k ) Profit/loss from business: +$12,063 (reported on 14.4% of returns )Here:
+$12,063State:
+$13,744
(% of AGI for various income ranges: 99.3% for AGIs below $25k , 125.0% for AGIs $25k-50k , 172.0% for AGIs $50k-75k , 258.8% for AGIs $75k-100k , 506.8% for AGIs $100k-200k , 2614.7% for AGIs over 200k ) Taxable individual retirement arrangement distribution: $18,078 (reported on 9.3% of returns )43062:
$18,078Ohio:
$18,876
(% of AGI for various income ranges: 67.1% for AGIs below $25k , 116.3% for AGIs $25k-50k , 207.6% for AGIs $50k-75k , 291.8% for AGIs $75k-100k , 535.9% for AGIs $100k-200k , 1722.4% for AGIs over 200k ) Self-employed (Keogh) retirement plans: $11,300 (reported on 0.2% of returns )43062:
$11,300Ohio:
$24,898
(% of AGI for various income ranges: 23.3% for AGIs $100k-200k ) Total itemized deductions: $25,845 (reported on 8.4% of returns )Here:
$25,845State:
$33,869
(% of AGI for various income ranges: 43.4% for AGIs below $25k , 86.5% for AGIs $25k-50k , 266.6% for AGIs $50k-75k , 447.1% for AGIs $75k-100k , 659.4% for AGIs $100k-200k , 3940.6% for AGIs over 200k ) Charity contributions: $9,060 (reported on 6.0% of returns )(% of AGI for various income ranges: 3.3% for AGIs below $25k , 9.6% for AGIs $25k-50k , 44.2% for AGIs $50k-75k , 77.1% for AGIs $75k-100k , 185.5% for AGIs $100k-200k , 1674.1% for AGIs over 200k ) Taxes paid: $7,792 (reported on 8.3% of returns )(% of AGI for various income ranges: 6.6% for AGIs below $25k , 20.7% for AGIs $25k-50k , 89.9% for AGIs $50k-75k , 153.6% for AGIs $75k-100k , 208.9% for AGIs $100k-200k , 960.6% for AGIs over 200k ) Earned income credit: $2,177 (reported on 11.2% of returns )(% of AGI for various income ranges: 73.0% for AGIs below $25k , 61.9% for AGIs $25k-50k , 1.4% for AGIs $50k-75k ) Percentage of individuals using paid preparers for their 2020 taxes: 93.8%(% for various income ranges: 92.4% for AGIs below $25k , 94.6% for AGIs $25k-50k , 93.7% for AGIs $50k-75k , 93.5% for AGIs $75k-100k , 95.0% for AGIs $100k-200k , 94.0% for AGIs over 200k )
Averages for the 2012 tax year for zip code 43062, filed in 2013:
Average Adjusted Gross Income (AGI) in 2012: $57,410 (Individual Income Tax Returns) Here:
$57,410State:
$54,926
Salary/wage: $51,900 (reported on 85.7% of returns )Here:
$51,900State:
$45,869
(% of AGI for various income ranges: 72.6% for AGIs below $25k , 76.8% for AGIs $25k-50k , 79.1% for AGIs $50k-75k , 82.7% for AGIs $75k-100k , 83.0% for AGIs $100k-200k , 51.8% for AGIs over 200k ) Taxable interest for individuals: $751 (reported on 29.7% of returns )This zip code:
$751Ohio:
$1,297
(% of AGI for various income ranges: 0.8% for AGIs below $25k , 0.4% for AGIs $25k-50k , 0.4% for AGIs $50k-75k , 0.2% for AGIs $75k-100k , 0.3% for AGIs $100k-200k , 0.7% for AGIs over 200k ) Ordinary dividends: $2,915 (reported on 18.0% of returns )(% of AGI for various income ranges: 0.9% for AGIs below $25k , 0.6% for AGIs $25k-50k , 0.5% for AGIs $50k-75k , 0.4% for AGIs $75k-100k , 0.6% for AGIs $100k-200k , 3.9% for AGIs over 200k ) Net capital gain/loss in AGI: +$4,327 (reported on 11.5% of returns )Here:
+$4,327State:
+$11,232
(% of AGI for various income ranges: 0.1% for AGIs $25k-50k , 0.2% for AGIs $50k-75k , 0.2% for AGIs $75k-100k , 0.9% for AGIs $100k-200k , 5.0% for AGIs over 200k ) Profit/loss from business: +$10,593 (reported on 15.2% of returns )Here:
+$10,593State:
+$12,773
(% of AGI for various income ranges: 8.8% for AGIs below $25k , 2.8% for AGIs $25k-50k , 1.9% for AGIs $50k-75k , 1.8% for AGIs $75k-100k , 2.0% for AGIs $100k-200k , 5.0% for AGIs over 200k ) Taxable individual retirement arrangement distribution: $12,715 (reported on 9.3% of returns )43062:
$12,715Ohio:
$14,511
(% of AGI for various income ranges: 3.0% for AGIs below $25k , 2.3% for AGIs $25k-50k , 2.1% for AGIs $50k-75k , 2.2% for AGIs $75k-100k , 1.9% for AGIs $100k-200k , 1.4% for AGIs over 200k ) Self-employment retirement plans: $14,340 (reported on 0.4% of returns )43062:
$14,340Ohio:
$20,257
(% of AGI for various income ranges: 0.3% for AGIs $100k-200k ) Total itemized deductions: $18,685 (21% of AGI, reported on 44.7% of returns )Here:
$18,685State:
$21,278
Here:
20.8% of AGIState:
18.8% of AGI
(% of AGI for various income ranges: 8.8% for AGIs below $25k , 12.2% for AGIs $25k-50k , 15.4% for AGIs $50k-75k , 16.0% for AGIs $75k-100k , 16.4% for AGIs $100k-200k , 12.1% for AGIs over 200k ) Charity contributions: $2,700 (reported on 34.3% of returns )(% of AGI for various income ranges: 0.7% for AGIs below $25k , 1.3% for AGIs $25k-50k , 1.6% for AGIs $50k-75k , 1.5% for AGIs $75k-100k , 2.0% for AGIs $100k-200k , 1.7% for AGIs over 200k ) Taxes paid: $8,291 (reported on 44.7% of returns )(% of AGI for various income ranges: 2.1% for AGIs below $25k , 4.0% for AGIs $25k-50k , 6.1% for AGIs $50k-75k , 7.1% for AGIs $75k-100k , 8.0% for AGIs $100k-200k , 7.6% for AGIs over 200k ) Earned income credit: $2,153 (reported on 13.3% of returns )(% of AGI for various income ranges: 5.6% for AGIs below $25k , 0.9% for AGIs $25k-50k ) Percentage of individuals using paid preparers for their 2012 taxes: 45.0%(% for various income ranges: 40.2% for AGIs below $25k , 44.9% for AGIs $25k-50k , 47.9% for AGIs $50k-75k , 46.3% for AGIs $75k-100k , 47.8% for AGIs $100k-200k , 71.4% for AGIs over 200k )
Averages for the 2004 tax year for zip code 43062, filed in 2005:
Average Adjusted Gross Income (AGI) in 2004: $48,782 (Individual Income Tax Returns) Here:
$48,782State:
$44,480
Salary/wage: $45,117 (reported on 88.5% of returns )Here:
$45,117State:
$39,198
(% of AGI for various income ranges: 94.6% for AGIs below $10k , 73.9% for AGIs $10k-25k , 83.4% for AGIs $25k-50k , 86.7% for AGIs $50k-75k , 88.3% for AGIs $75k-100k , 72.3% for AGIs over 100k ) Taxable interest for individuals: $964 (reported on 44.0% of returns )This zip code:
$964Ohio:
$1,532
(% of AGI for various income ranges: 2.7% for AGIs below $10k , 1.7% for AGIs $10k-25k , 0.8% for AGIs $25k-50k , 0.5% for AGIs $50k-75k , 0.6% for AGIs $75k-100k , 1.3% for AGIs over 100k ) Taxable dividends: $1,310 (reported on 21.6% of returns )(% of AGI for various income ranges: 1.5% for AGIs below $10k , 1.0% for AGIs $10k-25k , 0.5% for AGIs $25k-50k , 0.3% for AGIs $50k-75k , 0.4% for AGIs $75k-100k , 0.9% for AGIs over 100k ) Net capital gain/loss: +$7,407 (reported on 16.3% of returns )Here:
+$7,407State:
+$8,582
(% of AGI for various income ranges: -0.2% for AGIs below $10k , -0.2% for AGIs $10k-25k , 0.3% for AGIs $25k-50k , 0.5% for AGIs $50k-75k , 1.0% for AGIs $75k-100k , 8.0% for AGIs over 100k ) Profit/loss from business: +$9,824 (reported on 15.5% of returns )Here:
+$9,824State:
+$10,813
(% of AGI for various income ranges: 5.0% for AGIs below $10k , 6.5% for AGIs $10k-25k , 3.0% for AGIs $25k-50k , 2.4% for AGIs $50k-75k , 2.7% for AGIs $75k-100k , 3.3% for AGIs over 100k ) IRA payment deduction: $2,653 (reported on 1.8% of returns )(% of AGI for various income ranges: 0.1% for AGIs $10k-25k , 0.1% for AGIs $25k-50k , 0.1% for AGIs $50k-75k , 0.1% for AGIs $75k-100k , 0.1% for AGIs over 100k ) Self-employed pension: $13,190 (reported on 0.5% of returns )Total itemized deductions: $16,649 (23% of AGI, reported on 50.5% of returns )Here:
$16,649State:
$17,503
Here:
23.1% of AGIState:
20.8% of AGI
(% of AGI for various income ranges: 11.6% for AGIs below $10k , 11.0% for AGIs $10k-25k , 15.4% for AGIs $25k-50k , 19.5% for AGIs $50k-75k , 19.6% for AGIs $75k-100k , 16.5% for AGIs over 100k ) Charity contributions deductions: $2,293 (3% of AGI, reported on 41.7% of returns )Here:
3.0% of AGIState:
3.4% of AGI
(% of AGI for various income ranges: 0.6% for AGIs below $10k , 0.9% for AGIs $10k-25k , 1.5% for AGIs $25k-50k , 1.9% for AGIs $50k-75k , 2.1% for AGIs $75k-100k , 2.6% for AGIs over 100k ) Total tax: $6,068 (reported on 82.5% of returns )(% of AGI for various income ranges: 2.8% for AGIs below $10k , 4.8% for AGIs $10k-25k , 7.3% for AGIs $25k-50k , 8.7% for AGIs $50k-75k , 9.9% for AGIs $75k-100k , 16.2% for AGIs over 100k ) Earned income credit: $1,635 (reported on 9.2% of returns )Percentage of individuals using paid preparers for their 2004 taxes: 48.9%(% for various income ranges: 35.0% for AGIs below $10k , 49.6% for AGIs $10k-25k , 53.4% for AGIs $25k-50k , 50.3% for AGIs $50k-75k , 49.1% for AGIs $75k-100k , 53.5% for AGIs over 100k )
Estimated median household income in 2022: This zip code:
$94,213Ohio:
$65,720
Nearest zip codes: 43033 ,
43001 ,
43068 ,
43004 ,
43147 ,
43054 .
Reynoldsburg Zip Code Map
Percentage of family households: This zip code:
56.6%Ohio:
43.3%
Percentage of households with unmarried partners: This zip code:
7.8%Ohio:
44.6%
Likely homosexual households (counted as self-reported same-sex unmarried-partner households)
Lesbian couples: 0.4% of all households Gay men: 0.3% of all households
Household received Food Stamps/SNAP in the past 12 months: 1,064Household did not receive Food Stamps/SNAP in the past 12 months: 10,389
Women who had a birth in the past 12 months: 721 (534 now married , 191 unmarried) Women who did not have a birth in the past 12 months: 6,449 (3,884 now married , 2,560 unmarried)
Housing units in zip code 43062 with a mortgage: 6,803 (768
second mortgage , 727
both second mortgage and home equity loan )
Houses without a mortgage: 174
Median monthly owner costs for units with a mortgage: $1,717
Median monthly owner costs for units without a mortgage: $648
Residents with income below the poverty level in 2022:
This zip code:
4.1%Whole state:
13.4%
Residents with income below 50% of the poverty level in 2022:
This zip code:
2.5%Whole state:
7.0%
Median number of rooms in houses and condos: Median number of rooms in apartments: Notable locations in this zip code not listed on our city pages
Click to draw/clear zip code borders Notable locations in zip code 43062: (A) , Reese Corners (B) , Lynd Fruit Farm (C) , Harrison Township House (D) , Pataskala Town Hall (E) , West Licking Joint Fire District Station 1 Headquarters (F) , West Licking Joint Fire District Station 3 (G) . Display/hide their locations on the map
Churches in zip code 43062 include: (A) , Bethel Baptist Church (B) , First United Presbyterian Church of Pataskala (C) , Jersey Reformed Presbyterian Church (D) , Pataskala United Methodist Church (E) , Summit Station Freewill Baptist Church (F) , Harmony Church (G) , Outville Presbyterian Church (H) . Display/hide their locations on the map
Cemeteries: (1) , Swisher Cemetery (2) , Wickliff Cemetery (3) , Jersey Presbyterian Cemetery (4) , Etna Cemetery (5) , Pataskala Cemetery (6) , Pike Cemetery (7) . Display/hide their locations on the map
Lakes and reservoirs: (A) , Gardner Pond (B) , Christian Center Lake (C) . Display/hide their locations on the map
Streams, rivers, and creeks: (A) , Mile Run (B) . Display/hide their locations on the map
Year house built (houses)
144 2020 or later1,622 2010 to 20193,189 2000 to 20091,963 1990 to 19991,122 1980 to 19891,955 1970 to 1979676 1960 to 1969500 1950 to 1959165 1940 to 1949854 1939 or earlier
Zip code 43062 household income distribution in 2022 171 Less than $10,000276 $10,000 to $14,999129 $15,000 to $19,999150 $20,000 to $24,999143 $25,000 to $29,999401 $30,000 to $34,999455 $35,000 to $39,999255 $40,000 to $44,999277 $45,000 to $49,999902 $50,000 to $59,999982 $60,000 to $74,9991,812 $75,000 to $99,9991,904 $100,000 to $124,9991,341 $125,000 to $149,9991,237 $150,000 to $199,999958 $200,000 or moreEstimate of home value of owner-occupied houses/condos in 2022 in zip code 43062 186 Less than $10,00028 $10,000 to $14,99930 $15,000 to $19,99982 $20,000 to $24,999120 $25,000 to $29,99911 $35,000 to $39,99947 $40,000 to $49,9996 $50,000 to $59,99914 $60,000 to $69,99916 $70,000 to $79,99985 $80,000 to $89,99946 $90,000 to $99,999205 $100,000 to $124,999235 $125,000 to $149,999376 $150,000 to $174,999603 $175,000 to $199,9992,158 $200,000 to $249,9991,594 $250,000 to $299,9992,783 $300,000 to $399,999930 $400,000 to $499,999271 $500,000 to $749,99982 $750,000 to $999,999122 $1,000,000 to $1,499,99967 $2,000,000 or moreRent paid by renters in 2022 in zip code 43062 19 Less than $10054 $100 to $149122 $200 to $2499 $250 to $29950 $400 to $4495 $450 to $49944 $500 to $54963 $550 to $59940 $600 to $64922 $650 to $69925 $700 to $749109 $750 to $799138 $800 to $899223 $900 to $999530 $1,000 to $1,249156 $1,250 to $1,499461 $1,500 to $1,9999 $2,000 to $2,49914 $3,500 or more64 No cash rent
Median gross rent in 2022: $1,216.
Median price asked for vacant for-sale houses and condos in 2022: $261,971.
Estimated median house (or condo) value in 2022 for: White Non-Hispanic householders: $290,778Black or African American householders: $326,808American Indian or Alaska Native householders: $220,839Asian householders: $273,823Two or more races householders: $264,922Hispanic or Latino householders: $180,147Estimated median house or condo value in 2022: $287,388
43062:
$287,388Ohio:
$204,100
Lower value quartile - upper value quartile: $217,621 - $392,311
Mean price in 2022: Detached houses: $293,400Here:
$293,400State:
$254,366
Townhouses or other attached units: $254,178Here:
$254,178State:
$225,733
In 2-unit structures: $216,964Here:
$216,964State:
$144,384
In 3-to-4-unit structures: $240,769Here:
$240,769State:
$203,002
In 5-or-more-unit structures: $1,572,087Here:
$1,572,087State:
$211,593
Mobile homes: $57,537Here:
$57,537State:
$62,719
Housing units in structures:
One, detached: 9,392One, attached: 365Two: 2033 or 4: 6305 to 9: 42710 to 19: 35250 or more: 53Mobile homes: 565Unemployment : 2.1%
Means of transportation to work in zip code 43062 72.2% 11,426 Drove a car alone8.6% 1,362 Carpooled0.1% 22 Railroad0.0% 3 Bicycle1.0% 152 Walked0.6% 98 Other means19.1% 3,026 Worked at homeTravel time to work (commute) in zip code 43062 549 Less than 5 minutes911 5 to 9 minutes1,092 10 to 14 minutes1,415 15 to 19 minutes1,461 20 to 24 minutes1,129 25 to 29 minutes2,304 30 to 34 minutes963 35 to 39 minutes871 40 to 44 minutes1,471 45 to 59 minutes592 60 to 89 minutes287 90 or more minutes
Percentage of zip code residents living and working in this county: 45.3%
Household type by relationship:
Households: 31,516
Male householders: 5,761 (949 living alone ), Female householders: 5,701 (938 living alone )7,443 spouses (7,439 opposite-sex spouses ), 907 unmarried partners , (898 opposite-sex unmarried partners ), 9,619 children (9,239 natural , 120 adopted , 262 stepchildren ), 504 grandchildren , 235 brothers or sisters , 382 parents , 5 foster children , 525 other relatives , 285 non-relatives In group quarters: 138 (-1 institutionalized population )
Size of family households: 3,721 2-persons , 2,115 3-persons , 1,871 4-persons , 877 5-persons , 209 6-persons , 127 7-or-more-persons
Size of nonfamily households: 1,886 1-person , 454 2-persons , 106 3-persons , 17 4-persons
6,539 married couples with children. single-parent households (58 men , 868 women ).
90.3% of residents of 43062 zip code speak English at home. of residents speak Spanish at home (69% very well, 31% well ).of residents speak other Indo-European language at home (59% very well, 30% well, 6% not well, 5% not at all ).of residents speak Asian or Pacific Island language at home (89% very well, 5% well, 5% not at all ).of residents speak other language at home (79% very well, 21% well ).
Foreign born population: 2,351 (7.5%)
(87.6%
of them are naturalized citizens )
This zip code:
7.5%Whole state:
5.0%
60% Bangladesh 18% Kazakhstan 4% Honduras 3% Malaysia 3% Indonesia 2% Nigeria 2% Barbados 23% German 12% English 10% American 7% Irish 3% Italian 2% Sudanese 2% Scottish
Year of entry for the foreign-born population
845 2010 or later 1,159 2000 to 2009 164 1990 to 1999 455 Before 1990
Facilities with environmental interests located in this zip code:
ACE LAB INC (63 E MILL ST in PATASKALA, OH)
STATE MASTER (Ohio general info) - RCRA-OHD986985646, HAZARDOUS WASTE PROGRAM Conditionally Exempt Small Quantity Generators, less than 100 kg/month of hazardous waste (Resource Conservation and Recovery Act (tracking hazardous waste)) - notification Organizations: WILSON PAULINE (CONTACT/OWNER)
, UNKNOWN (CONTACT/OWNER)
AETNA SUNOCO (9702 HAZELTON ETNA RD in PATASKALA, OH)
STATE MASTER (Ohio general info) - RCRA-OHD000676460, HAZARDOUS WASTE PROGRAM Conditionally Exempt Small Quantity Generators, less than 100 kg/month of hazardous waste (Resource Conservation and Recovery Act (tracking hazardous waste)) - notification Organizations: GANG CHARLIE (CONTACT/OWNER)
ASH MACHINE CORP (10795 MORSE RD SW in PATASKALA, OH)
STATE MASTER (Ohio general info) - RCRA-OHR000021824, HAZARDOUS WASTE PROGRAM Small Quantity Generators, between 100 kg and 1000 kg of hazardous waste/month (Resource Conservation and Recovery Act (tracking hazardous waste)) - notification Organizations: LUCIA DODEL (CONTACT/OWNER)
BP OIL CO (12086 E BROAD ST in PATASKALA, OH)
STATE MASTER (Ohio general info) - RCRA-OHD987013547, HAZARDOUS WASTE PROGRAM Conditionally Exempt Small Quantity Generators, less than 100 kg/month of hazardous waste (Resource Conservation and Recovery Act (tracking hazardous waste)) - notification Organizations: BP OIL COMPANY (CONTACT/OWNER)
ALLTEL - HIGHWAY 16 (10295 YORK RD in PATASKALA, OH)
(Integrated Compliance Information System) - ICIS-HQ-2000-6004, FORMAL ENFORCEMENT ACTION
ANDREWS CHEMICAL PRODUCTS CO (BROAD STREET SW 7889 in PATASKALA, OH)
COMPLIANCE ACTIVITY (Tracking inspections of insecticide, fungicide, and rodenticide, and toxic substances)
Housing units lacking complete plumbing facilities: 1.8%
Housing units lacking complete kitchen facilities: 0.7%
71.2% Utility gas 19.9% Electricity 5.3% Bottled, tank, or LP gas 2.4% Fuel oil, kerosene, etc. 0.7% Wood
Population in 1990: 15,470. Population change in the 1990s: +3,998 (+25.8%).
Place of birth for U.S.-born residents:
This state: 22,347Northeast: 1,582Midwest: 1,623South: 2,515West: 829
58% of the 43062 zip code residents lived in the same house 5 years ago.
Out of people who lived in different houses, 35% lived in this county.
Out of people who lived in different counties, 50% lived in Ohio.
87% of the 43062 zip code residents lived in the same house 1 year ago.
Out of people who lived in different houses, 27% moved from this county.
Out of people who lived in different houses, 54% moved from different county within same state.
Out of people who lived in different houses, 19% moved from different state.
Out of people who lived in different houses, 3% moved from abroad.
Private vs. public school enrollment:
Students in private schools in grades 1 to 8 (elementary and middle school): 340
Students in private schools in grades 9 to 12 (high school): 203
Students in private undergraduate colleges: 203
Occupation by median earnings in the past 12 months ($)
89,619 Architecture and engineering occupations 84,644 Legal occupations 81,849 Fire fighting and prevention, and other protective service workers including supervisors 79,993 Management occupations 78,852 Arts, design, entertainment, sports, and media occupations 75,637 Construction and extraction occupations
Companies with federal contracts located in this zip code:
TBR INC (13670 HALLOON LN in PATASKALA, OH; small business) in 4 contracts from 2002 to 2005
$4,935 with Army for Ground Effect Vehicles. Signed on 2003-04-07. Completion date: 2003-09-30.
with Army for Guns, through 30 mm. Signed on 2002-12-17. Completion date: 2003-05-30.
with Army for Miscellaneous Machine Tools. Signed on 2003-05-12. Completion date: 2003-09-15.
, same as above. Signed on 2005-04-19. Completion date: 2003-09-15.
Top industries in this zip code by the number of employees in 2005:
Accommodation and Food Services: Limited-Service Restaurants (50-99 employees: 2 establishments, 20-49 employees: 4 establishments, 10-19 employees: 2 establishments, 5-9 employees: 1 establishment, 1-4 employees: 3 establishments)Construction: Power and Communication Line and Related Structures Construction (100-249: 1, 1-4: 1)Construction: Masonry Contractors (50-99: 1, 20-49: 1, 1-4: 3)Administrative and Support and Waste Management and Remediation Services: Landscaping Services (10-19: 4, 5-9: 1, 1-4: 16)Construction: Plumbing, Heating, and Air-Conditioning Contractors (20-49: 1, 10-19: 2, 5-9: 3, 1-4: 7)Construction: Framing Contractors (50-99: 1, 5-9: 1)Other Services (except Public Administration): Religious Organizations (20-49: 1, 10-19: 1, 5-9: 2, 1-4: 8)
People in group quarters in 2010:
91 people in nursing facilities/skilled-nursing facilities
4 people in workers' group living quarters and job corps centers
People in group quarters in 2000:
77 people in nursing homes
Fatal accident statistics in 2014:
Fatal accident count: 2Vehicles involved in fatal accidents: 4Fatal accidents caused by drunken drivers: 0Fatalities: 2Persons involved in fatal accidents: 9Pedestrians involved in fatal accidents: 1
Fatal accident statistics in 2013:
Fatal accident count: 3Vehicles involved in fatal accidents: 7Fatal accidents caused by drunken drivers: 0Fatalities: 3Persons involved in fatal accidents: 8Pedestrians involved in fatal accidents: 2
Home Mortgage Disclosure Act Aggregated Statistics For Year 2009(Based on 3 full and 8 partial tracts) A) FHA, FSA/RHS & VA B) Conventional C) Refinancings D) Home Improvement Loans E) Loans on Dwellings For 5+ Families F) Non-occupant Loans on G) Loans On Manufactured Number Average Value Number Average Value Number Average Value Number Average Value Number Average Value Number Average Value Number Average Value
LOANS ORIGINATED 393 $147,266 211 $140,889 1,164 $155,233 45 $50,596 1 $100,000 41 $128,991 22 $73,883 APPLICATIONS APPROVED, NOT ACCEPTED 25 $147,137 17 $119,506 116 $152,006 7 $24,929 0 $0 2 $140,940 6 $68,903 APPLICATIONS DENIED 82 $146,265 64 $110,132 406 $170,591 78 $24,757 0 $0 15 $127,789 19 $37,518 APPLICATIONS WITHDRAWN 52 $136,183 23 $113,704 212 $164,896 12 $40,347 0 $0 8 $101,028 0 $0 FILES CLOSED FOR INCOMPLETENESS 5 $138,366 5 $240,942 62 $173,908 3 $124,963 0 $0 0 $0 1 $101,810
Aggregated Statistics For Year 2008(Based on 3 full and 8 partial tracts) A) FHA, FSA/RHS & VA B) Conventional C) Refinancings D) Home Improvement Loans F) Non-occupant Loans on G) Loans On Manufactured Number Average Value Number Average Value Number Average Value Number Average Value Number Average Value Number Average Value
LOANS ORIGINATED 314 $151,662 287 $143,654 609 $151,134 106 $38,712 54 $117,029 25 $80,158 APPLICATIONS APPROVED, NOT ACCEPTED 15 $151,104 35 $146,171 124 $141,495 11 $20,612 10 $112,344 5 $106,490 APPLICATIONS DENIED 56 $143,860 87 $115,720 510 $158,500 137 $47,968 29 $118,836 34 $51,989 APPLICATIONS WITHDRAWN 38 $151,437 40 $150,089 202 $157,564 17 $80,644 7 $147,759 4 $93,672 FILES CLOSED FOR INCOMPLETENESS 3 $161,730 14 $127,839 53 $182,383 9 $52,078 4 $125,460 0 $0
Aggregated Statistics For Year 2007(Based on 3 full and 8 partial tracts) A) FHA, FSA/RHS & VA B) Conventional C) Refinancings D) Home Improvement Loans E) Loans on Dwellings For 5+ Families F) Non-occupant Loans on G) Loans On Manufactured Number Average Value Number Average Value Number Average Value Number Average Value Number Average Value Number Average Value Number Average Value
LOANS ORIGINATED 121 $163,854 698 $138,789 684 $138,588 149 $41,941 0 $0 79 $115,499 39 $58,823 APPLICATIONS APPROVED, NOT ACCEPTED 10 $167,930 80 $118,216 206 $122,326 34 $72,014 0 $0 10 $146,603 13 $66,749 APPLICATIONS DENIED 35 $149,231 198 $121,322 911 $147,957 143 $63,245 1 $146,000 46 $114,678 38 $48,068 APPLICATIONS WITHDRAWN 25 $181,043 62 $124,382 297 $162,901 30 $57,299 0 $0 17 $92,646 3 $91,443 FILES CLOSED FOR INCOMPLETENESS 2 $124,865 22 $126,616 74 $163,763 0 $0 0 $0 1 $194,780 0 $0
Aggregated Statistics For Year 2006(Based on 3 full and 8 partial tracts) A) FHA, FSA/RHS & VA B) Conventional C) Refinancings D) Home Improvement Loans E) Loans on Dwellings For 5+ Families F) Non-occupant Loans on G) Loans On Manufactured Number Average Value Number Average Value Number Average Value Number Average Value Number Average Value Number Average Value Number Average Value
LOANS ORIGINATED 162 $174,867 1,043 $126,572 965 $126,739 165 $50,777 4 $1,190,095 94 $131,289 40 $68,991 APPLICATIONS APPROVED, NOT ACCEPTED 15 $177,255 141 $138,086 204 $123,366 27 $71,969 0 $0 13 $91,111 8 $34,449 APPLICATIONS DENIED 27 $153,260 223 $125,210 947 $136,487 142 $52,484 0 $0 54 $140,705 30 $39,457 APPLICATIONS WITHDRAWN 21 $145,490 110 $131,746 417 $149,077 32 $56,132 0 $0 26 $153,793 8 $95,486 FILES CLOSED FOR INCOMPLETENESS 1 $415,720 32 $157,145 135 $169,364 5 $62,164 0 $0 4 $99,700 1 $10,910
Aggregated Statistics For Year 2005(Based on 3 full and 8 partial tracts) A) FHA, FSA/RHS & VA B) Conventional C) Refinancings D) Home Improvement Loans F) Non-occupant Loans on G) Loans On Manufactured Number Average Value Number Average Value Number Average Value Number Average Value Number Average Value Number Average Value
LOANS ORIGINATED 155 $175,959 1,161 $129,597 1,098 $139,699 166 $54,176 149 $112,018 31 $49,744 APPLICATIONS APPROVED, NOT ACCEPTED 24 $192,788 156 $126,103 255 $134,438 53 $25,001 10 $92,199 12 $53,080 APPLICATIONS DENIED 45 $179,082 244 $116,242 827 $139,758 153 $33,179 35 $96,051 60 $69,048 APPLICATIONS WITHDRAWN 20 $175,490 142 $141,473 470 $154,280 75 $119,408 37 $131,508 11 $72,649 FILES CLOSED FOR INCOMPLETENESS 4 $177,845 49 $116,077 124 $155,660 7 $66,897 6 $129,770 3 $106,897
Aggregated Statistics For Year 2004(Based on 3 full and 8 partial tracts) A) FHA, FSA/RHS & VA B) Conventional C) Refinancings D) Home Improvement Loans E) Loans on Dwellings For 5+ Families F) Non-occupant Loans on G) Loans On Manufactured Number Average Value Number Average Value Number Average Value Number Average Value Number Average Value Number Average Value Number Average Value
LOANS ORIGINATED 300 $170,896 1,047 $131,601 1,383 $138,310 166 $40,696 2 $176,280 73 $112,193 20 $103,400 APPLICATIONS APPROVED, NOT ACCEPTED 25 $172,825 128 $130,574 244 $144,523 28 $38,806 0 $0 8 $89,128 11 $53,500 APPLICATIONS DENIED 34 $172,740 161 $118,239 836 $131,726 141 $39,235 0 $0 31 $90,898 34 $56,619 APPLICATIONS WITHDRAWN 41 $161,236 88 $135,524 454 $140,744 42 $53,935 0 $0 14 $83,111 6 $124,588 FILES CLOSED FOR INCOMPLETENESS 4 $176,992 33 $132,515 136 $166,907 10 $54,465 0 $0 4 $78,440 1 $16,370
Aggregated Statistics For Year 2003(Based on 3 full and 8 partial tracts) A) FHA, FSA/RHS & VA B) Conventional C) Refinancings D) Home Improvement Loans F) Non-occupant Loans on Number Average Value Number Average Value Number Average Value Number Average Value Number Average Value
LOANS ORIGINATED 400 $167,492 790 $135,442 3,194 $131,653 118 $34,292 90 $118,455 APPLICATIONS APPROVED, NOT ACCEPTED 21 $151,443 96 $137,271 453 $131,577 43 $33,375 8 $100,236 APPLICATIONS DENIED 27 $148,586 139 $100,713 892 $125,222 106 $30,519 35 $81,421 APPLICATIONS WITHDRAWN 42 $158,038 77 $140,571 493 $134,721 20 $37,337 8 $94,204 FILES CLOSED FOR INCOMPLETENESS 8 $150,592 28 $125,318 172 $151,545 5 $81,854 3 $90,883
Aggregated Statistics For Year 2002(Based on 3 full and 8 partial tracts) A) FHA, FSA/RHS & VA B) Conventional C) Refinancings D) Home Improvement Loans E) Loans on Dwellings For 5+ Families F) Non-occupant Loans on Number Average Value Number Average Value Number Average Value Number Average Value Number Average Value Number Average Value
LOANS ORIGINATED 491 $168,173 666 $138,520 2,134 $125,635 135 $27,814 0 $0 63 $133,810 APPLICATIONS APPROVED, NOT ACCEPTED 16 $173,963 86 $118,538 355 $114,146 32 $46,570 0 $0 12 $105,971 APPLICATIONS DENIED 51 $180,320 118 $105,312 638 $116,097 88 $20,233 1 $51,290 23 $92,004 APPLICATIONS WITHDRAWN 47 $161,888 52 $131,219 389 $128,920 15 $31,797 0 $0 3 $102,283 FILES CLOSED FOR INCOMPLETENESS 2 $124,250 15 $130,108 165 $139,087 4 $16,998 0 $0 5 $121,838
Aggregated Statistics For Year 2001(Based on 3 full and 8 partial tracts) A) FHA, FSA/RHS & VA B) Conventional C) Refinancings D) Home Improvement Loans F) Non-occupant Loans on Number Average Value Number Average Value Number Average Value Number Average Value Number Average Value
LOANS ORIGINATED 516 $159,186 679 $128,385 1,674 $118,845 167 $22,613 63 $111,009 APPLICATIONS APPROVED, NOT ACCEPTED 33 $158,549 79 $89,548 293 $102,481 55 $24,029 6 $91,543 APPLICATIONS DENIED 21 $158,488 175 $60,595 641 $101,285 122 $19,889 28 $63,227 APPLICATIONS WITHDRAWN 55 $161,939 46 $143,531 354 $110,376 30 $30,312 1 $5,460 FILES CLOSED FOR INCOMPLETENESS 5 $170,628 7 $95,254 88 $138,176 2 $13,725 1 $113,000
Aggregated Statistics For Year 2000(Based on 3 full and 8 partial tracts) A) FHA, FSA/RHS & VA B) Conventional C) Refinancings D) Home Improvement Loans E) Loans on Dwellings For 5+ Families F) Non-occupant Loans on Number Average Value Number Average Value Number Average Value Number Average Value Number Average Value Number Average Value
LOANS ORIGINATED 485 $150,422 606 $126,989 542 $92,695 173 $19,267 7 $138,641 37 $116,937 APPLICATIONS APPROVED, NOT ACCEPTED 31 $158,854 84 $72,329 179 $87,537 67 $17,001 0 $0 7 $43,791 APPLICATIONS DENIED 50 $150,317 234 $50,331 392 $92,953 107 $15,614 0 $0 10 $56,630 APPLICATIONS WITHDRAWN 50 $149,774 54 $109,161 164 $88,136 15 $39,423 0 $0 7 $74,151 FILES CLOSED FOR INCOMPLETENESS 2 $119,150 11 $120,114 32 $125,566 3 $47,317 1 $430,000 1 $95,000
Aggregated Statistics For Year 1999(Based on 2 full and 4 partial tracts) A) FHA, FSA/RHS & VA B) Conventional C) Refinancings D) Home Improvement Loans E) Loans on Dwellings For 5+ Families F) Non-occupant Loans on Number Average Value Number Average Value Number Average Value Number Average Value Number Average Value Number Average Value
LOANS ORIGINATED 163 $136,684 387 $114,414 526 $97,825 115 $17,715 0 $0 20 $82,832 APPLICATIONS APPROVED, NOT ACCEPTED 4 $152,655 45 $76,575 118 $91,756 28 $19,530 0 $0 8 $81,762 APPLICATIONS DENIED 15 $134,334 102 $61,115 184 $94,378 81 $13,523 0 $0 8 $47,652 APPLICATIONS WITHDRAWN 24 $141,485 47 $111,007 112 $89,937 17 $50,433 1 $532,840 2 $46,985 FILES CLOSED FOR INCOMPLETENESS 2 $162,675 4 $89,170 34 $86,946 3 $25,990 0 $0 1 $70,720
Private Mortgage Insurance Companies Aggregated Statistics For Year 2009(Based on 3 full and 8 partial tracts) A) Conventional B) Refinancings C) Non-occupant Loans on Number Average Value Number Average Value Number Average Value
LOANS ORIGINATED 44 $154,894 40 $180,839 0 $0 APPLICATIONS APPROVED, NOT ACCEPTED 16 $156,024 15 $147,679 0 $0 APPLICATIONS DENIED 15 $143,854 8 $214,165 1 $179,000 APPLICATIONS WITHDRAWN 4 $131,040 2 $152,160 0 $0 FILES CLOSED FOR INCOMPLETENESS 3 $56,583 0 $0 0 $0
Aggregated Statistics For Year 2008(Based on 3 full and 8 partial tracts) A) Conventional B) Refinancings C) Non-occupant Loans on D) Loans On Manufactured Number Average Value Number Average Value Number Average Value Number Average Value
LOANS ORIGINATED 103 $161,845 71 $179,257 10 $96,480 0 $0 APPLICATIONS APPROVED, NOT ACCEPTED 48 $164,605 43 $191,800 0 $0 1 $87,000 APPLICATIONS DENIED 14 $193,961 7 $222,583 8 $149,518 0 $0 APPLICATIONS WITHDRAWN 1 $70,380 6 $138,082 1 $77,770 0 $0 FILES CLOSED FOR INCOMPLETENESS 9 $167,031 3 $143,310 6 $132,235 0 $0
Aggregated Statistics For Year 2007(Based on 3 full and 8 partial tracts) A) Conventional B) Refinancings C) Non-occupant Loans on D) Loans On Manufactured Number Average Value Number Average Value Number Average Value Number Average Value
LOANS ORIGINATED 265 $159,993 75 $176,765 8 $131,396 0 $0 APPLICATIONS APPROVED, NOT ACCEPTED 35 $157,887 40 $208,353 1 $57,000 1 $87,000 APPLICATIONS DENIED 5 $84,914 5 $336,278 0 $0 0 $0 APPLICATIONS WITHDRAWN 10 $150,463 17 $199,584 1 $49,100 0 $0 FILES CLOSED FOR INCOMPLETENESS 0 $0 0 $0 0 $0 0 $0
Aggregated Statistics For Year 2006(Based on 3 full and 8 partial tracts) A) Conventional B) Refinancings C) Non-occupant Loans on D) Loans On Manufactured Number Average Value Number Average Value Number Average Value Number Average Value
LOANS ORIGINATED 139 $159,729 37 $190,507 4 $151,435 2 $121,215 APPLICATIONS APPROVED, NOT ACCEPTED 23 $160,465 30 $190,553 3 $105,407 0 $0 APPLICATIONS DENIED 3 $207,213 4 $257,235 1 $212,000 0 $0 APPLICATIONS WITHDRAWN 4 $236,020 15 $219,328 1 $846,990 0 $0 FILES CLOSED FOR INCOMPLETENESS 2 $96,500 5 $134,170 3 $127,217 0 $0
Aggregated Statistics For Year 2005(Based on 3 full and 8 partial tracts) A) Conventional B) Refinancings C) Non-occupant Loans on D) Loans On Manufactured Number Average Value Number Average Value Number Average Value Number Average Value
LOANS ORIGINATED 155 $166,401 98 $174,316 9 $141,347 3 $106,380 APPLICATIONS APPROVED, NOT ACCEPTED 27 $170,243 38 $189,818 7 $139,130 0 $0 APPLICATIONS DENIED 0 $0 2 $151,795 0 $0 0 $0 APPLICATIONS WITHDRAWN 9 $171,997 7 $177,990 1 $128,000 0 $0 FILES CLOSED FOR INCOMPLETENESS 1 $171,860 1 $164,020 1 $164,020 0 $0
Aggregated Statistics For Year 2004(Based on 3 full and 8 partial tracts) A) Conventional B) Refinancings C) Non-occupant Loans on D) Loans On Manufactured Number Average Value Number Average Value Number Average Value Number Average Value
LOANS ORIGINATED 133 $160,653 166 $167,230 10 $155,010 4 $100,760 APPLICATIONS APPROVED, NOT ACCEPTED 26 $159,822 76 $159,342 0 $0 0 $0 APPLICATIONS DENIED 4 $307,398 2 $145,605 0 $0 0 $0 APPLICATIONS WITHDRAWN 11 $146,836 18 $165,946 1 $219,170 0 $0 FILES CLOSED FOR INCOMPLETENESS 1 $104,000 2 $117,200 0 $0 0 $0
Aggregated Statistics For Year 2003(Based on 3 full and 8 partial tracts) A) Conventional B) Refinancings C) Non-occupant Loans on Number Average Value Number Average Value Number Average Value
LOANS ORIGINATED 199 $158,787 397 $159,485 6 $112,780 APPLICATIONS APPROVED, NOT ACCEPTED 35 $163,391 127 $160,496 2 $184,625 APPLICATIONS DENIED 7 $123,197 5 $141,268 0 $0 APPLICATIONS WITHDRAWN 6 $161,508 28 $168,422 3 $145,333 FILES CLOSED FOR INCOMPLETENESS 3 $150,510 1 $97,120 0 $0
Aggregated Statistics For Year 2002(Based on 3 full and 8 partial tracts) A) Conventional B) Refinancings C) Non-occupant Loans on Number Average Value Number Average Value Number Average Value
LOANS ORIGINATED 191 $162,178 340 $158,277 6 $131,117 APPLICATIONS APPROVED, NOT ACCEPTED 21 $156,802 80 $156,029 1 $45,250 APPLICATIONS DENIED 0 $0 10 $162,841 3 $124,133 APPLICATIONS WITHDRAWN 11 $155,145 40 $165,385 2 $127,170 FILES CLOSED FOR INCOMPLETENESS 0 $0 5 $148,736 0 $0
Aggregated Statistics For Year 2001(Based on 3 full and 8 partial tracts) A) Conventional B) Refinancings C) Non-occupant Loans on Number Average Value Number Average Value Number Average Value
LOANS ORIGINATED 169 $156,269 252 $148,950 7 $115,869 APPLICATIONS APPROVED, NOT ACCEPTED 30 $160,474 58 $147,366 0 $0 APPLICATIONS DENIED 4 $147,450 13 $149,208 4 $172,202 APPLICATIONS WITHDRAWN 2 $127,160 7 $149,633 1 $73,660 FILES CLOSED FOR INCOMPLETENESS 0 $0 0 $0 0 $0
Aggregated Statistics For Year 2000(Based on 3 full and 8 partial tracts) A) Conventional B) Refinancings C) Non-occupant Loans on Number Average Value Number Average Value Number Average Value
LOANS ORIGINATED 184 $148,838 48 $125,212 2 $182,250 APPLICATIONS APPROVED, NOT ACCEPTED 32 $149,402 26 $125,423 0 $0 APPLICATIONS DENIED 8 $181,885 4 $126,970 0 $0 APPLICATIONS WITHDRAWN 7 $173,510 5 $156,876 0 $0 FILES CLOSED FOR INCOMPLETENESS 6 $144,075 2 $175,050 0 $0
Aggregated Statistics For Year 1999(Based on 2 full and 4 partial tracts) A) Conventional B) Refinancings C) Non-occupant Loans on Number Average Value Number Average Value Number Average Value
LOANS ORIGINATED 130 $143,066 66 $131,050 2 $89,630 APPLICATIONS APPROVED, NOT ACCEPTED 15 $124,575 10 $129,796 2 $66,950 APPLICATIONS DENIED 6 $131,375 5 $144,588 0 $0 APPLICATIONS WITHDRAWN 3 $115,857 3 $169,620 0 $0 FILES CLOSED FOR INCOMPLETENESS 1 $137,570 1 $151,130 0 $0
2002 - 2018 National Fire Incident Reporting System (NFIRS) incidents See full 2006 National Fire Incident Reporting System statistics for zip code 43062, Ohio
Most common first names in zip code 43062 among deceased individuals Name Count Lived (average)
Mary 81 79.5 years James 75 72.0 years John 71 74.7 years Robert 71 72.4 years William 62 75.1 years Charles 59 73.5 years Ruth 40 80.0 years Helen 38 75.7 years Joseph 32 71.6 years George 32 76.2 years
Most common last names in zip code 43062 among deceased individuals Last name Count Lived (average)
Smith 39 77.3 years Johnson 26 75.1 years Moore 19 76.9 years Miller 16 74.6 years Jones 15 77.5 years Davis 15 75.7 years Thompson 14 72.2 years Williams 14 73.6 years Fravel 13 80.9 years Brown 13 77.2 years
Businesses in zip code 43062
Name Count Name Count
Advance Auto Parts 1 MasterBrand Cabinets 1 CVS 1 McDonald's 2 Chevrolet 1 Sprint Nextel 1 Curves 1 Starbucks 1 Dairy Queen 1 Subway 2 Domino's Pizza 1 Taco Bell 1 FedEx 2 Tim Hortons 1 H&R Block 1 True Value 1 KFC 1 U-Haul 2 Kroger 1 UPS 3 Long John Silver's 1 Wendy's 1
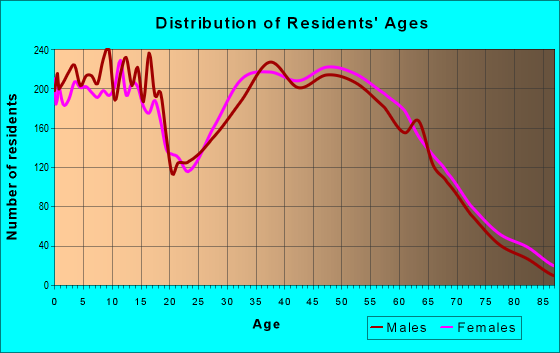
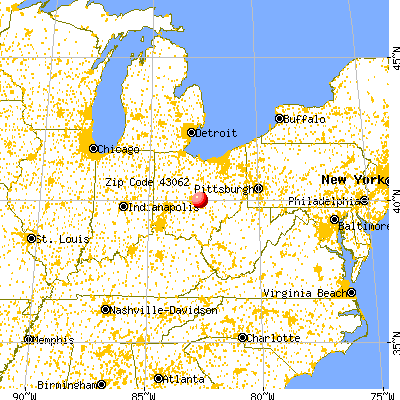


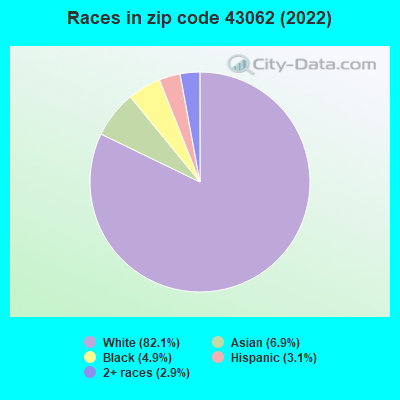


 Nearest zip codes: 43033, 43001, 43068, 43004, 43147, 43054.
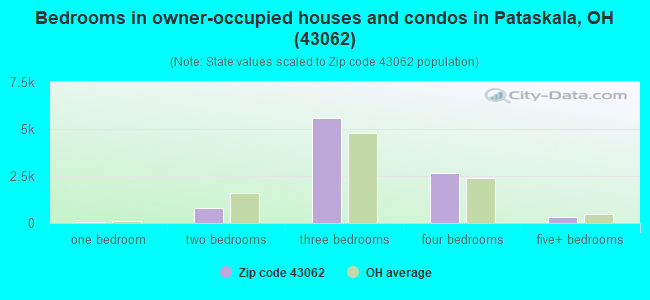
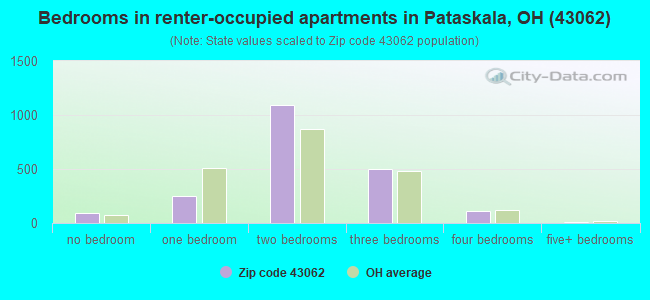
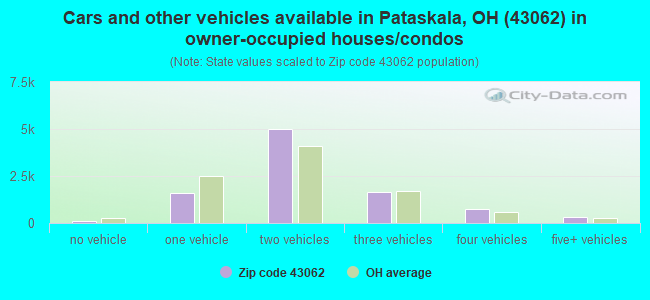
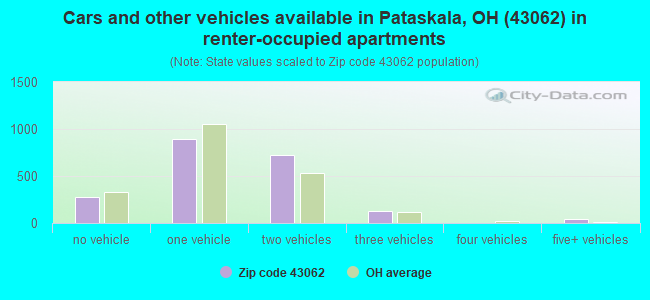


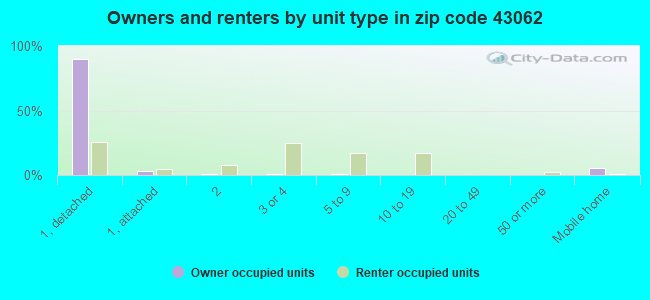
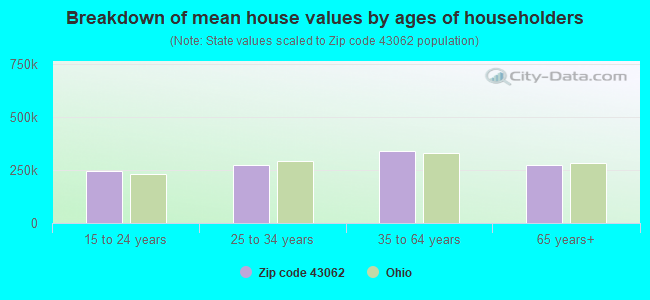


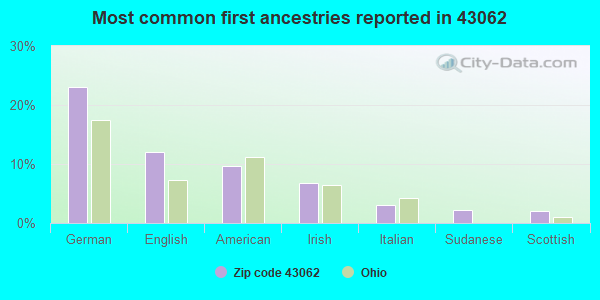
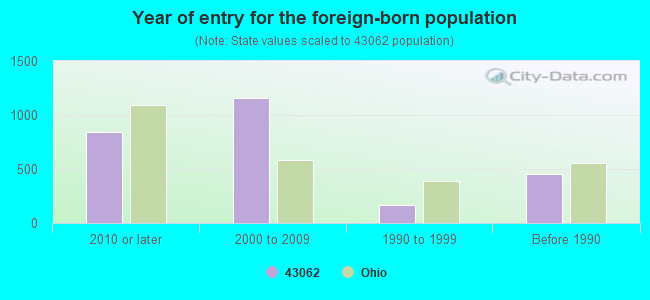

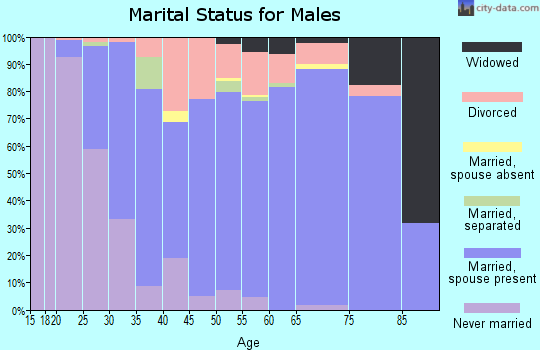

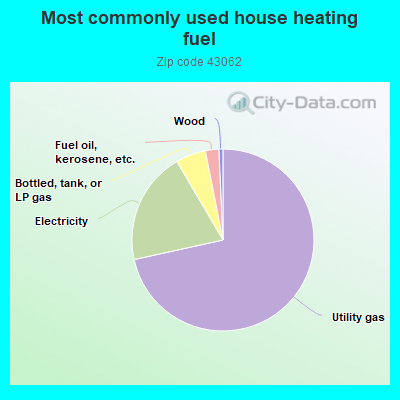
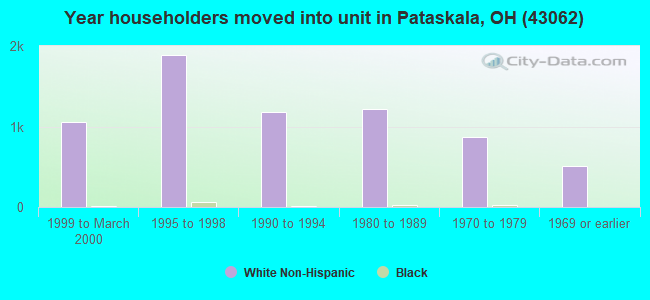


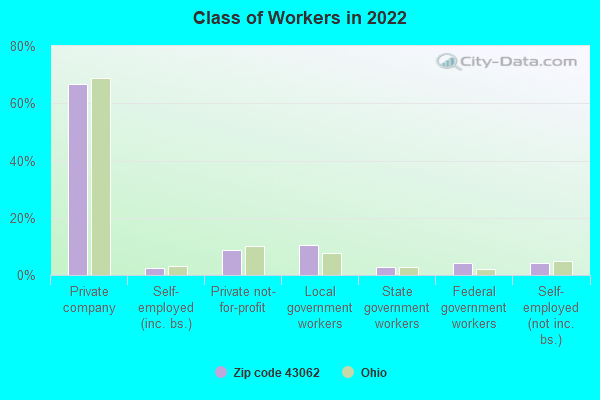
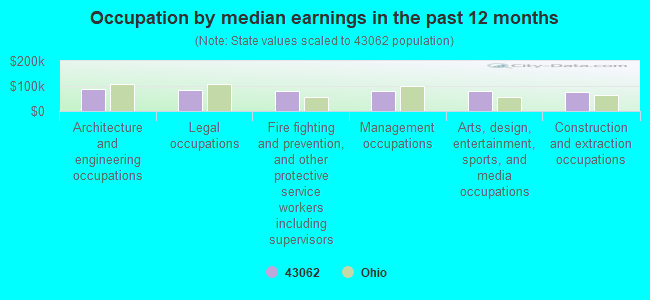
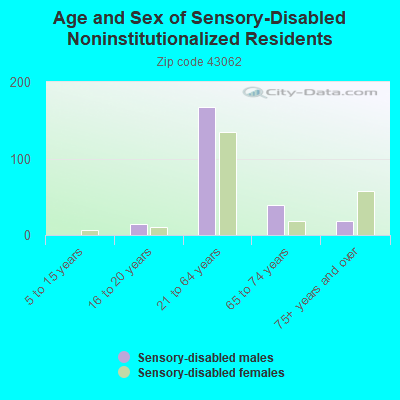
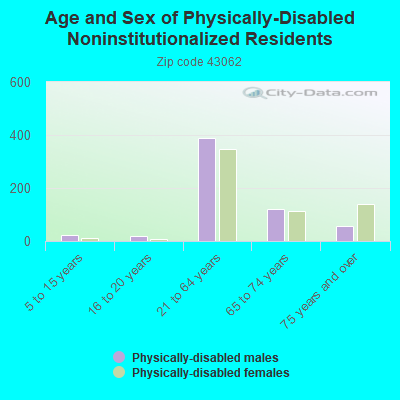
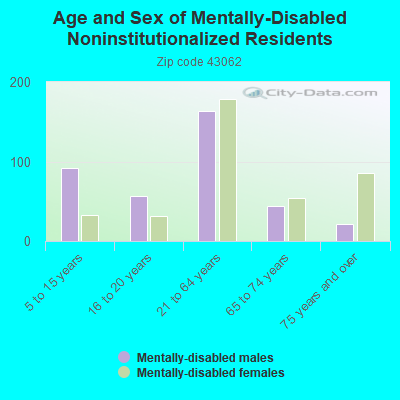
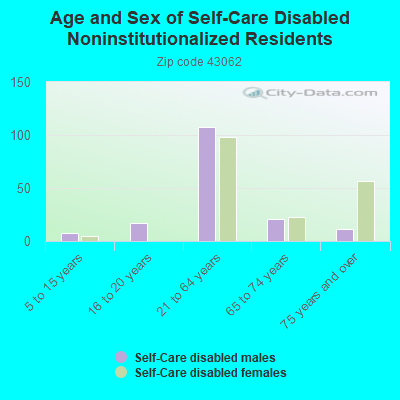
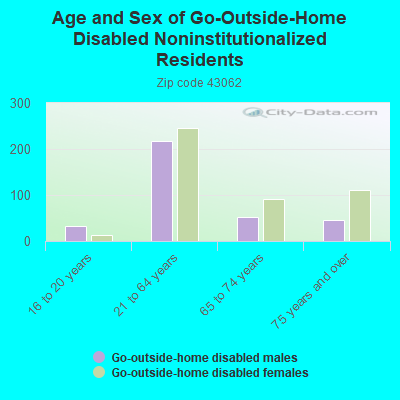
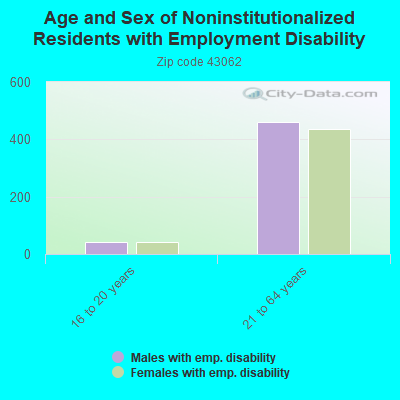
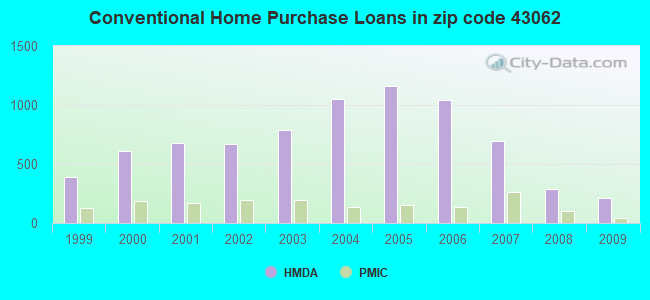
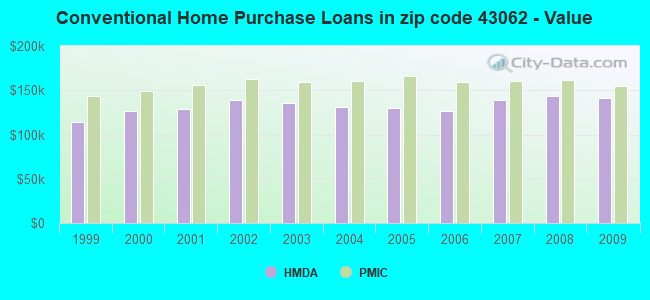
 According to the data from the years 2002 - 2018 the average number of fire incidents per year is 120. The highest number of fire incidents - 190 took place in 2009, and the least - 83 in 2015. The data has a rising trend.
 When looking into fire subcategories, the most reports belonged to: Structure Fires (46.9%), and Outside Fires (33.6%).