Estimated zip code population in 2022: 5,245 Zip code population in 2010: 5,528 Zip code population in 2000: 5,285
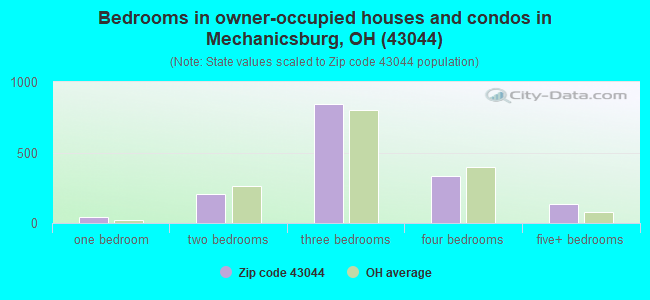
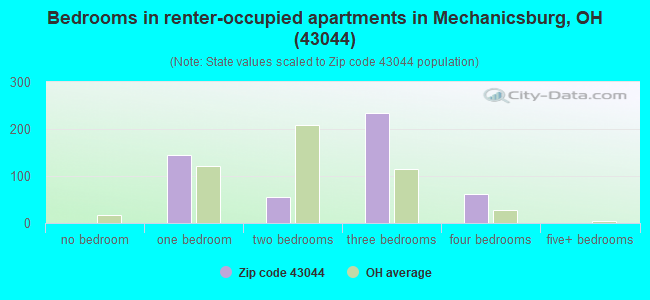
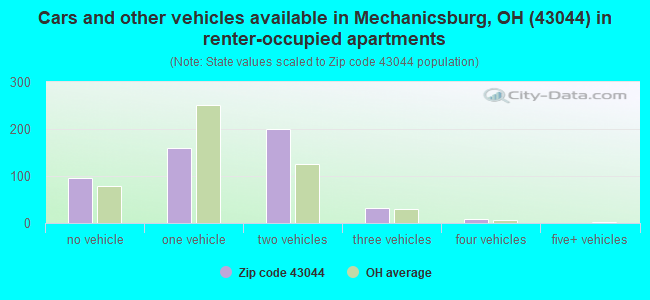
Houses and condos: 2,203 Renter-occupied apartments: 499
% of renters here:
24%
State:
33%
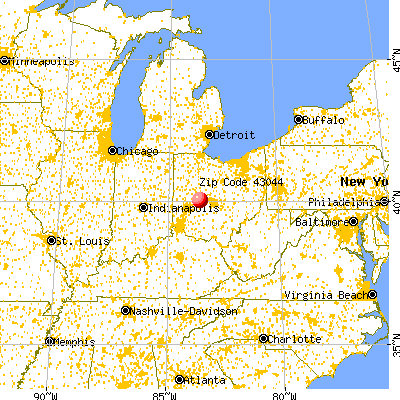
March 2022 cost of living index in zip code 43044: 83.5 (less than average, U.S. average is 100)
Land area: 78.5 sq. mi. Water area: 0.0 sq. mi.
Population density: 67 people per square mile
(very low).
OSM Map
General Map
Google Map
MSN Map
OSM Map
General Map
Google Map
MSN Map
OSM Map
General Map
Google Map
MSN Map
OSM Map
General Map
Google Map
MSN Map
Please wait while loading the map...
Real estate property taxes paid for housing units in 2022:
This zip code:
1.1% ($2,366)
Ohio:
1.3% ($2,639)
Median real estate property taxes paid for housing units with mortgages in 2022: $2,481 (1.0%) Median real estate property taxes paid for housing units with no mortgage in 2022: $2,198 (1.3%)
Estimated median house/condo value in 2022: $218,464
43044:
$218,464
Ohio:
$204,100
According to our research of Ohio and other state lists, there were 11 registered sex offenders living in 43044 zip code as of May 23, 2024. The ratio of all residents to sex offenders in zip code 43044 is 471 to 1. The ratio of registered sex offenders to all residents in this zip code is near the state average.
Median resident age:
This zip code:
41.6 years
Ohio median age:
39.9 years
Average household size:
This zip code:
2.5 people
Ohio:
2.4 people
Averages for the 2020 tax year for zip code 43044, filed in 2021:
Average Adjusted Gross Income (AGI) in 2020: $57,668 (Individual Income Tax Returns)
Here:
$57,668
State:
$67,288
Salary/wage: $51,275 (reported on 82.5% of returns)
Here:
$51,275
State:
$55,628
(% of AGI for various income ranges: 1075.9% for AGIs below $25k, 3675.0% for AGIs $25k-50k, 6096.7% for AGIs $50k-75k, 9171.6% for AGIs $75k-100k, 14504.6% for AGIs $100k-200k)
Taxable interest for individuals: $632 (reported on 25.7% of returns)
This zip code:
$632
Ohio:
$1,518
(% of AGI for various income ranges: 13.9% for AGIs below $25k, 12.5% for AGIs $25k-50k, 21.3% for AGIs $50k-75k, 12.1% for AGIs $75k-100k, 45.8% for AGIs $100k-200k)
Ordinary dividends: $3,516 (reported on 12.5% of returns)
Here:
$3,516
State:
$7,167
(% of AGI for various income ranges: 13.1% for AGIs below $25k, 12.7% for AGIs $25k-50k, 25.1% for AGIs $50k-75k, 52.6% for AGIs $75k-100k, 133.8% for AGIs $100k-200k)
Net capital gain/loss in AGI: +$6,793 (reported on 10.5% of returns)
Here:
+$6,793
State:
+$18,919
(% of AGI for various income ranges: 18.6% for AGIs below $25k, 20.2% for AGIs $25k-50k, 53.6% for AGIs $50k-75k, 91.6% for AGIs $75k-100k, 203.3% for AGIs $100k-200k)
Profit/loss from business: +$10,262 (reported on 13.2% of returns)
Here:
+$10,262
State:
+$13,744
(% of AGI for various income ranges: 61.6% for AGIs below $25k, 118.0% for AGIs $25k-50k, 251.0% for AGIs $50k-75k, 205.3% for AGIs $75k-100k, 477.1% for AGIs $100k-200k)
Taxable individual retirement arrangement distribution: $16,277 (reported on 8.6% of returns)
43044:
$16,277
Ohio:
$18,876
(% of AGI for various income ranges: 73.7% for AGIs below $25k, 65.2% for AGIs $25k-50k, 175.9% for AGIs $50k-75k, 351.1% for AGIs $75k-100k, 619.6% for AGIs $100k-200k)
Total itemized deductions: $26,011 (reported on 3.5% of returns)
Here:
$26,011
State:
$33,869
(% of AGI for various income ranges: 310.5% for AGIs $50k-75k, 470.8% for AGIs $100k-200k)
Charity contributions: $7,817 (reported on 2.3% of returns)
Here:
$7,817
State:
$14,577
(% of AGI for various income ranges: 45.1% for AGIs $50k-75k, 122.1% for AGIs $100k-200k)
Taxes paid: $7,378 (reported on 3.5% of returns)
43044:
$7,378
State:
$7,681
(% of AGI for various income ranges: 82.3% for AGIs $50k-75k, 142.9% for AGIs $100k-200k)
Earned income credit: $2,110 (reported on 12.1% of returns)
Here:
$2,110
State:
$2,304
(% of AGI for various income ranges: 71.6% for AGIs below $25k, 51.6% for AGIs $25k-50k)
Percentage of individuals using paid preparers for their 2020 taxes: 94.6%
Here:
95%
State:
94%
(% for various income ranges: 93.0% for AGIs below $25k, 94.3% for AGIs $25k-50k, 96.0% for AGIs $50k-75k, 96.2% for AGIs $75k-100k, 94.4% for AGIs $100k-200k, 100.0% for AGIs over 200k)
Averages for the 2012 tax year for zip code 43044, filed in 2013:
Average Adjusted Gross Income (AGI) in 2012: $48,434 (Individual Income Tax Returns)
Here:
$48,434
State:
$54,926
Salary/wage: $43,220 (reported on 85.1% of returns)
Here:
$43,220
State:
$45,869
(% of AGI for various income ranges: 69.8% for AGIs below $25k, 84.0% for AGIs $25k-50k, 83.0% for AGIs $50k-75k, 82.0% for AGIs $75k-100k, 77.0% for AGIs $100k-200k, 35.6% for AGIs over 200k)
Taxable interest for individuals: $687 (reported on 26.0% of returns)
This zip code:
$687
Ohio:
$1,297
(% of AGI for various income ranges: 0.6% for AGIs below $25k, 0.3% for AGIs $25k-50k, 0.2% for AGIs $50k-75k, 0.3% for AGIs $75k-100k, 0.3% for AGIs $100k-200k, 1.0% for AGIs over 200k)
Ordinary dividends: $2,723 (reported on 12.8% of returns)
Here:
$2,723
State:
$5,821
(% of AGI for various income ranges: 1.0% for AGIs below $25k, 0.3% for AGIs $25k-50k, 0.3% for AGIs $50k-75k, 0.4% for AGIs $75k-100k, 2.3% for AGIs $100k-200k)
Net capital gain/loss in AGI: +$3,968 (reported on 7.9% of returns)
Here:
+$3,968
State:
+$11,232
(% of AGI for various income ranges: 3.3% for AGIs $100k-200k)
Profit/loss from business: +$7,130 (reported on 13.6% of returns)
Here:
+$7,130
State:
+$12,773
(% of AGI for various income ranges: 4.8% for AGIs below $25k, 2.3% for AGIs $25k-50k, 1.9% for AGIs $50k-75k, 0.7% for AGIs $75k-100k, 2.7% for AGIs $100k-200k)
Taxable individual retirement arrangement distribution: $10,563 (reported on 7.9% of returns)
43044:
$10,563
Ohio:
$14,511
(% of AGI for various income ranges: 3.0% for AGIs below $25k, 1.2% for AGIs $25k-50k, 1.1% for AGIs $50k-75k, 1.9% for AGIs $75k-100k, 3.1% for AGIs $100k-200k)
Total itemized deductions: $16,440 (19% of AGI, reported on 30.2% of returns)
Here:
$16,440
State:
$21,278
Here:
19.3% of AGI
State:
18.8% of AGI
(% of AGI for various income ranges: 7.6% for AGIs below $25k, 7.0% for AGIs $25k-50k, 10.5% for AGIs $50k-75k, 11.5% for AGIs $75k-100k, 13.7% for AGIs $100k-200k, 9.8% for AGIs over 200k)
Charity contributions: $2,866 (reported on 19.4% of returns)
Here:
$2,866
State:
$3,943
(% of AGI for various income ranges: 0.4% for AGIs below $25k, 0.6% for AGIs $25k-50k, 0.9% for AGIs $50k-75k, 1.2% for AGIs $75k-100k, 2.0% for AGIs $100k-200k, 1.7% for AGIs over 200k)
Taxes paid: $6,745 (reported on 30.2% of returns)
43044:
$6,745
State:
$9,568
(% of AGI for various income ranges: 1.0% for AGIs below $25k, 2.0% for AGIs $25k-50k, 4.1% for AGIs $50k-75k, 4.9% for AGIs $75k-100k, 6.6% for AGIs $100k-200k, 6.0% for AGIs over 200k)
Earned income credit: $2,132 (reported on 15.7% of returns)
Here:
$2,132
State:
$2,285
(% of AGI for various income ranges: 5.2% for AGIs below $25k, 1.0% for AGIs $25k-50k)
Percentage of individuals using paid preparers for their 2012 taxes: 56.2%
Here:
56%
State:
51%
(% for various income ranges: 48.8% for AGIs below $25k, 57.4% for AGIs $25k-50k, 59.1% for AGIs $50k-75k, 60.9% for AGIs $75k-100k, 66.7% for AGIs $100k-200k, 100.0% for AGIs over 200k)
Averages for the 2004 tax year for zip code 43044, filed in 2005:
Average Adjusted Gross Income (AGI) in 2004: $39,604 (Individual Income Tax Returns)
Here:
$39,604
State:
$44,480
Salary/wage: $37,462 (reported on 86.9% of returns)
Here:
$37,462
State:
$39,198
(% of AGI for various income ranges: 147.6% for AGIs below $10k, 76.4% for AGIs $10k-25k, 84.1% for AGIs $25k-50k, 86.8% for AGIs $50k-75k, 87.2% for AGIs $75k-100k, 65.8% for AGIs over 100k)
Taxable interest for individuals: $899 (reported on 36.4% of returns)
This zip code:
$899
Ohio:
$1,532
(% of AGI for various income ranges: 5.9% for AGIs below $10k, 1.4% for AGIs $10k-25k, 0.6% for AGIs $25k-50k, 0.5% for AGIs $50k-75k, 0.5% for AGIs $75k-100k, 1.5% for AGIs over 100k)
Taxable dividends: $2,279 (reported on 14.7% of returns)
Here:
$2,279
State:
$3,496
(% of AGI for various income ranges: 2.7% for AGIs below $10k, 0.5% for AGIs $10k-25k, 0.3% for AGIs $25k-50k, 0.3% for AGIs $50k-75k, 0.5% for AGIs $75k-100k, 3.1% for AGIs over 100k)
Net capital gain/loss: +$11,148 (reported on 10.2% of returns)
Here:
+$11,148
State:
+$8,582
(% of AGI for various income ranges: -2.2% for AGIs below $10k, 0.1% for AGIs $10k-25k, 0.3% for AGIs $25k-50k, 0.6% for AGIs $50k-75k, 0.6% for AGIs $75k-100k, 15.1% for AGIs over 100k)
Profit/loss from business: +$6,771 (reported on 13.7% of returns)
Here:
+$6,771
State:
+$10,813
(% of AGI for various income ranges: 4.7% for AGIs below $10k, 4.8% for AGIs $10k-25k, 1.7% for AGIs $25k-50k, 1.5% for AGIs $50k-75k, 0.8% for AGIs $75k-100k, 4.6% for AGIs over 100k)
IRA payment deduction: $2,632 (reported on 1.6% of returns)
43044:
$2,632
Ohio:
$2,794
Total itemized deductions: $13,782 (22% of AGI, reported on 32.5% of returns)
Here:
$13,782
State:
$17,503
Here:
21.6% of AGI
State:
20.8% of AGI
(% of AGI for various income ranges: 6.8% for AGIs $10k-25k, 9.2% for AGIs $25k-50k, 13.8% for AGIs $50k-75k, 14.1% for AGIs $75k-100k, 11.7% for AGIs over 100k)
Charity contributions deductions: $1,774 (3% of AGI, reported on 25.0% of returns)
Here:
$1,774
State:
$3,087
Here:
2.6% of AGI
State:
3.4% of AGI
(% of AGI for various income ranges: 0.7% for AGIs $10k-25k, 0.8% for AGIs $25k-50k, 1.2% for AGIs $50k-75k, 1.3% for AGIs $75k-100k, 1.8% for AGIs over 100k)
Total tax: $4,759 (reported on 78.0% of returns)
43044:
$4,759
State:
$6,781
(% of AGI for various income ranges: 3.3% for AGIs below $10k, 4.3% for AGIs $10k-25k, 7.2% for AGIs $25k-50k, 8.9% for AGIs $50k-75k, 10.4% for AGIs $75k-100k, 16.4% for AGIs over 100k)
Earned income credit: $1,594 (reported on 13.3% of returns)
Here:
$1,594
State:
$1,696
Percentage of individuals using paid preparers for their 2004 taxes: 60.7%
Here:
61%
State:
55%
(% for various income ranges: 50.8% for AGIs below $10k, 59.0% for AGIs $10k-25k, 67.6% for AGIs $25k-50k, 59.5% for AGIs $50k-75k, 60.3% for AGIs $75k-100k, 64.4% for AGIs over 100k)
Likely homosexual households (counted as self-reported same-sex unmarried-partner households)
Lesbian couples: 0.4% of all households
Gay men: 0.0% of all households
Household received Food Stamps/SNAP in the past 12 months: 251 Household did not receive Food Stamps/SNAP in the past 12 months: 1,810
Women who had a birth in the past 12 months: 37 (18 now married, 18 unmarried) Women who did not have a birth in the past 12 months: 1,206 (655 now married, 549 unmarried)
Housing units in zip code 43044 with a mortgage: 920 (57 second mortgage, 54 both second mortgage and home equity loan) Houses without a mortgage: 4
Median monthly owner costs for units with a mortgage: $1,334 Median monthly owner costs for units without a mortgage: $541
Residents with income below the poverty level in 2022:
This zip code:
11.6%
Whole state:
13.4%
Residents with income below 50% of the poverty level in 2022:
This zip code:
8.4%
Whole state:
7.0%
Median number of rooms in houses and condos:
Here:
6.7
State:
6.7
Median number of rooms in apartments:
Here:
5.4
State:
4.4
Notable locations in this zip code not listed on our city pages
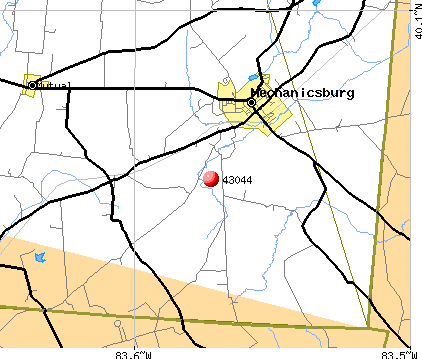
Notable locations in zip code 43044: Mustang Valley Farm (A), Mechanicsburg Fire and Emergency Medical Services (B), Pleasant Township Fire Department (C). Display/hide their locations on the map
Churches in zip code 43044 include: Enterprise Church (A), Hickory Grove Church (B), Oak Grove Church (C), Treacle Church (D), Second Baptist Church (E), Saint Michael Catholic Church (F), Mechanicsburg United Methodist Church (G), Mechanicsburg Baptist Church (H), Church of Our Savior (I). Display/hide their locations on the map
Cemeteries: Britton Cemetery (1), Vernon Cemetery (2), Guy Cemetery (3), Hazel Cemetery (4), Hopewell Cemetery (5), Maple Grove Cemetery (6), McConkey Cemetery (7). Display/hide their locations on the map
Lakes and reservoirs: Fudger Lake (A), Baker Lake (B), East Fork Buck Creek Structure 3a Reservoir (C), East Fork Buck Creek Structure Number Four Reservoir (D), East Fork Buck Creek Structure Number One Reservoir (E). Display/hide their locations on the map
665 married couples with children.
145 single-parent households (31 men, 114 women).
97.8% of residents of 43044 zip code speak English at home.
0.7% of residents speak Spanish at home (86% very well, 14% not well).
0.1% of residents speak other Indo-European language at home (100% very well).
0.9% of residents speak Asian or Pacific Island language at home (32% very well, 20% well, 48% not well).
Foreign born population: 77 (1.5%) (80.3% of them are naturalized citizens)
This zip code:
1.5%
Whole state:
5.0%
39%United Kingdom, excluding England and Scotland
37%Sweden
34%Guatemala
13%Bolivia
5%Romania
3%Malaysia
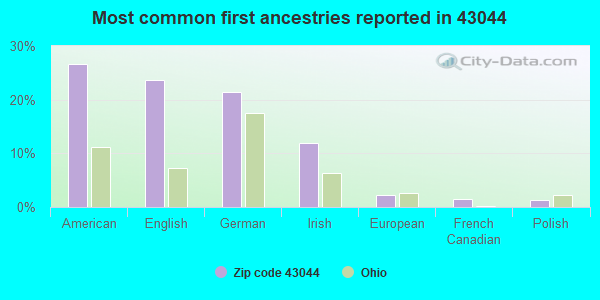
27%American
24%English
21%German
12%Irish
2%European
1%French Canadian
1%Polish
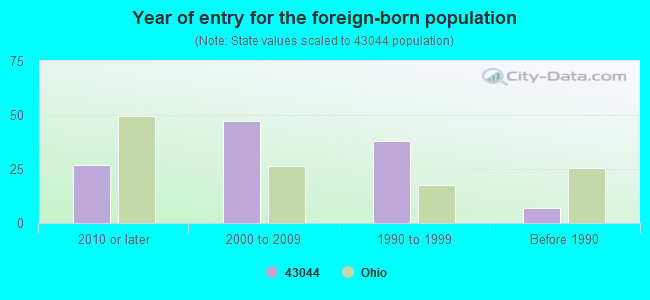
Year of entry for the foreign-born population
272010 or later
472000 to 2009
381990 to 1999
7Before 1990
Facilities with environmental interests located in this zip code:
CHAMPAIGN LANDMARK INC * (140 SOUTH MAIN STREET in MECHANICSBURG, OH)
AIR MINOR (AIRS/AFS) STATE MASTER (Ohio general info) - AIR MAJOR, -11-5150-997-2, EPCRA STATE MASTER (Ohio general info) - AIR MAJOR Business SIC classification: FARM PRODUCT WAREHOUSING AND STORAGE; GRAIN AND FIELD BEANS
CHAMPAIGN LANDMARK INC MECH (JET S RT 29 & 187 in MECHANICSBURG, OH)
COMPLIANCE ACTIVITY (Tracking inspections of insecticide, fungicide, and rodenticide, and toxic substances)
Housing units lacking complete plumbing facilities: 3.8% Housing units lacking complete kitchen facilities: 2.8%
34.5%Utility gas
32.5%Electricity
22.2%Bottled, tank, or LP gas
4.5%Fuel oil, kerosene, etc.
3.7%Wood
2.0%Coal or coke
0.7%No fuel used
Population in 1990: 5,390.
Place of birth for U.S.-born residents:
This state: 4,363
Northeast: 52
Midwest: 201
South: 429
West: 63
61% of the 43044 zip code residents lived in the same house 5 years ago. Out of people who lived in different houses, 63% lived in this county. Out of people who lived in different counties, 50% lived in Ohio.
85% of the 43044 zip code residents lived in the same house 1 year ago. Out of people who lived in different houses, 57% moved from this county. Out of people who lived in different houses, 39% moved from different county within same state.
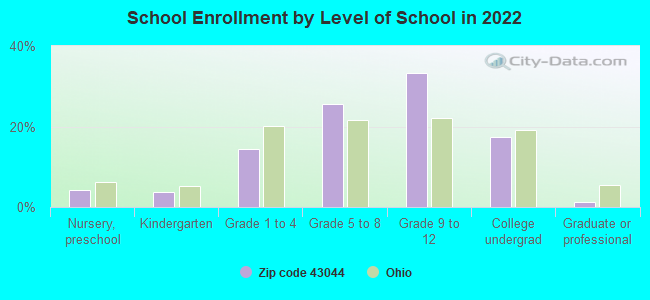
Private vs. public school enrollment:
Students in private schools in grades 1 to 8 (elementary and middle school): 45
Here:
12.8%
Ohio:
16.0%
Students in private schools in grades 9 to 12 (high school): 41
Here:
14.1%
Ohio:
13.1%
Students in private undergraduate colleges: 1
Here:
1.2%
Ohio:
22.3%
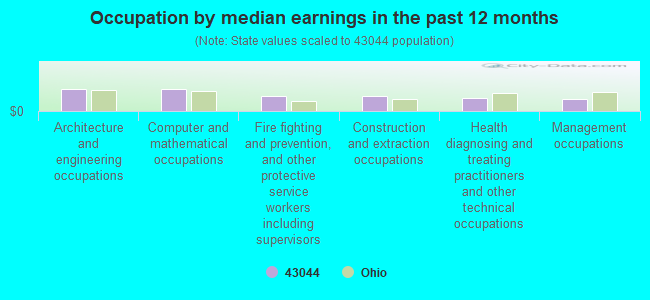
Occupation by median earnings in the past 12 months ($)
106,683Architecture and engineering occupations
105,260Computer and mathematical occupations
73,469Fire fighting and prevention, and other protective service workers including supervisors
71,703Construction and extraction occupations
64,123Health diagnosing and treating practitioners and other technical occupations
56,563Management occupations
Companies with federal contracts located in this zip code:
PARMALAT SPA (VIA ORESTE GRASSI 26 in COLLECCHIO, In) : $887,040 in 106 contractsfrom 2002 to 2005
Contracts for Dairy Foods and Eggs by Defense Logistics Agency Signed by year:2000: $0; 2001: $0; 2002: $0; 2003: $0; 2004: $321,193; 2005: $565,847; 2006: $0.
Biggest contracts:
$36,016 with Defense Logistics Agency for Dairy Foods and Eggs. Taking place in GA. Signed on 2005-01-13. Completion date: 2005-01-25.
$22,577, same as above.Signed on 2005-01-10. Completion date: 2005-01-14.
$21,506, same as above.Signed on 2004-10-07. Completion date: 2004-10-15.
$19,370, same as above.Signed on 2005-01-05. Completion date: 2005-01-10.
Top industries in this zip code by the number of employees in 2005:
Arts, Entertainment, and Recreation: Bowling Centers (20-49 employees: 1 establishment)
Wholesale Trade: Grain and Field Bean Merchant Wholesalers (20-49: 1)
Other Services (except Public Administration): Funeral Homes and Funeral Services (10-19: 1, 1-4: 1)
Mining: Construction Sand and Gravel Mining (10-19: 1)
Wholesale Trade: Farm and Garden Machinery and Equipment Merchant Wholesalers (10-19: 1)
People in group quarters in 2010:
152 people in local jails and other municipal confinement facilities
Fatal accident statistics in 2013:
Fatal accident count: 1
Vehicles involved in fatal accidents: 1
Fatal accidents caused by drunken drivers: 1
Fatalities: 1
Persons involved in fatal accidents: 1
Pedestrians involved in fatal accidents: 0
Fatal accident statistics in 2012:
Fatal accident count: 2
Vehicles involved in fatal accidents: 3
Fatal accidents caused by drunken drivers: 1
Fatalities: 2
Persons involved in fatal accidents: 3
Pedestrians involved in fatal accidents: 0
Home Mortgage Disclosure Act Aggregated Statistics For Year 2009 (Based on 4 partial tracts)
A) FHA, FSA/RHS & VA Home Purchase Loans
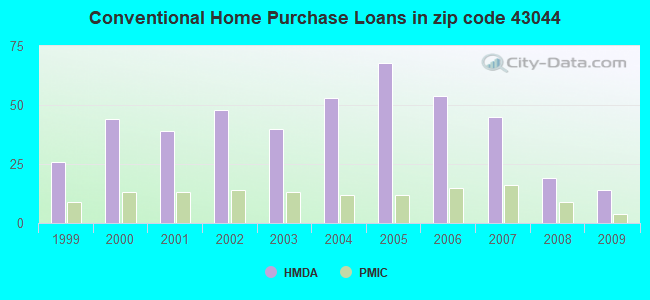
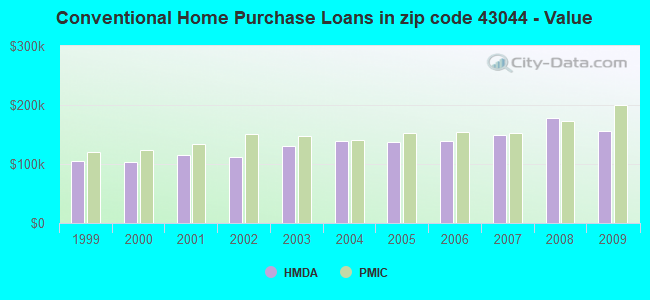
B) Conventional Home Purchase Loans
C) Refinancings
D) Home Improvement Loans
F) Non-occupant Loans on < 5 Family Dwellings (A B C & D)
G) Loans On Manufactured Home Dwelling (A B C & D)
Number
Average Value
Number
Average Value
Number
Average Value
Number
Average Value
Number
Average Value
Number
Average Value
LOANS ORIGINATED
14
$151,765
14
$155,441
94
$151,533
6
$87,280
4
$196,832
3
$102,587
APPLICATIONS APPROVED, NOT ACCEPTED
2
$181,910
1
$221,960
9
$153,687
0
$0
1
$210,100
1
$86,230
APPLICATIONS DENIED
2
$97,080
4
$128,445
33
$156,946
4
$66,508
2
$77,790
2
$59,105
APPLICATIONS WITHDRAWN
1
$75,130
3
$90,287
21
$148,882
0
$0
1
$170,790
0
$0
FILES CLOSED FOR INCOMPLETENESS
0
$0
0
$0
5
$149,260
1
$6,580
0
$0
0
$0
Aggregated Statistics For Year 2008 (Based on 4 partial tracts)
A) FHA, FSA/RHS & VA Home Purchase Loans
B) Conventional Home Purchase Loans
C) Refinancings
D) Home Improvement Loans
F) Non-occupant Loans on < 5 Family Dwellings (A B C & D)
G) Loans On Manufactured Home Dwelling (A B C & D)
Number
Average Value
Number
Average Value
Number
Average Value
Number
Average Value
Number
Average Value
Number
Average Value
LOANS ORIGINATED
12
$154,536
19
$177,803
55
$161,158
6
$55,435
4
$143,045
2
$80,340
APPLICATIONS APPROVED, NOT ACCEPTED
1
$81,220
3
$176,307
9
$153,407
1
$48,480
0
$0
0
$0
APPLICATIONS DENIED
4
$117,845
3
$125,307
38
$151,070
5
$62,280
0
$0
4
$73,710
APPLICATIONS WITHDRAWN
1
$129,290
2
$114,530
16
$156,486
0
$0
3
$101,250
0
$0
FILES CLOSED FOR INCOMPLETENESS
0
$0
1
$44,770
3
$166,913
1
$32,920
1
$44,770
0
$0
Aggregated Statistics For Year 2007 (Based on 4 partial tracts)
A) FHA, FSA/RHS & VA Home Purchase Loans
B) Conventional Home Purchase Loans
C) Refinancings
D) Home Improvement Loans
F) Non-occupant Loans on < 5 Family Dwellings (A B C & D)
G) Loans On Manufactured Home Dwelling (A B C & D)
Number
Average Value
Number
Average Value
Number
Average Value
Number
Average Value
Number
Average Value
Number
Average Value
LOANS ORIGINATED
8
$135,452
45
$149,537
63
$133,307
11
$44,385
6
$117,710
1
$40,400
APPLICATIONS APPROVED, NOT ACCEPTED
0
$0
4
$139,988
21
$136,858
3
$46,430
0
$0
1
$7,240
APPLICATIONS DENIED
2
$146,285
8
$116,570
59
$153,578
8
$52,704
1
$98,630
1
$20,620
APPLICATIONS WITHDRAWN
1
$131,910
6
$148,972
20
$155,802
0
$0
1
$94,570
0
$0
FILES CLOSED FOR INCOMPLETENESS
0
$0
2
$129,415
9
$146,961
1
$50,700
1
$168,480
0
$0
Aggregated Statistics For Year 2006 (Based on 4 partial tracts)
A) FHA, FSA/RHS & VA Home Purchase Loans
B) Conventional Home Purchase Loans
C) Refinancings
D) Home Improvement Loans
F) Non-occupant Loans on < 5 Family Dwellings (A B C & D)
G) Loans On Manufactured Home Dwelling (A B C & D)
Number
Average Value
Number
Average Value
Number
Average Value
Number
Average Value
Number
Average Value
Number
Average Value
LOANS ORIGINATED
4
$138,482
54
$138,384
63
$126,066
14
$43,203
4
$150,732
5
$101,546
APPLICATIONS APPROVED, NOT ACCEPTED
0
$0
9
$126,273
17
$114,176
5
$35,360
0
$0
1
$104,450
APPLICATIONS DENIED
1
$154,930
9
$105,302
60
$135,779
10
$32,152
2
$104,345
2
$119,275
APPLICATIONS WITHDRAWN
1
$163,280
7
$148,409
35
$142,418
3
$49,957
0
$0
0
$0
FILES CLOSED FOR INCOMPLETENESS
0
$0
4
$141,395
11
$142,743
0
$0
1
$117,200
0
$0
Aggregated Statistics For Year 2005 (Based on 4 partial tracts)
A) FHA, FSA/RHS & VA Home Purchase Loans
B) Conventional Home Purchase Loans
C) Refinancings
D) Home Improvement Loans
F) Non-occupant Loans on < 5 Family Dwellings (A B C & D)
G) Loans On Manufactured Home Dwelling (A B C & D)
Number
Average Value
Number
Average Value
Number
Average Value
Number
Average Value
Number
Average Value
Number
Average Value
LOANS ORIGINATED
7
$141,564
68
$136,886
83
$137,806
12
$53,190
9
$147,658
3
$75,387
APPLICATIONS APPROVED, NOT ACCEPTED
0
$0
8
$101,706
26
$133,680
1
$46,520
2
$116,230
2
$34,220
APPLICATIONS DENIED
1
$139,760
17
$89,444
71
$140,194
10
$32,767
3
$53,400
8
$45,761
APPLICATIONS WITHDRAWN
0
$0
12
$131,520
33
$143,897
8
$183,494
1
$150,960
1
$77,140
FILES CLOSED FOR INCOMPLETENESS
0
$0
4
$139,715
16
$146,359
1
$120,870
1
$80,320
0
$0
Aggregated Statistics For Year 2004 (Based on 4 partial tracts)
A) FHA, FSA/RHS & VA Home Purchase Loans
B) Conventional Home Purchase Loans
C) Refinancings
D) Home Improvement Loans
F) Non-occupant Loans on < 5 Family Dwellings (A B C & D)
G) Loans On Manufactured Home Dwelling (A B C & D)
Number
Average Value
Number
Average Value
Number
Average Value
Number
Average Value
Number
Average Value
Number
Average Value
LOANS ORIGINATED
10
$127,330
53
$138,724
90
$132,279
9
$42,178
8
$110,092
2
$37,125
APPLICATIONS APPROVED, NOT ACCEPTED
0
$0
7
$92,531
20
$112,730
3
$24,333
2
$62,550
2
$20,135
APPLICATIONS DENIED
2
$135,665
17
$89,864
71
$127,304
10
$47,164
1
$91,840
9
$49,108
APPLICATIONS WITHDRAWN
1
$187,390
6
$132,158
34
$119,423
3
$64,277
0
$0
1
$75,060
FILES CLOSED FOR INCOMPLETENESS
1
$80,150
2
$148,080
12
$144,749
0
$0
1
$110,510
0
$0
Aggregated Statistics For Year 2003 (Based on 4 partial tracts)
A) FHA, FSA/RHS & VA Home Purchase Loans
B) Conventional Home Purchase Loans
C) Refinancings
D) Home Improvement Loans
F) Non-occupant Loans on < 5 Family Dwellings (A B C & D)
Number
Average Value
Number
Average Value
Number
Average Value
Number
Average Value
Number
Average Value
LOANS ORIGINATED
9
$134,091
40
$131,263
220
$122,113
9
$35,107
12
$95,019
APPLICATIONS APPROVED, NOT ACCEPTED
1
$152,660
11
$105,017
30
$127,164
3
$21,133
0
$0
APPLICATIONS DENIED
1
$206,680
10
$97,385
64
$129,995
8
$21,011
2
$45,930
APPLICATIONS WITHDRAWN
0
$0
5
$113,536
36
$146,095
1
$2,630
1
$60,930
FILES CLOSED FOR INCOMPLETENESS
0
$0
0
$0
11
$146,079
1
$92,820
0
$0
Aggregated Statistics For Year 2002 (Based on 4 partial tracts)
A) FHA, FSA/RHS & VA Home Purchase Loans
B) Conventional Home Purchase Loans
C) Refinancings
D) Home Improvement Loans
F) Non-occupant Loans on < 5 Family Dwellings (A B C & D)
Number
Average Value
Number
Average Value
Number
Average Value
Number
Average Value
Number
Average Value
LOANS ORIGINATED
8
$143,488
48
$111,685
158
$122,740
11
$33,100
9
$87,989
APPLICATIONS APPROVED, NOT ACCEPTED
0
$0
8
$81,958
26
$113,260
4
$22,915
1
$86,310
APPLICATIONS DENIED
1
$100,580
8
$46,669
63
$104,241
9
$12,933
2
$32,660
APPLICATIONS WITHDRAWN
0
$0
7
$126,316
39
$111,318
0
$0
1
$67,090
FILES CLOSED FOR INCOMPLETENESS
0
$0
3
$108,533
12
$140,502
1
$19,080
0
$0
Aggregated Statistics For Year 2001 (Based on 4 partial tracts)
A) FHA, FSA/RHS & VA Home Purchase Loans
B) Conventional Home Purchase Loans
C) Refinancings
D) Home Improvement Loans
F) Non-occupant Loans on < 5 Family Dwellings (A B C & D)
Number
Average Value
Number
Average Value
Number
Average Value
Number
Average Value
Number
Average Value
LOANS ORIGINATED
11
$128,786
39
$115,349
154
$110,815
13
$25,501
6
$87,273
APPLICATIONS APPROVED, NOT ACCEPTED
1
$93,120
6
$79,858
22
$105,788
6
$11,783
1
$81,060
APPLICATIONS DENIED
2
$77,940
19
$31,899
51
$102,271
11
$11,946
0
$0
APPLICATIONS WITHDRAWN
0
$0
3
$114,023
33
$107,362
1
$15,070
0
$0
FILES CLOSED FOR INCOMPLETENESS
0
$0
0
$0
7
$118,920
1
$13,790
0
$0
Aggregated Statistics For Year 2000 (Based on 4 partial tracts)
A) FHA, FSA/RHS & VA Home Purchase Loans
B) Conventional Home Purchase Loans
C) Refinancings
D) Home Improvement Loans
F) Non-occupant Loans on < 5 Family Dwellings (A B C & D)
Number
Average Value
Number
Average Value
Number
Average Value
Number
Average Value
Number
Average Value
LOANS ORIGINATED
12
$123,776
44
$104,053
39
$88,411
16
$19,726
3
$85,900
APPLICATIONS APPROVED, NOT ACCEPTED
0
$0
16
$58,118
13
$94,930
10
$28,673
1
$37,380
APPLICATIONS DENIED
1
$136,500
31
$41,629
32
$96,937
11
$21,313
1
$90,390
APPLICATIONS WITHDRAWN
0
$0
4
$86,125
12
$89,588
1
$30,860
0
$0
FILES CLOSED FOR INCOMPLETENESS
0
$0
2
$111,845
4
$77,235
0
$0
0
$0
Aggregated Statistics For Year 1999 (Based on 2 partial tracts)
A) FHA, FSA/RHS & VA Home Purchase Loans
B) Conventional Home Purchase Loans
C) Refinancings
D) Home Improvement Loans
F) Non-occupant Loans on < 5 Family Dwellings (A B C & D)
Detailed PMIC statistics for the following Tracts:0023.01
, 0402.00
2002 - 2018 National Fire Incident Reporting System (NFIRS) incidents
Based on the data from the years 2002 - 2018 the average number of fires per year is 34. The highest number of reported fires - 62 took place in 2007, and the least - 19 in 2006. The data has a declining trend.
When looking into fire subcategories, the most incidents belonged to: Structure Fires (49.2%), and Outside Fires (36.0%).
Fire incident types reported to NFIRS in Zip Code 43044


 Nearest zip codes: 43010, 43084, 45369, 43029, 43045, 43009.


 Based on the data from the years 2002 - 2018 the average number of fires per year is 34. The highest number of reported fires - 62 took place in 2007, and the least - 19 in 2006. The data has a declining trend.
 When looking into fire subcategories, the most incidents belonged to: Structure Fires (49.2%), and Outside Fires (36.0%).