Estimated zip code population in 2022: 7,087 Zip code population in 2010: 6,841 Zip code population in 2000: 6,056
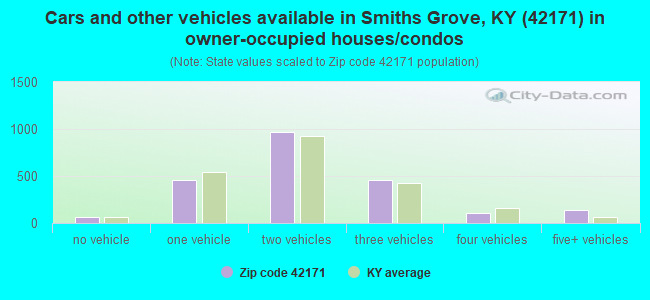
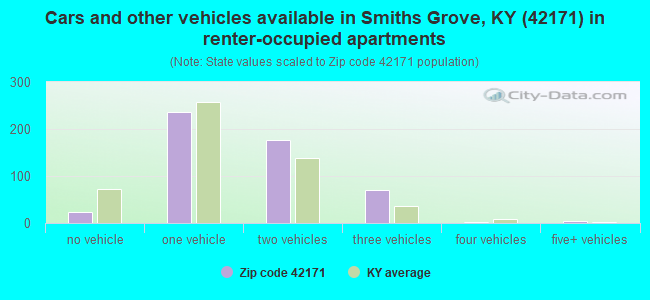
Houses and condos: 2,999 Renter-occupied apartments: 516
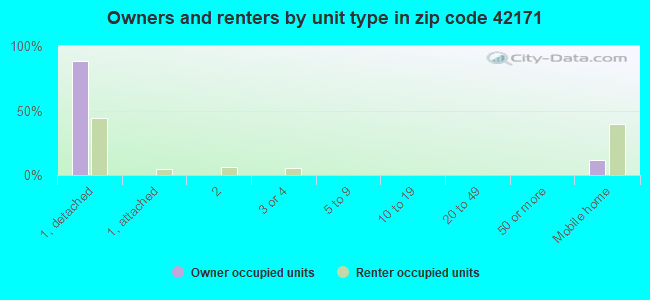
% of renters here:
19%
State:
31%
March 2022 cost of living index in zip code 42171: 82.7 (low, U.S. average is 100)
Land area: 101.4 sq. mi. Water area: 0.5 sq. mi.
Population density: 70 people per square mile
(very low).
OSM Map
General Map
Google Map
MSN Map
OSM Map
General Map
Google Map
MSN Map
OSM Map
General Map
Google Map
MSN Map
OSM Map
General Map
Google Map
MSN Map
Please wait while loading the map...
Real estate property taxes paid for housing units in 2022:
This zip code:
0.6% ($1,237)
Kentucky:
0.7% ($1,456)
Median real estate property taxes paid for housing units with mortgages in 2022: $1,239 (0.5%) Median real estate property taxes paid for housing units with no mortgage in 2022: $1,217 (0.6%)
Business Search- 14 Million verified businesses
Males: 3,739
(52.8%)
Females: 3,347
(47.2%)
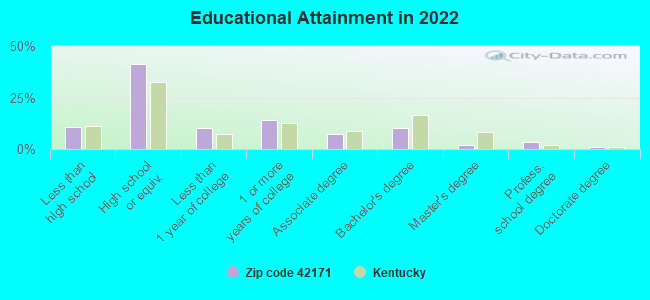
For population 25 years and over in 42171:
High school or higher: 88.8%
Bachelor's degree or higher: 16.4%
Graduate or professional degree: 6.1%
Unemployed: 3.1%
Mean travel time to work (commute): 32.1 minutes
For population 15 years and over in 42171:
Never married: 21.1%
Now married: 58.7%
Separated: 3.9%
Widowed: 5.8%
Divorced: 10.6%
Zip code 42171 compared to state average:
Black race population percentage significantly below state average.
Hispanic race population percentage significantly below state average.
Foreign-born population percentage significantly below state average.
Renting percentage below state average.
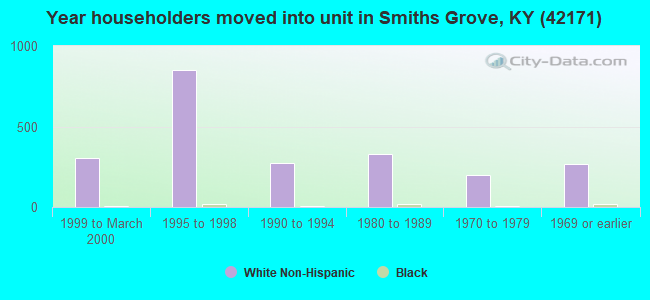
Length of stay since moving in significantly above state average.
Number of college students below state average.
Percentage of population with a bachelor's degree or higher below state average.
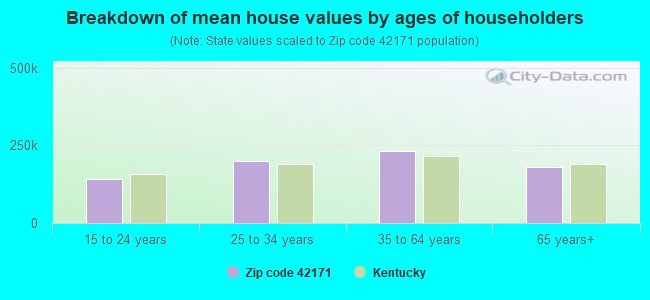
Estimated median house/condo value in 2022: $220,144
42171:
$220,144
Kentucky:
$196,300
According to our research of Kentucky and other state lists, there were 20 registered sex offenders living in 42171 zip code as of May 25, 2024. The ratio of all residents to sex offenders in zip code 42171 is 365 to 1. The ratio of registered sex offenders to all residents in this zip code is near the state average.
Median resident age:
This zip code:
40.0 years
Kentucky median age:
39.4 years
Average household size:
This zip code:
2.6 people
Kentucky:
2.4 people
Averages for the 2020 tax year for zip code 42171, filed in 2021:
Average Adjusted Gross Income (AGI) in 2020: $53,505 (Individual Income Tax Returns)
Here:
$53,505
State:
$61,342
Salary/wage: $47,860 (reported on 82.3% of returns)
Here:
$47,860
State:
$50,827
(% of AGI for various income ranges: 1159.1% for AGIs below $25k, 3443.9% for AGIs $25k-50k, 6345.4% for AGIs $50k-75k, 9060.0% for AGIs $75k-100k, 14482.5% for AGIs $100k-200k)
Taxable interest for individuals: $1,108 (reported on 23.8% of returns)
This zip code:
$1,108
Kentucky:
$1,441
(% of AGI for various income ranges: 12.5% for AGIs below $25k, 15.0% for AGIs $25k-50k, 19.3% for AGIs $50k-75k, 28.9% for AGIs $75k-100k, 90.8% for AGIs $100k-200k)
Ordinary dividends: $2,528 (reported on 9.8% of returns)
Here:
$2,528
State:
$7,388
(% of AGI for various income ranges: 12.2% for AGIs below $25k, 23.8% for AGIs $25k-50k, 31.5% for AGIs $50k-75k, 40.0% for AGIs $75k-100k, 85.8% for AGIs $100k-200k)
Net capital gain/loss in AGI: +$8,554 (reported on 11.9% of returns)
Here:
+$8,554
State:
+$19,475
(% of AGI for various income ranges: 9.0% for AGIs below $25k, 32.8% for AGIs $25k-50k, 123.7% for AGIs $50k-75k, 171.4% for AGIs $75k-100k, 474.2% for AGIs $100k-200k)
Profit/loss from business: +$6,006 (reported on 19.5% of returns)
Here:
+$6,006
State:
+$11,386
(% of AGI for various income ranges: 140.1% for AGIs below $25k, 139.4% for AGIs $25k-50k, 114.6% for AGIs $50k-75k, 164.6% for AGIs $75k-100k, 345.0% for AGIs $100k-200k)
Taxable individual retirement arrangement distribution: $16,056 (reported on 7.6% of returns)
42171:
$16,056
Kentucky:
$18,941
(% of AGI for various income ranges: 65.0% for AGIs below $25k, 68.8% for AGIs $25k-50k, 135.6% for AGIs $50k-75k, 218.9% for AGIs $75k-100k, 762.5% for AGIs $100k-200k)
Total itemized deductions: $30,027 (reported on 3.4% of returns)
Here:
$30,027
State:
$32,473
(% of AGI for various income ranges: 69.1% for AGIs below $25k, 197.3% for AGIs $50k-75k, 808.8% for AGIs $100k-200k)
Charity contributions: $10,611 (reported on 2.7% of returns)
Here:
$10,611
State:
$13,472
(% of AGI for various income ranges: 45.1% for AGIs $50k-75k, 320.8% for AGIs $100k-200k)
Taxes paid: $7,445 (reported on 3.4% of returns)
42171:
$7,445
State:
$7,830
(% of AGI for various income ranges: 8.9% for AGIs below $25k, 53.9% for AGIs $50k-75k, 219.6% for AGIs $100k-200k)
Earned income credit: $2,269 (reported on 18.6% of returns)
Here:
$2,269
State:
$2,336
(% of AGI for various income ranges: 103.8% for AGIs below $25k, 76.9% for AGIs $25k-50k)
Percentage of individuals using paid preparers for their 2020 taxes: 97.3%
Here:
97%
State:
94%
(% for various income ranges: 96.4% for AGIs below $25k, 98.8% for AGIs $25k-50k, 96.2% for AGIs $50k-75k, 97.3% for AGIs $75k-100k, 97.1% for AGIs $100k-200k, 100.0% for AGIs over 200k)
Averages for the 2012 tax year for zip code 42171, filed in 2013:
Average Adjusted Gross Income (AGI) in 2012: $41,982 (Individual Income Tax Returns)
Here:
$41,982
State:
$50,814
Salary/wage: $37,616 (reported on 85.6% of returns)
Here:
$37,616
State:
$42,723
(% of AGI for various income ranges: 75.4% for AGIs below $25k, 81.0% for AGIs $25k-50k, 82.0% for AGIs $50k-75k, 85.2% for AGIs $75k-100k, 77.0% for AGIs $100k-200k, 36.4% for AGIs over 200k)
Taxable interest for individuals: $1,196 (reported on 26.0% of returns)
This zip code:
$1,196
Kentucky:
$1,381
(% of AGI for various income ranges: 1.5% for AGIs below $25k, 0.7% for AGIs $25k-50k, 0.4% for AGIs $50k-75k, 0.2% for AGIs $75k-100k, 0.5% for AGIs $100k-200k, 2.2% for AGIs over 200k)
Ordinary dividends: $1,219 (reported on 9.5% of returns)
Here:
$1,219
State:
$6,239
(% of AGI for various income ranges: 0.6% for AGIs below $25k, 0.3% for AGIs $25k-50k, 0.2% for AGIs $50k-75k, 0.1% for AGIs $75k-100k, 0.4% for AGIs $100k-200k)
Net capital gain/loss in AGI: +$4,914 (reported on 12.6% of returns)
Here:
+$4,914
State:
+$11,336
(% of AGI for various income ranges: 1.3% for AGIs below $25k, 1.0% for AGIs $25k-50k, 1.0% for AGIs $50k-75k, 0.1% for AGIs $75k-100k, 4.8% for AGIs $100k-200k)
Profit/loss from business: +$6,889 (reported on 18.9% of returns)
Here:
+$6,889
State:
+$10,862
(% of AGI for various income ranges: 8.0% for AGIs below $25k, 2.0% for AGIs $25k-50k, 1.8% for AGIs $50k-75k, 1.5% for AGIs $75k-100k, 5.5% for AGIs $100k-200k)
Taxable individual retirement arrangement distribution: $10,021 (reported on 6.7% of returns)
42171:
$10,021
Kentucky:
$14,296
(% of AGI for various income ranges: 2.2% for AGIs below $25k, 2.1% for AGIs $25k-50k, 2.0% for AGIs $50k-75k, 2.3% for AGIs $100k-200k)
Total itemized deductions: $17,378 (22% of AGI, reported on 26.0% of returns)
Here:
$17,378
State:
$21,160
Here:
21.8% of AGI
State:
20.0% of AGI
(% of AGI for various income ranges: 6.2% for AGIs below $25k, 8.1% for AGIs $25k-50k, 10.8% for AGIs $50k-75k, 12.6% for AGIs $75k-100k, 14.5% for AGIs $100k-200k, 12.9% for AGIs over 200k)
Charity contributions: $3,487 (reported on 21.1% of returns)
Here:
$3,487
State:
$4,303
(% of AGI for various income ranges: 0.5% for AGIs below $25k, 1.3% for AGIs $25k-50k, 1.6% for AGIs $50k-75k, 2.1% for AGIs $75k-100k, 2.9% for AGIs $100k-200k, 2.3% for AGIs over 200k)
Taxes paid: $6,089 (reported on 26.0% of returns)
42171:
$6,089
State:
$8,496
(% of AGI for various income ranges: 0.9% for AGIs below $25k, 1.9% for AGIs $25k-50k, 3.6% for AGIs $50k-75k, 5.1% for AGIs $75k-100k, 6.2% for AGIs $100k-200k, 5.9% for AGIs over 200k)
Earned income credit: $2,256 (reported on 24.9% of returns)
Here:
$2,256
State:
$2,273
(% of AGI for various income ranges: 7.7% for AGIs below $25k, 1.5% for AGIs $25k-50k)
Percentage of individuals using paid preparers for their 2012 taxes: 77.9%
Here:
78%
State:
60%
(% for various income ranges: 73.0% for AGIs below $25k, 79.2% for AGIs $25k-50k, 84.1% for AGIs $50k-75k, 82.6% for AGIs $75k-100k, 82.4% for AGIs $100k-200k, 100.0% for AGIs over 200k)
Averages for the 2004 tax year for zip code 42171, filed in 2005:
Average Adjusted Gross Income (AGI) in 2004: $34,375 (Individual Income Tax Returns)
Here:
$34,375
State:
$41,540
Salary/wage: $32,935 (reported on 86.7% of returns)
Here:
$32,935
State:
$36,432
(% of AGI for various income ranges: 93.8% for AGIs below $10k, 81.3% for AGIs $10k-25k, 87.7% for AGIs $25k-50k, 88.0% for AGIs $50k-75k, 87.1% for AGIs $75k-100k, 63.0% for AGIs over 100k)
Taxable interest for individuals: $1,562 (reported on 35.7% of returns)
This zip code:
$1,562
Kentucky:
$1,571
(% of AGI for various income ranges: 9.3% for AGIs below $10k, 2.6% for AGIs $10k-25k, 1.3% for AGIs $25k-50k, 0.7% for AGIs $50k-75k, 1.0% for AGIs $75k-100k, 2.1% for AGIs over 100k)
Taxable dividends: $1,788 (reported on 12.3% of returns)
Here:
$1,788
State:
$3,453
(% of AGI for various income ranges: 1.0% for AGIs below $10k, 0.4% for AGIs $10k-25k, 0.2% for AGIs $25k-50k, 0.2% for AGIs $50k-75k, 0.2% for AGIs $75k-100k, 2.6% for AGIs over 100k)
Net capital gain/loss: +$5,693 (reported on 12.4% of returns)
Here:
+$5,693
State:
+$9,663
(% of AGI for various income ranges: 1.4% for AGIs below $10k, 1.3% for AGIs $10k-25k, 0.8% for AGIs $25k-50k, 1.8% for AGIs $50k-75k, 1.9% for AGIs $75k-100k, 5.5% for AGIs over 100k)
Profit/loss from business: +$5,425 (reported on 20.5% of returns)
Here:
+$5,425
State:
+$9,233
(% of AGI for various income ranges: 13.5% for AGIs below $10k, 5.8% for AGIs $10k-25k, 1.6% for AGIs $25k-50k, 1.6% for AGIs $50k-75k, 0.3% for AGIs $75k-100k, 7.1% for AGIs over 100k)
IRA payment deduction: $3,296 (reported on 2.7% of returns)
42171:
$3,296
Kentucky:
$2,955
Total itemized deductions: $14,420 (23% of AGI, reported on 29.1% of returns)
Here:
$14,420
State:
$17,474
Here:
23.2% of AGI
State:
21.0% of AGI
(% of AGI for various income ranges: 11.4% for AGIs below $10k, 7.5% for AGIs $10k-25k, 9.7% for AGIs $25k-50k, 13.2% for AGIs $50k-75k, 16.9% for AGIs $75k-100k, 15.3% for AGIs over 100k)
Charity contributions deductions: $2,687 (4% of AGI, reported on 25.4% of returns)
Here:
$2,687
State:
$3,494
Here:
4.2% of AGI
State:
4.0% of AGI
(% of AGI for various income ranges: 0.8% for AGIs below $10k, 0.8% for AGIs $10k-25k, 1.2% for AGIs $25k-50k, 2.1% for AGIs $50k-75k, 3.1% for AGIs $75k-100k, 3.5% for AGIs over 100k)
Total tax: $3,969 (reported on 72.2% of returns)
42171:
$3,969
State:
$6,162
(% of AGI for various income ranges: 3.8% for AGIs below $10k, 3.9% for AGIs $10k-25k, 5.8% for AGIs $25k-50k, 8.1% for AGIs $50k-75k, 9.8% for AGIs $75k-100k, 16.4% for AGIs over 100k)
Earned income credit: $1,749 (reported on 22.0% of returns)
Here:
$1,749
State:
$1,723
Percentage of individuals using paid preparers for their 2004 taxes: 80.4%
Here:
80%
State:
66%
(% for various income ranges: 78.0% for AGIs below $10k, 79.8% for AGIs $10k-25k, 81.9% for AGIs $25k-50k, 82.2% for AGIs $50k-75k, 76.9% for AGIs $75k-100k, 86.1% for AGIs over 100k)
Household received Food Stamps/SNAP in the past 12 months: 239 Household did not receive Food Stamps/SNAP in the past 12 months: 2,458
Women who had a birth in the past 12 months: 38 (37 now married, 0 unmarried) Women who did not have a birth in the past 12 months: 1,559 (980 now married, 585 unmarried)
Housing units in zip code 42171 with a mortgage: 1,437 (68 second mortgage, 1 home equity loan, 40 both second mortgage and home equity loan) Houses without a mortgage: 48
Median monthly owner costs for units with a mortgage: $1,120 Median monthly owner costs for units without a mortgage: $433
Residents with income below the poverty level in 2022:
This zip code:
16.8%
Whole state:
16.5%
Residents with income below 50% of the poverty level in 2022:
This zip code:
8.6%
Whole state:
9.0%
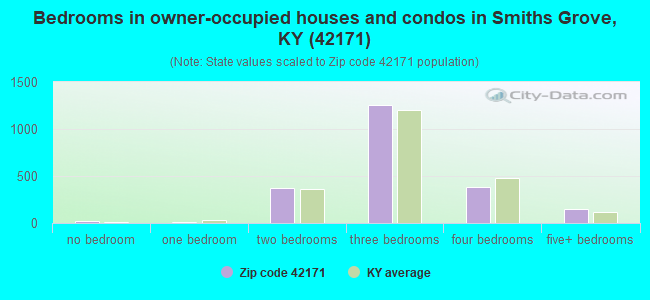
Median number of rooms in houses and condos:
Here:
6.6
State:
6.4
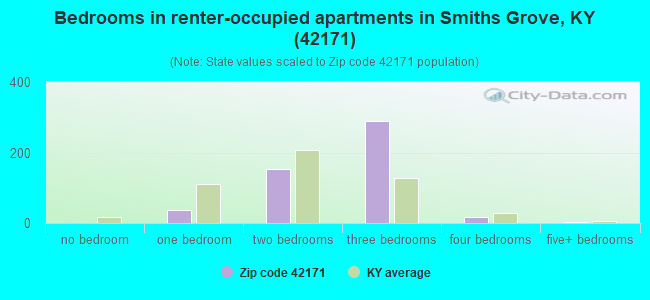
Median number of rooms in apartments:
Here:
5.7
State:
4.4
Notable locations in this zip code not listed on our city pages
Notable locations in zip code 42171: Dripping Spring (A), Chalybeate Fire Department (B), Smiths Grove Volunteer Fire Department (C), South Barren Fire Department (D), Smiths Grove Fire Department 3 Forks (E). Display/hide their locations on the map
Churches in zip code 42171 include: Green Meadows Church (A), Icy Sink Church (B), Lawrence Chapel (C), Liberty Church (D), Liberty Hill Church (E), Mount Olla Baptist Church (F), Mount Union Church (G), Mount Zion Church (H), Oak Forest Church (I). Display/hide their locations on the map
Streams, rivers, and creeks: Doty Creek (A), Sinking Creek (B), Sinking Branch (C), Brushy Fork (D), Little Buck Creek (E), Gardner Creek (F). Display/hide their locations on the map
1,122 married couples with children.
309 single-parent households (44 men, 265 women).
97.0% of residents of 42171 zip code speak English at home.
0.4% of residents speak Spanish at home (100% very well).
2.5% of residents speak other Indo-European language at home (99% very well, 1% not well).
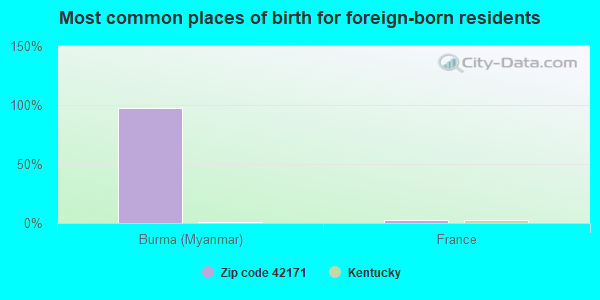
Foreign born population: 47 (0.7%) (96.0% of them are naturalized citizens)
This zip code:
0.7%
Whole state:
4.0%
98%Burma (Myanmar)
2%France
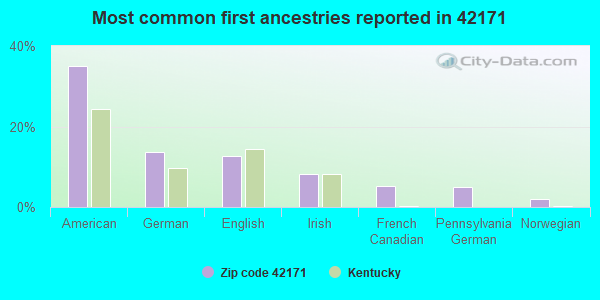
35%American
14%German
13%English
8%Irish
5%French Canadian
5%Pennsylvania German
2%Norwegian
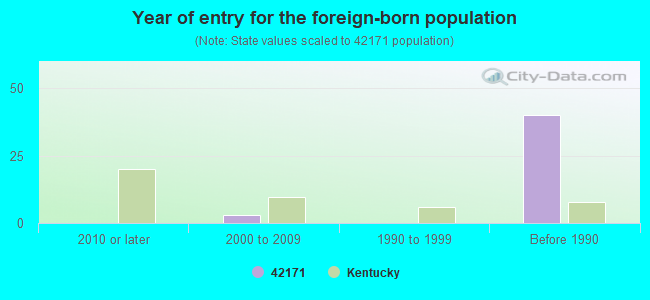
Year of entry for the foreign-born population
02010 or later
32000 to 2009
01990 to 1999
40Before 1990
Facilities with environmental interests located in this zip code:
NORTH WARREN ELEMENTARY SCHOOL (420 COLLEGE ST in SMITHS GROVE, KY)
(National Center for Education Statistics) - STATE ID-114571110 Organizations: WARREN COUNTY (SCHOOL DISTRICT)
PLOWMAN INC (618 SOUTH MAIN STREET in SMITHS GROVE, KY)
(Resource Conservation and Recovery Act (tracking hazardous waste)) Organizations: PLOWMAN, INC. (CONTACT/OPERATOR)
, LAWRENCE STIFFEY (CONTACT/OWNER)
ART'S USED PARTS (225 SUNSET in SMITH'S GROVE, KY)
(Resource Conservation and Recovery Act (tracking hazardous waste)) Organizations: ART WILKINSON (CONTACT/OWNER)
B & W TIRE (11353 NEW BOWLING GREEN ROAD in SMITHS GROVE, KY)
(Resource Conservation and Recovery Act (tracking hazardous waste)) Organizations: JIM GERON (CONTACT/OWNER)
BARRICK & SON (149 S MAIN in SMITHS GROVE, KY)
(Resource Conservation and Recovery Act (tracking hazardous waste)) Organizations: JERRY BARRICK (CONTACT/OWNER)
FLAV-O-RICH INC. (VINCENT STREET in SMITHS GROVE, KY)
(Resource Conservation and Recovery Act (tracking hazardous waste)) Organizations: DAIRYMEN INC. (CONTACT/OWNER)
NICKEL PROPERTY POND (HIGHWAY 101 in SMITH'S GROVE, KY)
(Resource Conservation and Recovery Act (tracking hazardous waste))
Housing units lacking complete plumbing facilities: 2.5% Housing units lacking complete kitchen facilities: 2.0%
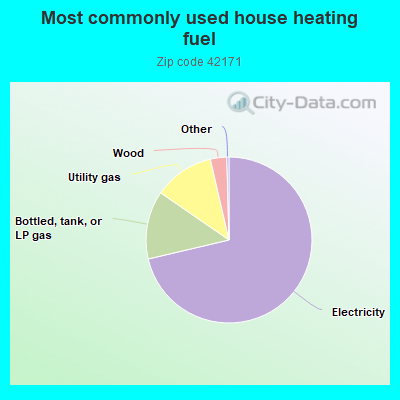
71.4%Electricity
13.3%Bottled, tank, or LP gas
11.8%Utility gas
3.2%Wood
Population in 1990: 4,650. Population change in the 1990s: +1,406 (+30.2%).
Place of birth for U.S.-born residents:
This state: 5,442
Northeast: 134
Midwest: 593
South: 724
West: 121
56% of the 42171 zip code residents lived in the same house 5 years ago. Out of people who lived in different houses, 53% lived in this county. Out of people who lived in different counties, 50% lived in Kentucky.
89% of the 42171 zip code residents lived in the same house 1 year ago. Out of people who lived in different houses, 63% moved from this county. Out of people who lived in different houses, 16% moved from different county within same state. Out of people who lived in different houses, 18% moved from different state.
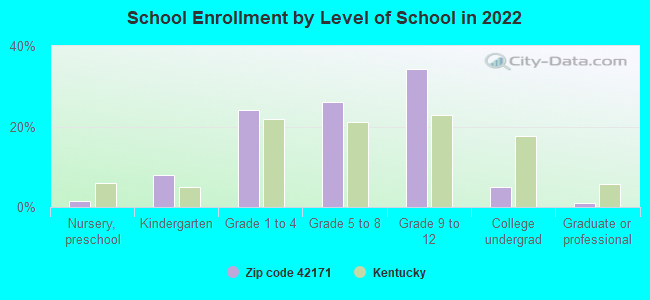
Private vs. public school enrollment:
Students in private schools in grades 1 to 8 (elementary and middle school): 73
Here:
9.7%
Kentucky:
17.2%
Students in private schools in grades 9 to 12 (high school): 17
Here:
3.4%
Kentucky:
15.2%
Students in private undergraduate colleges: 4
Here:
6.1%
Kentucky:
19.6%
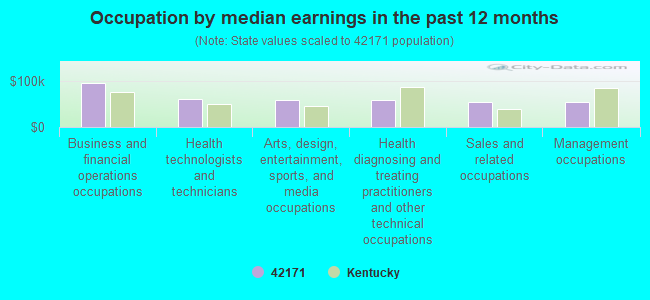
Occupation by median earnings in the past 12 months ($)
95,383Business and financial operations occupations
60,248Health technologists and technicians
58,931Arts, design, entertainment, sports, and media occupations
58,923Health diagnosing and treating practitioners and other technical occupations
54,314Sales and related occupations
53,335Management occupations
Top industries in this zip code by the number of employees in 2005:
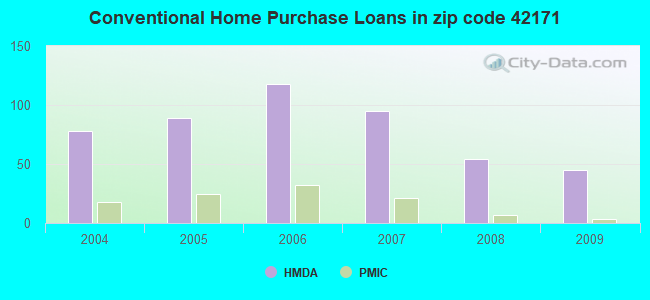
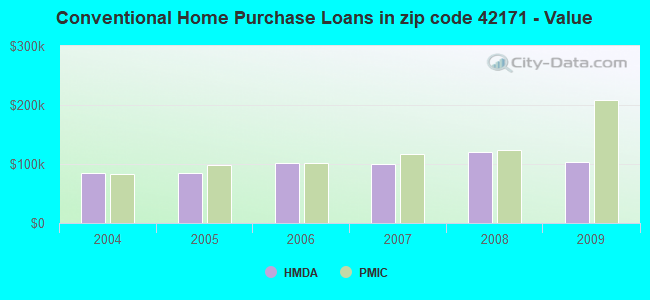
Detailed PMIC statistics for the following Tracts:0116.00
2002 - 2018 National Fire Incident Reporting System (NFIRS) incidents
According to the data from the years 2002 - 2018 the average number of fires per year is 40. The highest number of reported fires - 75 took place in 2014, and the least - 19 in 2009. The data has an increasing trend.
When looking into fire subcategories, the most reports belonged to: Structure Fires (39.1%), and Outside Fires (36.8%).
Fire incident types reported to NFIRS in Zip Code 42171

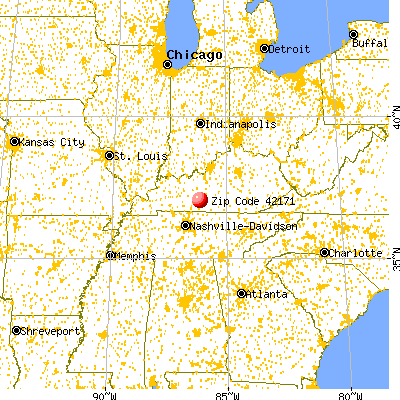


 Nearest zip codes: 42163, 42159, 42103, 42160, 42210, 42259.
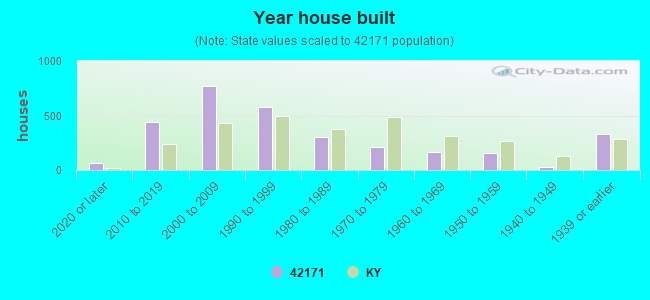


 According to the data from the years 2002 - 2018 the average number of fires per year is 40. The highest number of reported fires - 75 took place in 2014, and the least - 19 in 2009. The data has an increasing trend.
 When looking into fire subcategories, the most reports belonged to: Structure Fires (39.1%), and Outside Fires (36.8%).