Estimated zip code population in 2022: 1,591 Zip code population in 2010: 1,426 Zip code population in 2000: 1,455
Houses and condos: 688 Renter-occupied apartments: 97
% of renters here:
17%
State:
31%
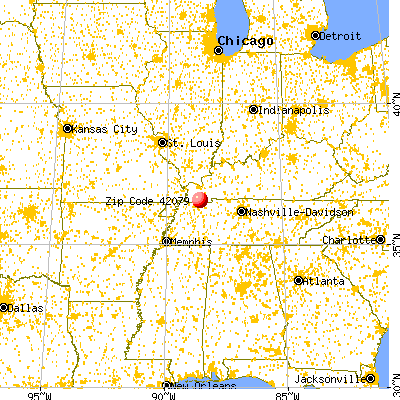
March 2022 cost of living index in zip code 42079: 81.9 (low, U.S. average is 100)
Land area: 52.1 sq. mi. Water area: 0.2 sq. mi.
Population density: 31 people per square mile
(very low).
OSM Map
General Map
Google Map
MSN Map
OSM Map
General Map
Google Map
MSN Map
OSM Map
General Map
Google Map
MSN Map
OSM Map
General Map
Google Map
MSN Map
Please wait while loading the map...
Real estate property taxes paid for housing units in 2022:
This zip code:
0.5% ($1,137)
Kentucky:
0.7% ($1,456)
Median real estate property taxes paid for housing units with mortgages in 2022: $1,278 (0.6%) Median real estate property taxes paid for housing units with no mortgage in 2022: $1,072 (0.5%)
Business Search- 14 Million verified businesses
Males: 718
(45.2%)
Females: 872
(54.8%)
For population 25 years and over in 42079:
High school or higher: 93.5%
Bachelor's degree or higher: 30.9%
Graduate or professional degree: 18.2%
Unemployed: 1.9%
Mean travel time to work (commute): 22.0 minutes
For population 15 years and over in 42079:
Never married: 27.0%
Now married: 65.3%
Separated: 0.0%
Widowed: 2.8%
Divorced: 4.8%
Zip code 42079 compared to state average:
Unemployed percentage below state average.
Black race population percentage significantly below state average.
Hispanic race population percentage below state average.
Foreign-born population percentage below state average.
Renting percentage below state average.
Length of stay since moving in significantly above state average.
Averages for the 2020 tax year for zip code 42079, filed in 2021:
Average Adjusted Gross Income (AGI) in 2020: $48,602 (Individual Income Tax Returns)
Here:
$48,602
State:
$61,342
Salary/wage: $41,473 (reported on 80.0% of returns)
Here:
$41,473
State:
$50,827
(% of AGI for various income ranges: 1149.4% for AGIs below $25k, 3673.3% for AGIs $25k-50k, 6838.3% for AGIs $50k-75k, 7977.5% for AGIs $75k-100k, 15627.5% for AGIs $100k-200k)
Taxable interest for individuals: $638 (reported on 26.7% of returns)
This zip code:
$638
Kentucky:
$1,441
(% of AGI for various income ranges: 11.2% for AGIs below $25k, 18.3% for AGIs $25k-50k, 18.3% for AGIs $50k-75k, 57.5% for AGIs $75k-100k, 67.5% for AGIs $100k-200k)
Ordinary dividends: $950 (reported on 13.3% of returns)
Here:
$950
State:
$7,388
(% of AGI for various income ranges: 15.3% for AGIs below $25k, 41.7% for AGIs $50k-75k, 62.5% for AGIs $100k-200k)
Net capital gain/loss in AGI: +$1,543 (reported on 11.7% of returns)
Here:
+$1,543
State:
+$19,475
(% of AGI for various income ranges: 8.8% for AGIs below $25k, 29.2% for AGIs $25k-50k, 145.0% for AGIs $75k-100k)
Profit/loss from business: +$6,378 (reported on 15.0% of returns)
Here:
+$6,378
State:
+$11,386
(% of AGI for various income ranges: 312.9% for AGIs below $25k, 70.0% for AGIs $50k-75k)
Taxable individual retirement arrangement distribution: $14,350 (reported on 6.7% of returns)
42079:
$14,350
Kentucky:
$18,941
(% of AGI for various income ranges: 93.5% for AGIs below $25k, 691.7% for AGIs $50k-75k)
Earned income credit: $2,267 (reported on 25.0% of returns)
Here:
$2,267
State:
$2,336
(% of AGI for various income ranges: 140.0% for AGIs below $25k, 85.0% for AGIs $25k-50k)
Percentage of individuals using paid preparers for their 2020 taxes: 93.3%
Here:
93%
State:
94%
(% for various income ranges: 91.3% for AGIs below $25k, 100.0% for AGIs $25k-50k, 88.9% for AGIs $50k-75k, 100.0% for AGIs $75k-100k, 85.7% for AGIs $100k-200k)
Averages for the 2012 tax year for zip code 42079, filed in 2013:
Average Adjusted Gross Income (AGI) in 2012: $40,569 (Individual Income Tax Returns)
Here:
$40,569
State:
$50,814
Salary/wage: $34,633 (reported on 81.8% of returns)
Here:
$34,633
State:
$42,723
(% of AGI for various income ranges: 78.3% for AGIs below $25k, 73.5% for AGIs $25k-50k, 74.4% for AGIs $50k-75k, 64.5% for AGIs $75k-100k, 62.1% for AGIs $100k-200k)
Taxable interest for individuals: $717 (reported on 32.7% of returns)
This zip code:
$717
Kentucky:
$1,381
(% of AGI for various income ranges: 0.9% for AGIs below $25k, 1.0% for AGIs $25k-50k, 0.4% for AGIs $50k-75k, 0.7% for AGIs $75k-100k)
Ordinary dividends: $660 (reported on 9.1% of returns)
Here:
$660
State:
$6,239
Net capital gain/loss in AGI: +$2,270 (reported on 18.2% of returns)
Here:
+$2,270
State:
+$11,336
(% of AGI for various income ranges: 1.2% for AGIs below $25k, 1.3% for AGIs $25k-50k, 2.8% for AGIs $75k-100k)
Profit/loss from business: +$3,867 (reported on 16.4% of returns)
Here:
+$3,867
State:
+$10,862
(% of AGI for various income ranges: 3.8% for AGIs below $25k, 2.6% for AGIs $25k-50k, 2.3% for AGIs $75k-100k)
Taxable individual retirement arrangement distribution: $5,325 (reported on 7.3% of returns)
42079:
$5,325
Kentucky:
$14,296
Total itemized deductions: $15,908 (22% of AGI, reported on 21.8% of returns)
Here:
$15,908
State:
$21,160
Here:
22.2% of AGI
State:
20.0% of AGI
(% of AGI for various income ranges: 14.9% for AGIs $25k-50k, 7.4% for AGIs $50k-75k, 7.6% for AGIs $75k-100k, 10.0% for AGIs $100k-200k)
Charity contributions: $3,800 (reported on 18.2% of returns)
Here:
$3,800
State:
$4,303
(% of AGI for various income ranges: 2.9% for AGIs below $25k, 3.1% for AGIs $50k-75k, 2.7% for AGIs $100k-200k)
Taxes paid: $4,836 (reported on 20.0% of returns)
42079:
$4,836
State:
$8,496
(% of AGI for various income ranges: 1.4% for AGIs $25k-50k, 2.1% for AGIs $50k-75k, 2.4% for AGIs $75k-100k, 4.9% for AGIs $100k-200k)
Earned income credit: $2,423 (reported on 23.6% of returns)
Here:
$2,423
State:
$2,273
(% of AGI for various income ranges: 7.8% for AGIs below $25k, 1.2% for AGIs $25k-50k)
Percentage of individuals using paid preparers for their 2012 taxes: 70.9%
Here:
71%
State:
60%
(% for various income ranges: 65.4% for AGIs below $25k, 69.2% for AGIs $25k-50k, 85.7% for AGIs $50k-75k, 80.0% for AGIs $75k-100k, 75.0% for AGIs $100k-200k)
Averages for the 2004 tax year for zip code 42079, filed in 2005:
Average Adjusted Gross Income (AGI) in 2004: $31,146 (Individual Income Tax Returns)
Here:
$31,146
State:
$41,540
Salary/wage: $29,220 (reported on 81.7% of returns)
Here:
$29,220
State:
$36,432
(% of AGI for various income ranges: 102.6% for AGIs below $10k, 61.6% for AGIs $10k-25k, 79.7% for AGIs $25k-50k, 78.2% for AGIs $50k-75k, 127.6% for AGIs $75k-100k)
Taxable interest for individuals: $1,173 (reported on 38.0% of returns)
This zip code:
$1,173
Kentucky:
$1,571
(% of AGI for various income ranges: 4.9% for AGIs below $10k, 3.2% for AGIs $10k-25k, 1.5% for AGIs $25k-50k, 0.4% for AGIs $50k-75k, 1.5% for AGIs $75k-100k)
Taxable dividends: $683 (reported on 14.6% of returns)
Here:
$683
State:
$3,453
(% of AGI for various income ranges: 0.3% for AGIs $10k-25k, 0.4% for AGIs $25k-50k, 0.1% for AGIs $50k-75k, 1.1% for AGIs $75k-100k)
Net capital gain/loss: +$1,800 (reported on 13.3% of returns)
Here:
+$1,800
State:
+$9,663
Profit/loss from business: +$3,278 (reported on 17.2% of returns)
Here:
+$3,278
State:
+$9,233
(% of AGI for various income ranges: 3.3% for AGIs below $10k, 8.6% for AGIs $10k-25k, -0.7% for AGIs $25k-50k, 1.9% for AGIs $50k-75k)
Total itemized deductions: $16,658 (30% of AGI, reported on 20.8% of returns)
Here:
$16,658
State:
$17,474
Here:
29.6% of AGI
State:
21.0% of AGI
(% of AGI for various income ranges: 6.1% for AGIs $10k-25k, 14.8% for AGIs $25k-50k, 10.4% for AGIs $50k-75k, 19.8% for AGIs $75k-100k)
Charity contributions deductions: $3,554 (6% of AGI, reported on 17.9% of returns)
Here:
$3,554
State:
$3,494
Here:
6.4% of AGI
State:
4.0% of AGI
(% of AGI for various income ranges: 1.3% for AGIs $10k-25k, 2.2% for AGIs $25k-50k, 2.4% for AGIs $50k-75k, 3.6% for AGIs $75k-100k)
Total tax: $3,154 (reported on 70.3% of returns)
42079:
$3,154
State:
$6,162
(% of AGI for various income ranges: 4.3% for AGIs below $10k, 4.8% for AGIs $10k-25k, 5.4% for AGIs $25k-50k, 8.6% for AGIs $50k-75k, 16.0% for AGIs $75k-100k)
Earned income credit: $1,800 (reported on 19.5% of returns)
Here:
$1,800
State:
$1,723
Percentage of individuals using paid preparers for their 2004 taxes: 71.2%
Here:
71%
State:
66%
(% for various income ranges: 66.4% for AGIs below $10k, 67.9% for AGIs $10k-25k, 72.8% for AGIs $25k-50k, 80.5% for AGIs $50k-75k, 66.7% for AGIs $75k-100k, 100.0% for AGIs over 100k)
Household received Food Stamps/SNAP in the past 12 months: 33 Household did not receive Food Stamps/SNAP in the past 12 months: 519
Women who did not have a birth in the past 12 months: 542 (293 now married, 250 unmarried)
Housing units in zip code 42079 with a mortgage: 204 (19 second mortgage, 19 both second mortgage and home equity loan) Median monthly owner costs for units with a mortgage: $1,418 Median monthly owner costs for units without a mortgage: $527
Residents with income below the poverty level in 2022:
This zip code:
4.7%
Whole state:
16.5%
Residents with income below 50% of the poverty level in 2022:
This zip code:
3.7%
Whole state:
9.0%
Median number of rooms in houses and condos:
Here:
7.1
State:
6.4
Median number of rooms in apartments:
Here:
5.2
State:
4.4
Notable locations in this zip code not listed on our city pages
Notable locations in zip code 42079: Cuba Fire Department Station 2 Lynnville (A), Cuba Fire Department Station 1 Cuba (B). Display/hide their locations on the map
Cemeteries: Tibbs Cemetery (1), Yarbrough Cemetery (2), Pittman Cemetery (3), Cook Cemetery (4), Hendon Cemetery (5), Day Cemetery (6), Kesterson Cemetery (7). Display/hide their locations on the map
Creeks: Bacon Creek (A), West Fork Terrapin Creek (B), Cooter Creek (C), Caldwell Creek (D), Mud Creek (E), East Fork Terrapin Creek (F). Display/hide their locations on the map
In group quarters: 6 (-1 institutionalized population)
Size of family households: 231 2-persons, 66 3-persons, 99 4-persons, 37 5-persons, 17 6-persons
Size of nonfamily households: 94 1-person, 6 2-persons
290 married couples with children.
12 single-parent households (12 women).
99.3% of residents of 42079 zip code speak English at home.
0.5% of residents speak Spanish at home (100% very well).
Foreign born population: 33 (2.1%) (0.0% of them are naturalized citizens)
:
2.1%
Whole state:
4.0%
80%Guyana
17%Honduras
55%American
18%English
4%Polish
3%German
3%Czech
1%Scandinavian
1%European
Year of entry for the foreign-born population
392010 or later
02000 to 2009
01990 to 1999
0Before 1990
Facilities with environmental interests located in this zip code:
SEDALIA ELEMENTARY SCHOOL (5468 STATE RT 97 in SEDALIA, KY)
(National Center for Education Statistics) - STATE ID-042205150 Organizations: GRAVES COUNTY (SCHOOL DISTRICT)
HUTSON AGRICULTURAL SERVICE (UNKNOWN in SEDALIA, KY)
AIR MINOR (AIRS/AFS) Business SIC classification: GRAIN AND FIELD BEANS
ROYSTER-CLARK INCORPORATED (1680 STATE ROUTE 339 EAST in SEDALIA, KY)
CRITERIA AND HAZARDOUS AIR POLLUTANT INVENTORY (Inventory of air pollution sources) Business SIC classification: GRAIN AND FIELD BEANS
Housing units lacking complete plumbing facilities: 1.4% Housing units lacking complete kitchen facilities: 4.3%
46.1%Bottled, tank, or LP gas
29.2%Electricity
14.2%Utility gas
8.1%Fuel oil, kerosene, etc.
2.8%Wood
Population in 1990: 1,983.
Place of birth for U.S.-born residents:
This state: 1,261
Northeast: 16
Midwest: 116
South: 151
65% of the 42079 zip code residents lived in the same house 5 years ago. Out of people who lived in different houses, 46% lived in this county. Out of people who lived in different counties, 50% lived in Kentucky.
96% of the 42079 zip code residents lived in the same house 1 year ago. Out of people who lived in different houses, 88% moved from this county. Out of people who lived in different houses, 19% moved from abroad.
Private vs. public school enrollment:
Students in private schools in grades 1 to 8 (elementary and middle school):
Here:
0.0%
Kentucky:
17.2%
Students in private schools in grades 9 to 12 (high school): 14
Here:
10.6%
Kentucky:
15.2%
Students in private undergraduate colleges:
Here:
0.0%
Kentucky:
19.6%
Occupation by median earnings in the past 12 months ($)
133,671Management occupations
123,975Sales and related occupations
39,474Office and administrative support occupations
33,729Construction and extraction occupations
30,956Production occupations
24,860Farming, fishing, and forestry occupations
Top industries in this zip code by the number of employees in 2005:
Construction: Commercial and Institutional Building Construction (10-19 employees: 1 establishment, 1-4 employees: 1 establishment)
Accommodation and Food Services: Full-Service Restaurants (10-19: 1)
Construction: Framing Contractors (5-9: 1)
Administrative and Support and Waste Management and Remediation Services: Professional Employer Organizations (5-9: 1)
Other Services (except Public Administration): Religious Organizations (1-4: 2)
Health Care and Social Assistance: Offices of Physicians (except Mental Health Specialists) (1-4: 1)
Construction: Drywall and Insulation Contractors (1-4: 1)
People in group quarters in 2000:
3 people in religious group quarters
Fatal accident statistics in 2010:
Fatal accident count: 1
Vehicles involved in fatal accidents: 1
Fatal accidents caused by drunken drivers: 1
Fatalities: 1
Persons involved in fatal accidents: 1
Pedestrians involved in fatal accidents: 0
2002 - 2018 National Fire Incident Reporting System (NFIRS) incidents
Based on the data from the years 2002 - 2018 the average number of fires per year is 13. The highest number of fire incidents - 26 took place in 2011, and the least - 1 in 2017. The data has a declining trend.
When looking into fire subcategories, the most reports belonged to: Structure Fires (43.7%), and Outside Fires (41.0%).
Fire incident types reported to NFIRS in Zip Code 42079


 Nearest zip codes: 42040, 38226, 38241, 42088, 42066, 38224.


 Based on the data from the years 2002 - 2018 the average number of fires per year is 13. The highest number of fire incidents - 26 took place in 2011, and the least - 1 in 2017. The data has a declining trend.
 When looking into fire subcategories, the most reports belonged to: Structure Fires (43.7%), and Outside Fires (41.0%).