Estimated zip code population in 2022: 8,591 Zip code population in 2010: 9,300 Zip code population in 2000: 9,391
Houses and condos: 4,124 Renter-occupied apartments: 925
% of renters here:
25%
State:
31%
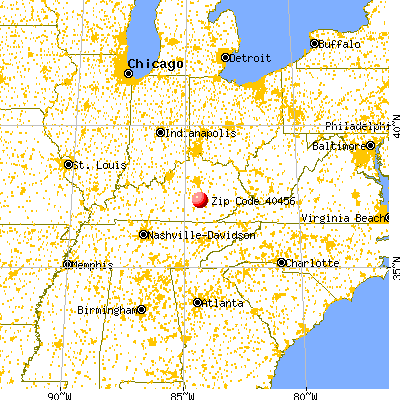
March 2022 cost of living index in zip code 40456: 81.3 (low, U.S. average is 100)
Land area: 172.8 sq. mi. Water area: 0.8 sq. mi.
Population density: 50 people per square mile
(very low).
OSM Map
General Map
Google Map
MSN Map
OSM Map
General Map
Google Map
MSN Map
OSM Map
General Map
Google Map
MSN Map
OSM Map
General Map
Google Map
MSN Map
Please wait while loading the map...
Real estate property taxes paid for housing units in 2022:
This zip code:
0.4% ($576)
Kentucky:
0.7% ($1,456)
Median real estate property taxes paid for housing units with mortgages in 2022: $920 (0.6%) Median real estate property taxes paid for housing units with no mortgage in 2022: $405 (0.4%)
Estimated median house/condo value in 2022: $128,316
40456:
$128,316
Kentucky:
$196,300
According to our research of Kentucky and other state lists, there were 24 registered sex offenders living in 40456 zip code as of May 25, 2024. The ratio of all residents to sex offenders in zip code 40456 is 404 to 1. The ratio of registered sex offenders to all residents in this zip code is near the state average.
Median resident age:
This zip code:
46.4 years
Kentucky median age:
39.4 years
Average household size:
This zip code:
2.2 people
Kentucky:
2.4 people
Averages for the 2020 tax year for zip code 40456, filed in 2021:
Average Adjusted Gross Income (AGI) in 2020: $45,266 (Individual Income Tax Returns)
Here:
$45,266
State:
$61,342
Salary/wage: $39,434 (reported on 83.5% of returns)
Here:
$39,434
State:
$50,827
(% of AGI for various income ranges: 1095.8% for AGIs below $25k, 3521.6% for AGIs $25k-50k, 6312.0% for AGIs $50k-75k, 9274.8% for AGIs $75k-100k, 13862.6% for AGIs $100k-200k)
Taxable interest for individuals: $941 (reported on 23.7% of returns)
This zip code:
$941
Kentucky:
$1,441
(% of AGI for various income ranges: 13.6% for AGIs below $25k, 15.1% for AGIs $25k-50k, 33.4% for AGIs $50k-75k, 37.4% for AGIs $75k-100k, 92.6% for AGIs $100k-200k)
Ordinary dividends: $2,267 (reported on 5.9% of returns)
Here:
$2,267
State:
$7,388
(% of AGI for various income ranges: 4.6% for AGIs below $25k, 2.8% for AGIs $25k-50k, 11.7% for AGIs $50k-75k, 10.4% for AGIs $75k-100k, 174.7% for AGIs $100k-200k)
Net capital gain/loss in AGI: +$10,182 (reported on 6.1% of returns)
Here:
+$10,182
State:
+$19,475
(% of AGI for various income ranges: 4.6% for AGIs below $25k, 8.1% for AGIs $25k-50k, 48.5% for AGIs $50k-75k, 80.9% for AGIs $75k-100k, 916.8% for AGIs $100k-200k)
Profit/loss from business: +$8,476 (reported on 14.2% of returns)
Here:
+$8,476
State:
+$11,386
(% of AGI for various income ranges: 126.1% for AGIs below $25k, 107.2% for AGIs $25k-50k, 54.1% for AGIs $50k-75k, 83.9% for AGIs $75k-100k, 890.5% for AGIs $100k-200k)
Taxable individual retirement arrangement distribution: $13,969 (reported on 4.5% of returns)
40456:
$13,969
Kentucky:
$18,941
(% of AGI for various income ranges: 14.8% for AGIs below $25k, 46.7% for AGIs $25k-50k, 81.2% for AGIs $50k-75k, 216.1% for AGIs $75k-100k, 467.9% for AGIs $100k-200k)
Total itemized deductions: $30,156 (reported on 2.5% of returns)
Here:
$30,156
State:
$32,473
(% of AGI for various income ranges: 284.9% for AGIs $50k-75k, 813.7% for AGIs $100k-200k)
Charity contributions: $13,343 (reported on 2.0% of returns)
Here:
$13,343
State:
$13,472
(% of AGI for various income ranges: 89.8% for AGIs $50k-75k, 297.9% for AGIs $100k-200k)
Taxes paid: $6,389 (reported on 2.5% of returns)
40456:
$6,389
State:
$7,830
(% of AGI for various income ranges: 57.6% for AGIs $50k-75k, 178.4% for AGIs $100k-200k)
Earned income credit: $2,354 (reported on 23.7% of returns)
Here:
$2,354
State:
$2,336
(% of AGI for various income ranges: 114.8% for AGIs below $25k, 95.3% for AGIs $25k-50k)
Percentage of individuals using paid preparers for their 2020 taxes: 96.9%
Here:
97%
State:
94%
(% for various income ranges: 95.9% for AGIs below $25k, 97.9% for AGIs $25k-50k, 96.3% for AGIs $50k-75k, 100.0% for AGIs $75k-100k, 100.0% for AGIs $100k-200k, 80.0% for AGIs over 200k)
Averages for the 2012 tax year for zip code 40456, filed in 2013:
Average Adjusted Gross Income (AGI) in 2012: $36,550 (Individual Income Tax Returns)
Here:
$36,550
State:
$50,814
Salary/wage: $33,395 (reported on 84.7% of returns)
Here:
$33,395
State:
$42,723
(% of AGI for various income ranges: 73.3% for AGIs below $25k, 82.0% for AGIs $25k-50k, 81.7% for AGIs $50k-75k, 80.1% for AGIs $75k-100k, 74.0% for AGIs $100k-200k, 49.6% for AGIs over 200k)
Taxable interest for individuals: $989 (reported on 26.4% of returns)
This zip code:
$989
Kentucky:
$1,381
(% of AGI for various income ranges: 1.0% for AGIs below $25k, 0.8% for AGIs $25k-50k, 0.6% for AGIs $50k-75k, 0.4% for AGIs $75k-100k, 1.1% for AGIs $100k-200k)
Ordinary dividends: $1,495 (reported on 6.3% of returns)
Here:
$1,495
State:
$6,239
(% of AGI for various income ranges: 0.4% for AGIs below $25k, 0.1% for AGIs $25k-50k, 0.1% for AGIs $50k-75k, 0.9% for AGIs $100k-200k)
Net capital gain/loss in AGI: +$3,342 (reported on 9.3% of returns)
Here:
+$3,342
State:
+$11,336
(% of AGI for various income ranges: 0.5% for AGIs below $25k, 0.6% for AGIs $25k-50k, 0.7% for AGIs $50k-75k, 0.5% for AGIs $75k-100k, 2.6% for AGIs $100k-200k)
Profit/loss from business: +$7,151 (reported on 17.1% of returns)
Here:
+$7,151
State:
+$10,862
(% of AGI for various income ranges: 9.2% for AGIs below $25k, 1.9% for AGIs $25k-50k, 0.3% for AGIs $50k-75k, 1.1% for AGIs $75k-100k, 8.0% for AGIs $100k-200k)
Taxable individual retirement arrangement distribution: $8,364 (reported on 4.2% of returns)
40456:
$8,364
Kentucky:
$14,296
(% of AGI for various income ranges: 1.4% for AGIs below $25k, 0.9% for AGIs $25k-50k, 0.6% for AGIs $50k-75k, 2.4% for AGIs $75k-100k)
Total itemized deductions: $18,087 (23% of AGI, reported on 16.5% of returns)
Here:
$18,087
State:
$21,160
Here:
22.9% of AGI
State:
20.0% of AGI
(% of AGI for various income ranges: 2.7% for AGIs below $25k, 5.3% for AGIs $25k-50k, 8.1% for AGIs $50k-75k, 11.4% for AGIs $75k-100k, 14.2% for AGIs $100k-200k, 15.1% for AGIs over 200k)
Charity contributions: $4,577 (reported on 11.7% of returns)
Here:
$4,577
State:
$4,303
(% of AGI for various income ranges: 0.3% for AGIs below $25k, 0.7% for AGIs $25k-50k, 1.1% for AGIs $50k-75k, 2.3% for AGIs $75k-100k, 4.6% for AGIs $100k-200k)
Taxes paid: $6,150 (reported on 16.2% of returns)
40456:
$6,150
State:
$8,496
(% of AGI for various income ranges: 0.4% for AGIs below $25k, 1.2% for AGIs $25k-50k, 2.3% for AGIs $50k-75k, 4.2% for AGIs $75k-100k, 6.3% for AGIs $100k-200k, 6.2% for AGIs over 200k)
Earned income credit: $2,344 (reported on 29.7% of returns)
Here:
$2,344
State:
$2,273
(% of AGI for various income ranges: 9.1% for AGIs below $25k, 1.5% for AGIs $25k-50k)
Percentage of individuals using paid preparers for their 2012 taxes: 72.1%
Here:
72%
State:
60%
(% for various income ranges: 68.3% for AGIs below $25k, 71.7% for AGIs $25k-50k, 81.8% for AGIs $50k-75k, 76.2% for AGIs $75k-100k, 76.9% for AGIs $100k-200k, 100.0% for AGIs over 200k)
Averages for the 2004 tax year for zip code 40456, filed in 2005:
Average Adjusted Gross Income (AGI) in 2004: $29,530 (Individual Income Tax Returns)
Here:
$29,530
State:
$41,540
Salary/wage: $27,997 (reported on 84.6% of returns)
Here:
$27,997
State:
$36,432
(% of AGI for various income ranges: 97.9% for AGIs below $10k, 76.8% for AGIs $10k-25k, 85.5% for AGIs $25k-50k, 84.4% for AGIs $50k-75k, 83.4% for AGIs $75k-100k, 51.6% for AGIs over 100k)
Taxable interest for individuals: $1,178 (reported on 31.6% of returns)
This zip code:
$1,178
Kentucky:
$1,571
(% of AGI for various income ranges: 4.5% for AGIs below $10k, 1.7% for AGIs $10k-25k, 0.9% for AGIs $25k-50k, 0.7% for AGIs $50k-75k, 0.8% for AGIs $75k-100k, 2.3% for AGIs over 100k)
Taxable dividends: $1,131 (reported on 6.7% of returns)
Here:
$1,131
State:
$3,453
(% of AGI for various income ranges: 0.2% for AGIs below $10k, 0.1% for AGIs $10k-25k, 0.2% for AGIs $25k-50k, 0.2% for AGIs $50k-75k, 0.2% for AGIs $75k-100k, 1.1% for AGIs over 100k)
Net capital gain/loss: +$7,384 (reported on 7.9% of returns)
Here:
+$7,384
State:
+$9,663
(% of AGI for various income ranges: 0.7% for AGIs below $10k, 1.0% for AGIs $10k-25k, 0.8% for AGIs $25k-50k, 0.9% for AGIs $50k-75k, 3.8% for AGIs $75k-100k, 8.2% for AGIs over 100k)
Profit/loss from business: +$7,174 (reported on 17.8% of returns)
Here:
+$7,174
State:
+$9,233
(% of AGI for various income ranges: 14.1% for AGIs below $10k, 8.4% for AGIs $10k-25k, 3.2% for AGIs $25k-50k, 2.1% for AGIs $50k-75k, 0.2% for AGIs $75k-100k, 7.0% for AGIs over 100k)
IRA payment deduction: $3,171 (reported on 1.2% of returns)
40456:
$3,171
Kentucky:
$2,955
Total itemized deductions: $14,789 (22% of AGI, reported on 15.6% of returns)
Here:
$14,789
State:
$17,474
Here:
22.1% of AGI
State:
21.0% of AGI
(% of AGI for various income ranges: 3.2% for AGIs $10k-25k, 5.4% for AGIs $25k-50k, 9.9% for AGIs $50k-75k, 14.6% for AGIs $75k-100k, 13.9% for AGIs over 100k)
Charity contributions deductions: $3,814 (5% of AGI, reported on 11.8% of returns)
Here:
$3,814
State:
$3,494
Here:
5.4% of AGI
State:
4.0% of AGI
(% of AGI for various income ranges: 0.5% for AGIs $10k-25k, 0.9% for AGIs $25k-50k, 1.8% for AGIs $50k-75k, 3.1% for AGIs $75k-100k, 3.5% for AGIs over 100k)
Total tax: $3,405 (reported on 68.5% of returns)
40456:
$3,405
State:
$6,162
(% of AGI for various income ranges: 4.3% for AGIs below $10k, 3.9% for AGIs $10k-25k, 6.2% for AGIs $25k-50k, 8.0% for AGIs $50k-75k, 9.8% for AGIs $75k-100k, 18.8% for AGIs over 100k)
Earned income credit: $1,817 (reported on 27.6% of returns)
Here:
$1,817
State:
$1,723
Percentage of individuals using paid preparers for their 2004 taxes: 76.4%
Here:
76%
State:
66%
(% for various income ranges: 71.2% for AGIs below $10k, 77.7% for AGIs $10k-25k, 78.4% for AGIs $25k-50k, 77.7% for AGIs $50k-75k, 77.7% for AGIs $75k-100k, 83.3% for AGIs over 100k)
Household received Food Stamps/SNAP in the past 12 months: 692 Household did not receive Food Stamps/SNAP in the past 12 months: 3,015
Women who had a birth in the past 12 months: 111 (33 now married, 80 unmarried) Women who did not have a birth in the past 12 months: 1,593 (908 now married, 689 unmarried)
Housing units in zip code 40456 with a mortgage: 1,004 (47 second mortgage, 44 both second mortgage and home equity loan) Houses without a mortgage: 12
Median monthly owner costs for units with a mortgage: $945 Median monthly owner costs for units without a mortgage: $348
Residents with income below the poverty level in 2022:
This zip code:
20.4%
Whole state:
16.5%
Residents with income below 50% of the poverty level in 2022:
This zip code:
8.9%
Whole state:
9.0%
Median number of rooms in houses and condos:
Here:
5.9
State:
6.4
Median number of rooms in apartments:
Here:
4.7
State:
4.4
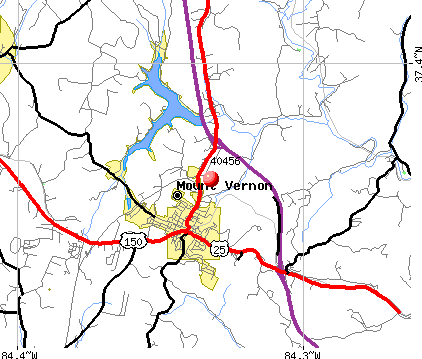
Notable locations in this zip code not listed on our city pages
Notable locations in zip code 40456: Pongo Volunteer Fire Department (A), Mount Vernon Volunteer Fire Department (B), Kentucky Music Hall of Fame and Museum (C), Renfro Valley Barn Dance and Pioneer Museum (D), Rockcastle County Ambulance Service (E). Display/hide their locations on the map
Churches in zip code 40456 include: Climax Church (A), Clear Creek Church (B), Chestnut Ridge Church (C), Calloway Church (D), Brindle Ridge Baptist Church (E), Bible Church (F), Macedonia Church (G), Buffalo Church (H), Wellhope Church (I). Display/hide their locations on the map
Cemeteries: Phelps Cemetery (1), Merritt Cemetery (2), McKinney Cemetery (3), Rimmel Cemetery (4), Hardin Cemetery (5), King and Clark Cemetery (6), Chastine Cemetery (7). Display/hide their locations on the map
Streams, rivers, and creeks: Browne Fork (A), Calloway Branch (B), Clay Lick Branch (C), Clear Creek (D), Davis Branch (E), Dry Fork (F), Eagle Creek (G), East Fork Skegg Creek (H), Holmes Branch (I). Display/hide their locations on the map
In group quarters: 243 (-1 institutionalized population)
Size of family households: 1,193 2-persons, 653 3-persons, 339 4-persons, 188 5-persons, 77 6-persons, 3 7-or-more-persons
Size of nonfamily households: 1,141 1-person, 98 2-persons, 15 3-persons
836 married couples with children.
535 single-parent households (79 men, 456 women).
99.6% of residents of 40456 zip code speak English at home.
0.2% of residents speak Spanish at home (86% very well, 14% not well).
0.3% of residents speak other Indo-European language at home (100% very well).
0.1% of residents speak other language at home (100% very well).
Foreign born population: 14 (0.2%) (100.0% of them are naturalized citizens)
This zip code:
0.2%
Whole state:
4.0%
57%Croatia
36%Bhutan
47%American
15%English
7%German
4%European
3%Irish
2%Scotch-Irish
1%British
Year of entry for the foreign-born population
02010 or later
112000 to 2009
01990 to 1999
17Before 1990
Major facilities with environmental interests located in this zip code:
MOUNT VERNON ELEMENTARY SCHOOL (530 WILLIAMS ST in MT VERNON, KY)
(National Center for Education Statistics) - STATE ID-102511170 Organizations: ROCKCASTLE COUNTY (SCHOOL DISTRICT)
MT VERNON PLASTICS CORP (ROUTE 4 - HIGHWAY 150 in MOUNT VERNON, KY)
National Pollutant Discharge Elimination System NON-MAJOR (Tracking pollutant discharge elimination systems) - permit Conditionally Exempt Small Quantity Generators, less than 100 kg/month of hazardous waste (Resource Conservation and Recovery Act (tracking hazardous waste)) - notification Business SIC classification: PLASTICS PRODUCTS Business NAICS classification: ALL OTHER PLASTICS PRODUCT MANUFACTURING. Organizations: N/A (CONTACT/OPERATOR)
, ALCOA (CONTACT/OWNER)
, REYNOLDS FOOD PACKAGING, LLC (CONTACT/OWNER)
MT VERNON STP (390 NEWCOMB AVE in MT VERNON, KY)
National Pollutant Discharge Elimination System NON-MAJOR (Tracking pollutant discharge elimination systems) - permit National Pollutant Discharge Elimination System NON-MAJOR (Tracking pollutant discharge elimination systems) - permit Business SIC classification: SEWERAGE SYSTEMS; MANAGEMENT SERVICES
BISHOP TIRE SERVICE (495 RICHMOND ST in MT VERNON, KY)
(Resource Conservation and Recovery Act (tracking hazardous waste)) Organizations: BOBBY BISHOP (CONTACT/OWNER)
BURR HILL GULF (HWY 25 EXIT 59 I-75 in MT VERNON, KY)
(Resource Conservation and Recovery Act (tracking hazardous waste)) Organizations: CYNTHIA KING (CONTACT/OWNER)
CLARK'S GENERAL STORE (HWY 2618 in MT VERNON, KY)
(Resource Conservation and Recovery Act (tracking hazardous waste)) Organizations: WILLIAM CLARK (CONTACT/OWNER)
MT VERNON BARGE SERVICE INC (FOOT OF CANAL ST ACROSS RIVER in MT VERNON, KY)
National Pollutant Discharge Elimination System NON-MAJOR (Tracking pollutant discharge elimination systems) - permit Business SIC classification: MARINE CARGO HANDLING
MT VERNON OIL & TIRE (#75 HWY 150 in MT VERNON, KY)
(Resource Conservation and Recovery Act (tracking hazardous waste)) Organizations: MT VERNON OIL & TIRE INC (CONTACT/OWNER)
MT VERNON WTP (135 WATER PLANT RD in MOUNT VERNON, KY)
National Pollutant Discharge Elimination System NON-MAJOR (Tracking pollutant discharge elimination systems) - permit Business SIC classification: WATER SUPPLY Alternative names: MT. VERNON WATER TREATMENT PLANT
KTC ROCKCASTLE CO MAINT GARAGE (US 25 & KY 2224 in MT VERNON, KY)
National Pollutant Discharge Elimination System NON-MAJOR (Tracking pollutant discharge elimination systems) - permit Business SIC classification: TERMINAL AND SERVICE FACILITIES FOR MOTOR VEHICLE PASSENGER TRANSPORTATION
KYDOH FE02-102-0075-054.48(B39) (SAND HILL RD OVER I-75 in MT VERNON, KY)
(Resource Conservation and Recovery Act (tracking hazardous waste)) Organizations: KY TRANS CAB, DEPT OF HIGHWAYS (CONTACT/OWNER)
KYDOH FE02-102-0075-062.01(B37) (I-75 OVER US 25 in MT VERNON, KY)
(Resource Conservation and Recovery Act (tracking hazardous waste)) Organizations: KY TRANS CAB, DEPT OF HIGHWAYS (CONTACT/OWNER)
KYDOH FE02-102-0075-062.65(B36) (I-75 OVER GREEN HILL RD in MT VERNON, KY)
(Resource Conservation and Recovery Act (tracking hazardous waste)) Organizations: KY TRANS CAB, DEPT OF HIGHWAYS (CONTACT/OWNER)
Housing units lacking complete plumbing facilities: 3.9% Housing units lacking complete kitchen facilities: 3.8%
78.4%Electricity
10.5%Bottled, tank, or LP gas
6.8%Wood
2.2%Fuel oil, kerosene, etc.
1.0%Utility gas
1.0%Other fuel
Population in 1990: 5,636. Population change in the 1990s: +3,755 (+66.6%).
Place of birth for U.S.-born residents:
This state: 6,994
Northeast: 128
Midwest: 787
South: 532
West: 61
62% of the 40456 zip code residents lived in the same house 5 years ago. Out of people who lived in different houses, 60% lived in this county. Out of people who lived in different counties, 50% lived in Kentucky.
90% of the 40456 zip code residents lived in the same house 1 year ago. Out of people who lived in different houses, 20% moved from this county. Out of people who lived in different houses, 65% moved from different county within same state. Out of people who lived in different houses, 17% moved from different state.
Private vs. public school enrollment:
Students in private schools in grades 1 to 8 (elementary and middle school): 4
Here:
0.7%
Kentucky:
17.2%
Students in private schools in grades 9 to 12 (high school):
Here:
0.0%
Kentucky:
15.2%
Students in private undergraduate colleges: 15
Here:
13.3%
Kentucky:
19.6%
Occupation by median earnings in the past 12 months ($)
114,744Health diagnosing and treating practitioners and other technical occupations
70,437Transportation occupations
67,449Installation, maintenance, and repair occupations
66,947Architecture and engineering occupations
60,217Management occupations
50,159Production occupations
Top industries in this zip code by the number of employees in 2005:
Health Care and Social Assistance: General Medical and Surgical Hospitals (250-499 employees: 1 establishment)
Accommodation and Food Services: Full-Service Restaurants (20-49: 3, 10-19: 1)
Accommodation and Food Services: Hotels (except Casino Hotels) and Motels (20-49: 1, 10-19: 2, 1-4: 1)
People in group quarters in 2010:
102 people in local jails and other municipal confinement facilities
88 people in nursing facilities/skilled-nursing facilities
33 people in emergency and transitional shelters (with sleeping facilities) for people experiencing homelessness
12 people in residential treatment centers for adults
11 people in group homes intended for adults
People in group quarters in 2000:
90 people in local jails and other confinement facilities (including police lockups)
72 people in nursing homes
29 people in other group homes
4 people in other noninstitutional group quarters
3 people in schools, hospitals, or wards for the intellectually disabled
Fatal accident statistics in 2014:
Fatal accident count: 2
Vehicles involved in fatal accidents: 2
Fatal accidents caused by drunken drivers: 0
Fatalities: 2
Persons involved in fatal accidents: 4
Pedestrians involved in fatal accidents: 0
Fatal accident statistics in 2013:
Fatal accident count: 2
Vehicles involved in fatal accidents: 4
Fatal accidents caused by drunken drivers: 0
Fatalities: 2
Persons involved in fatal accidents: 5
Pedestrians involved in fatal accidents: 0
2002 - 2018 National Fire Incident Reporting System (NFIRS) incidents
According to the data from the years 2002 - 2018 the average number of fire incidents per year is 56. The highest number of fire incidents - 100 took place in 2016, and the least - 4 in 2003. The data has a growing trend.
When looking into fire subcategories, the most reports belonged to: Structure Fires (45.4%), and Outside Fires (29.8%).
Fire incident types reported to NFIRS in Zip Code 40456


 Nearest zip codes: 40460, 40409, 40445, 40419, 40729, 40404.


 According to the data from the years 2002 - 2018 the average number of fire incidents per year is 56. The highest number of fire incidents - 100 took place in 2016, and the least - 4 in 2003. The data has a growing trend.
 When looking into fire subcategories, the most reports belonged to: Structure Fires (45.4%), and Outside Fires (29.8%).