Estimated zip code population in 2022: 3,310 Zip code population in 2010: 3,328 Zip code population in 2000: 3,274
Houses and condos: 1,650 Renter-occupied apartments: 354
% of renters here:
28%
State:
31%
March 2022 cost of living index in zip code 40322: 80.7 (low, U.S. average is 100)
Land area: 116.8 sq. mi. Water area: 0.6 sq. mi.
Population density: 28 people per square mile
(very low).
OSM Map
General Map
Google Map
MSN Map
OSM Map
General Map
Google Map
MSN Map
OSM Map
General Map
Google Map
MSN Map
OSM Map
General Map
Google Map
MSN Map
Please wait while loading the map...
Real estate property taxes paid for housing units in 2022:
This zip code:
0.4% ($533)
Kentucky:
0.7% ($1,456)
Median real estate property taxes paid for housing units with mortgages in 2022: $556 (0.5%) Median real estate property taxes paid for housing units with no mortgage in 2022: $521 (0.3%)
Business Search- 14 Million verified businesses
Males: 1,667
(50.4%)
Females: 1,643
(49.6%)
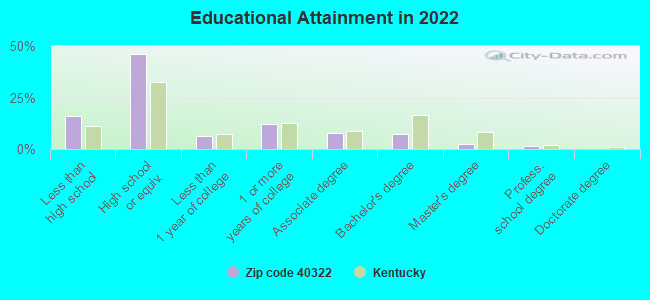
For population 25 years and over in 40322:
High school or higher: 82.6%
Bachelor's degree or higher: 11.3%
Graduate or professional degree: 3.9%
Unemployed: 5.1%
Mean travel time to work (commute): 41.5 minutes
For population 15 years and over in 40322:
Never married: 32.2%
Now married: 41.8%
Separated: 1.1%
Widowed: 12.4%
Divorced: 12.5%
Zip code 40322 compared to state average:
Median house value below state average.
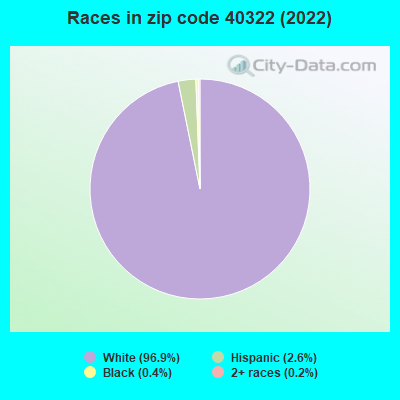
Black race population percentage significantly below state average.
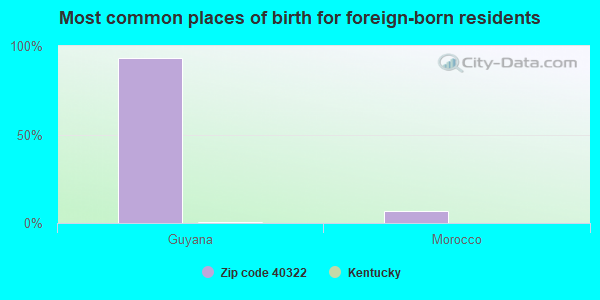
Foreign-born population percentage significantly below state average.
House age below state average.
Number of college students below state average.
Percentage of population with a bachelor's degree or higher significantly below state average.
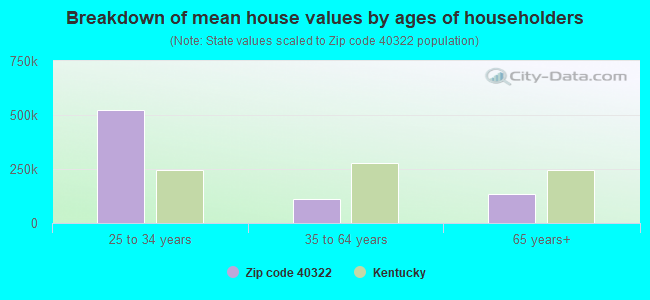
Estimated median house/condo value in 2022: $128,427
40322:
$128,427
Kentucky:
$196,300
According to our research of Kentucky and other state lists, there were 5 registered sex offenders living in 40322 zip code as of May 24, 2024. The ratio of all residents to sex offenders in zip code 40322 is 612 to 1. The ratio of registered sex offenders to all residents in this zip code is lower than the state average.
Median resident age:
This zip code:
39.1 years
Kentucky median age:
39.4 years
Average household size:
This zip code:
2.5 people
Kentucky:
2.4 people
Averages for the 2020 tax year for zip code 40322, filed in 2021:
Average Adjusted Gross Income (AGI) in 2020: $40,248 (Individual Income Tax Returns)
Here:
$40,248
State:
$61,342
Salary/wage: $37,858 (reported on 80.2% of returns)
Here:
$37,858
State:
$50,827
(% of AGI for various income ranges: 1102.5% for AGIs below $25k, 3358.6% for AGIs $25k-50k, 6219.3% for AGIs $50k-75k, 9567.1% for AGIs $75k-100k, 16122.0% for AGIs $100k-200k)
Taxable interest for individuals: $221 (reported on 19.0% of returns)
This zip code:
$221
Kentucky:
$1,441
(% of AGI for various income ranges: 5.0% for AGIs below $25k, 1.4% for AGIs $25k-50k, 13.3% for AGIs $50k-75k, 5.7% for AGIs $75k-100k, 10.0% for AGIs $100k-200k)
Ordinary dividends: $925 (reported on 3.2% of returns)
Here:
$925
State:
$7,388
(% of AGI for various income ranges: 24.7% for AGIs $50k-75k)
Net capital gain/loss in AGI: +$7,800 (reported on 4.8% of returns)
Here:
+$7,800
State:
+$19,475
(% of AGI for various income ranges: 51.7% for AGIs $25k-50k, 454.3% for AGIs $75k-100k)
Profit/loss from business: +$4,508 (reported on 19.0% of returns)
Here:
+$4,508
State:
+$11,386
(% of AGI for various income ranges: 160.2% for AGIs below $25k, 104.5% for AGIs $25k-50k, 67.3% for AGIs $50k-75k, 128.6% for AGIs $75k-100k)
Taxable individual retirement arrangement distribution: $11,475 (reported on 3.2% of returns)
40322:
$11,475
Kentucky:
$18,941
(% of AGI for various income ranges: 306.0% for AGIs $50k-75k)
Earned income credit: $2,382 (reported on 27.0% of returns)
Here:
$2,382
State:
$2,336
(% of AGI for various income ranges: 129.2% for AGIs below $25k, 101.0% for AGIs $25k-50k)
Percentage of individuals using paid preparers for their 2020 taxes: 97.6%
Here:
98%
State:
94%
(% for various income ranges: 96.3% for AGIs below $25k, 97.1% for AGIs $25k-50k, 100.0% for AGIs $50k-75k, 100.0% for AGIs $75k-100k, 100.0% for AGIs $100k-200k)
Averages for the 2012 tax year for zip code 40322, filed in 2013:
Average Adjusted Gross Income (AGI) in 2012: $33,509 (Individual Income Tax Returns)
Here:
$33,509
State:
$50,814
Salary/wage: $30,819 (reported on 83.5% of returns)
Here:
$30,819
State:
$42,723
(% of AGI for various income ranges: 70.1% for AGIs below $25k, 83.5% for AGIs $25k-50k, 85.4% for AGIs $50k-75k, 76.2% for AGIs $75k-100k, 54.0% for AGIs $100k-200k)
Taxable interest for individuals: $715 (reported on 22.6% of returns)
This zip code:
$715
Kentucky:
$1,381
(% of AGI for various income ranges: 0.5% for AGIs below $25k, 0.9% for AGIs $25k-50k, 0.3% for AGIs $50k-75k, 0.2% for AGIs $75k-100k, 0.2% for AGIs $100k-200k)
Ordinary dividends: $540 (reported on 4.3% of returns)
Here:
$540
State:
$6,239
Net capital gain/loss in AGI: +$2,878 (reported on 7.8% of returns)
Here:
+$2,878
State:
+$11,336
(% of AGI for various income ranges: 0.3% for AGIs below $25k, 0.8% for AGIs $25k-50k, 1.4% for AGIs $50k-75k)
Profit/loss from business: +$4,721 (reported on 20.9% of returns)
Here:
+$4,721
State:
+$10,862
(% of AGI for various income ranges: 14.6% for AGIs below $25k, 0.6% for AGIs $25k-50k, 0.9% for AGIs $50k-75k)
Taxable individual retirement arrangement distribution: $6,233 (reported on 5.2% of returns)
40322:
$6,233
Kentucky:
$14,296
(% of AGI for various income ranges: 1.6% for AGIs below $25k, 2.3% for AGIs $25k-50k)
Total itemized deductions: $16,512 (26% of AGI, reported on 13.9% of returns)
Here:
$16,512
State:
$21,160
Here:
26.3% of AGI
State:
20.0% of AGI
(% of AGI for various income ranges: 7.0% for AGIs $25k-50k, 8.7% for AGIs $50k-75k, 10.1% for AGIs $75k-100k, 9.2% for AGIs $100k-200k)
Charity contributions: $2,910 (reported on 8.7% of returns)
Here:
$2,910
State:
$4,303
(% of AGI for various income ranges: 0.7% for AGIs $25k-50k, 0.9% for AGIs $50k-75k, 2.3% for AGIs $75k-100k)
Taxes paid: $4,462 (reported on 13.9% of returns)
40322:
$4,462
State:
$8,496
(% of AGI for various income ranges: 1.4% for AGIs $25k-50k, 2.4% for AGIs $50k-75k, 6.2% for AGIs $75k-100k)
Earned income credit: $2,472 (reported on 33.9% of returns)
Here:
$2,472
State:
$2,273
(% of AGI for various income ranges: 11.0% for AGIs below $25k, 1.7% for AGIs $25k-50k)
Percentage of individuals using paid preparers for their 2012 taxes: 83.5%
Here:
83%
State:
60%
(% for various income ranges: 82.5% for AGIs below $25k, 84.8% for AGIs $25k-50k, 81.2% for AGIs $50k-75k, 83.3% for AGIs $75k-100k, 100.0% for AGIs $100k-200k)
Averages for the 2004 tax year for zip code 40322, filed in 2005:
Average Adjusted Gross Income (AGI) in 2004: $26,982 (Individual Income Tax Returns)
Here:
$26,982
State:
$41,540
Salary/wage: $26,182 (reported on 84.6% of returns)
Here:
$26,182
State:
$36,432
(% of AGI for various income ranges: 84.3% for AGIs below $10k, 80.2% for AGIs $10k-25k, 85.0% for AGIs $25k-50k, 86.2% for AGIs $50k-75k, 85.8% for AGIs $75k-100k, 49.6% for AGIs over 100k)
Taxable interest for individuals: $1,304 (reported on 27.9% of returns)
This zip code:
$1,304
Kentucky:
$1,571
(% of AGI for various income ranges: 4.0% for AGIs below $10k, 1.5% for AGIs $10k-25k, 1.7% for AGIs $25k-50k, 0.8% for AGIs $50k-75k, 0.3% for AGIs $75k-100k, 0.7% for AGIs over 100k)
Taxable dividends: $365 (reported on 4.4% of returns)
Here:
$365
State:
$3,453
Net capital gain/loss: +$3,585 (reported on 5.5% of returns)
Here:
+$3,585
State:
+$9,663
Profit/loss from business: +$4,944 (reported on 21.2% of returns)
Here:
+$4,944
State:
+$9,233
(% of AGI for various income ranges: 15.7% for AGIs below $10k, 7.0% for AGIs $10k-25k, 3.6% for AGIs $25k-50k, 2.1% for AGIs $50k-75k)
IRA payment deduction: $2,800 (reported on 0.8% of returns)
40322:
$2,800
Kentucky:
$2,955
Total itemized deductions: $14,041 (28% of AGI, reported on 16.4% of returns)
Here:
$14,041
State:
$17,474
Here:
27.7% of AGI
State:
21.0% of AGI
(% of AGI for various income ranges: 6.3% for AGIs $10k-25k, 7.8% for AGIs $25k-50k, 11.2% for AGIs $50k-75k, 11.2% for AGIs $75k-100k, 11.1% for AGIs over 100k)
Charity contributions deductions: $2,277 (4% of AGI, reported on 11.9% of returns)
Here:
$2,277
State:
$3,494
Here:
4.4% of AGI
State:
4.0% of AGI
(% of AGI for various income ranges: 1.0% for AGIs $10k-25k, 0.7% for AGIs $25k-50k, 1.2% for AGIs $50k-75k, 3.0% for AGIs $75k-100k)
Total tax: $2,693 (reported on 66.9% of returns)
40322:
$2,693
State:
$6,162
(% of AGI for various income ranges: 4.0% for AGIs below $10k, 3.3% for AGIs $10k-25k, 5.6% for AGIs $25k-50k, 7.9% for AGIs $50k-75k, 10.8% for AGIs $75k-100k, 15.6% for AGIs over 100k)
Earned income credit: $1,904 (reported on 30.5% of returns)
Here:
$1,904
State:
$1,723
Percentage of individuals using paid preparers for their 2004 taxes: 80.2%
Here:
80%
State:
66%
(% for various income ranges: 72.6% for AGIs below $10k, 83.1% for AGIs $10k-25k, 82.4% for AGIs $25k-50k, 83.2% for AGIs $50k-75k, 83.9% for AGIs $75k-100k, 71.4% for AGIs over 100k)
Household received Food Stamps/SNAP in the past 12 months: 289 Household did not receive Food Stamps/SNAP in the past 12 months: 985
Women who had a birth in the past 12 months: 66 (4 now married, 65 unmarried) Women who did not have a birth in the past 12 months: 630 (267 now married, 363 unmarried)
Housing units in zip code 40322 with a mortgage: 343 (30 second mortgage, 13 both second mortgage and home equity loan) Median monthly owner costs for units with a mortgage: $804 Median monthly owner costs for units without a mortgage: $340
Residents with income below the poverty level in 2022:
This zip code:
27.0%
Whole state:
16.5%
Residents with income below 50% of the poverty level in 2022:
This zip code:
19.2%
Whole state:
9.0%
Median number of rooms in houses and condos:
Here:
5.8
State:
6.4
Median number of rooms in apartments:
Here:
5.0
State:
4.4
Notable locations in this zip code not listed on our city pages
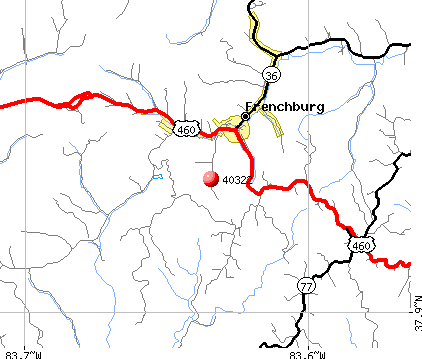
Notable locations in zip code 40322: Leatherwood Boat Ramp (A), Tarr Ridge Picnic Area (B), Longbow Marina (C), Amos Cut (D), Frenchburg Correctional Facility (E), Indian Stairway (F), Travelers Rest (G), Frenchburg Fire Department (H), United States Weather Station (I), Menifee County Ambulance Service (J). Display/hide their locations on the map
Churches in zip code 40322 include: Bethel Church (A), Fagan Pentecostal Church of God (B), Cornwell Christian Church (C), Tarr Ridge Church (D), Laurel Springs Baptist Church (E), Kendrick Ridge Church (F), Mariba Church of God (G), Indian Creek Church (H), Hill Top Church of God (I). Display/hide their locations on the map
Cemeteries: Barker Cemetery (1), Patrick Cemetery (2), Bashford Cemetery (3), McCausey Ridge Cemetery (4), Jewell Cemetery (5), Ingram Cemetery (6), Hatton Cemetery (7). Display/hide their locations on the map
Streams, rivers, and creeks: Bull Fork (A), Cain Branch (B), Camp Branch (C), Cape Branch (D), Cave Branch (E), Clem Branch (F), Coldiron Fork (G), Commissary Branch (H), Cornwell Branch (I). Display/hide their locations on the map
FERRELLS LOGGING & LUMBER INC ( in FRENCHBURG, KY)
National Pollutant Discharge Elimination System NON-MAJOR (Tracking pollutant discharge elimination systems) - permit Business SIC classification: SAWMILLS AND PLANING MILLS, GENERAL
FRENCHBURG JOB CORPS CENTER (6969 TARR RIDGE RD in FRENCHBURG, KY) . Federal Facility. DEPARTMENT OF LABOR
National Pollutant Discharge Elimination System NON-MAJOR (Tracking pollutant discharge elimination systems) - permit Business SIC classification: LAND, MINERAL, WILDLIFE, AND FOREST CONSERVATION Organizations: FRENCHBURG CCC (CONTACT/OWNER)
Alternative names: FRENCHBURG CCC, FRENCHBURG CIVIL CON CTR
FRENCHBURG STP (KY HWY 1274 in FRENCHBURG, KY)
National Pollutant Discharge Elimination System NON-MAJOR (Tracking pollutant discharge elimination systems) - permit Business SIC classification: SEWERAGE SYSTEMS
KTC MENIFEE CO MAINT GARAGE (KY 36 WEST OF US 60 in FRENCHBURG, KY)
National Pollutant Discharge Elimination System NON-MAJOR (Tracking pollutant discharge elimination systems) - permit Business SIC classification: TERMINAL AND SERVICE FACILITIES FOR MOTOR VEHICLE PASSENGER TRANSPORTATION
Housing units lacking complete plumbing facilities: 4.6% Housing units lacking complete kitchen facilities: 4.0%
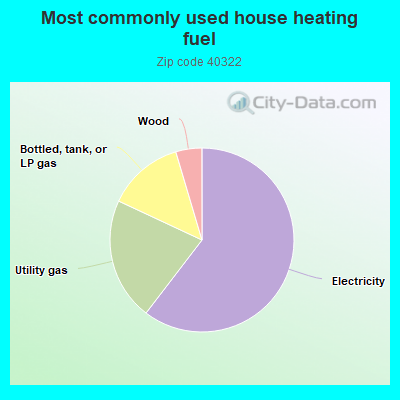
60.6%Electricity
21.6%Utility gas
13.5%Bottled, tank, or LP gas
4.6%Wood
Population in 1990: 3,175. Population change in the 1990s: +99 (+3.1%).
Place of birth for U.S.-born residents:
This state: 2,577
Northeast: 156
Midwest: 349
South: 196
West: 2
61% of the 40322 zip code residents lived in the same house 5 years ago. Out of people who lived in different houses, 44% lived in this county. Out of people who lived in different counties, 50% lived in Kentucky.
88% of the 40322 zip code residents lived in the same house 1 year ago. Out of people who lived in different houses, 36% moved from this county. Out of people who lived in different houses, 61% moved from different county within same state. Out of people who lived in different houses, 0% moved from different state.
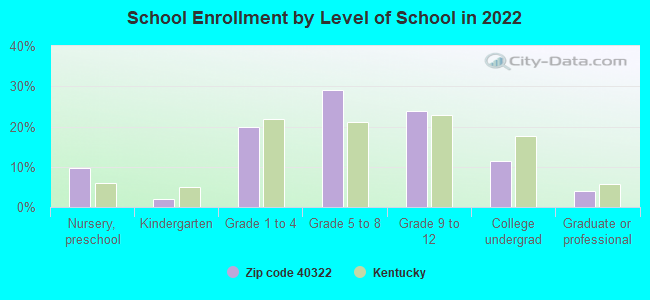
Private vs. public school enrollment:
Students in private schools in grades 1 to 8 (elementary and middle school):
Here:
0.0%
Kentucky:
17.2%
Students in private schools in grades 9 to 12 (high school): 4
Here:
3.5%
Kentucky:
15.2%
Students in private undergraduate colleges: 18
Here:
29.8%
Kentucky:
19.6%
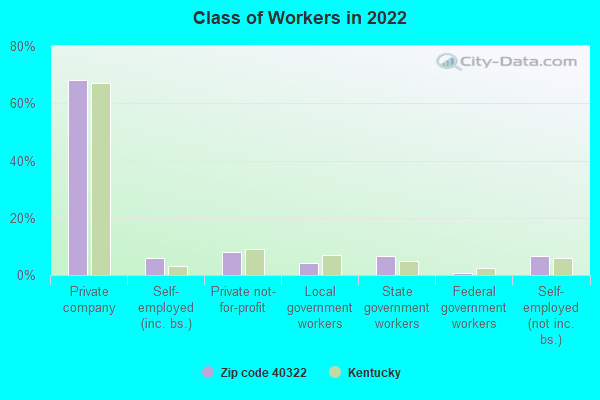
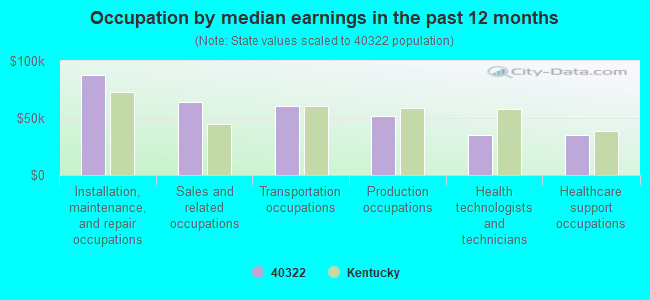
Occupation by median earnings in the past 12 months ($)
87,290Installation, maintenance, and repair occupations
64,446Sales and related occupations
60,242Transportation occupations
51,998Production occupations
34,989Health technologists and technicians
34,836Healthcare support occupations
Top industries in this zip code by the number of employees in 2005:
Health Care and Social Assistance: Nursing Care Facilities (50-99 employees: 1 establishment)
Health Care and Social Assistance: Community Food Services (20-49: 1)
Health Care and Social Assistance: All Other Outpatient Care Centers (10-19: 1, 5-9: 1)
Finance and Insurance: Commercial Banking (10-19: 1)
People in group quarters in 2010:
155 people in workers' group living quarters and job corps centers
69 people in nursing facilities/skilled-nursing facilities
People in group quarters in 2000:
168 people in job corps and vocational training facilities
65 people in nursing homes
10 people in training schools for juvenile delinquents
Fatal accident statistics in 2014:
Fatal accident count: 1
Vehicles involved in fatal accidents: 3
Fatal accidents caused by drunken drivers: 0
Fatalities: 1
Persons involved in fatal accidents: 3
Pedestrians involved in fatal accidents: 0
Fatal accident statistics in 2011:
Fatal accident count: 3
Vehicles involved in fatal accidents: 4
Fatal accidents caused by drunken drivers: 0
Fatalities: 3
Persons involved in fatal accidents: 7
Pedestrians involved in fatal accidents: 0
2004 - 2018 National Fire Incident Reporting System (NFIRS) incidents
Based on the data from the years 2004 - 2018 the average number of fire incidents per year is 10. The highest number of reported fire incidents - 20 took place in 2009, and the least - 0 in 2005. The data has an increasing trend.
When looking into fire subcategories, the most reports belonged to: Structure Fires (46.7%), and Outside Fires (30.3%).
Fire incident types reported to NFIRS in Zip Code 40322

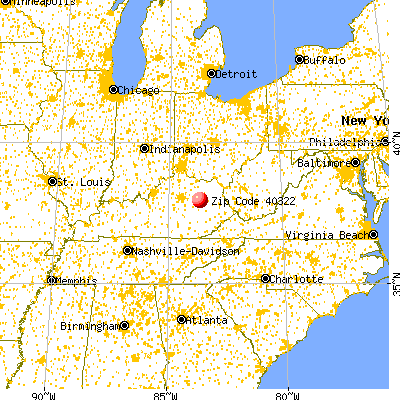


 Nearest zip codes: 40316, 40346, 40358, 41360, 40387, 40334.
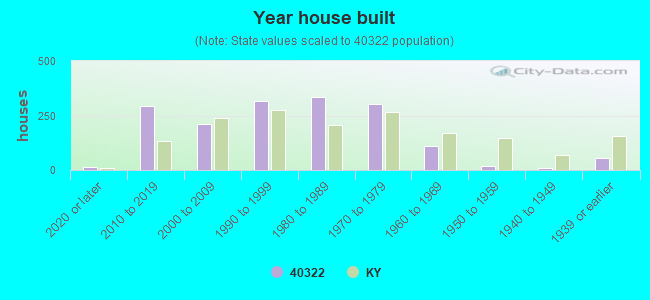


 Based on the data from the years 2004 - 2018 the average number of fire incidents per year is 10. The highest number of reported fire incidents - 20 took place in 2009, and the least - 0 in 2005. The data has an increasing trend.
 When looking into fire subcategories, the most reports belonged to: Structure Fires (46.7%), and Outside Fires (30.3%).