Estimated zip code population in 2022: 19,534
Zip code population in 2010: 22,287
Zip code population in 2000: 25,137
Houses and condos: 9,172
Renter-occupied apartments: 4,557
% of renters here:
57%State:
31%
March 2022 cost of living index in zip code 40215: 87.0
(less than average, U.S. average is 100)
Land area: 3.8
sq. mi.
Water area: 0.0
sq. mi.
Population density: 5,208 people per square mile (average).
OSM Map
General Map
Google Map
MSN Map
OSM Map
General Map
Google Map
MSN Map
OSM Map
General Map
Google Map
MSN Map
OSM Map
General Map
Google Map
MSN Map
Please wait while loading the map...
Real estate property taxes paid for housing units in 2022:
This zip code:
1.0% ($1,085)Kentucky:
0.7% ($1,456)
Median real estate property taxes paid for housing units with mortgages in 2022: $1,147 (1.0%)
Median real estate property taxes paid for housing units with no mortgage in 2022: $931 (1.0%)
Profiles of local businesses
Business Search - 14 Million verified businesses
Males: 10,134 Females: 9,397
For population 25 years and over in 40215:
High school or higher: 76.0%Bachelor's degree or higher: 11.2%Graduate or professional degree: 3.8%Unemployed: 7.1%Mean travel time to work (commute): 21.6 minutes
For population 15 years and over in 40215:
Never married: 46.9%Now married: 28.1%Separated: 3.7%Widowed: 6.7%Divorced: 14.6%
Zip code 40215 compared to state average:
Median house value below state average. Black race population percentage significantly above state average. Foreign-born population percentage above state average. Renting percentage above state average. Length of stay since moving in significantly above state average. Number of rooms per house below state average. House age above state average. Number of college students below state average. Percentage of population with a bachelor's degree or higher significantly below state average. 9,931 50.8% White 6,577 33.7% Black 1,266 6.5% Two or more races 1,144 5.9% Hispanic or Latino 480 2.5% Asian 122 0.6% Some other race 11 0.06% American Indian
Data:
Median household income ($)
Median household income (% change since 2000)
Household income diversity
Ratio of average income to average house value (%)
Ratio of average income to average rent
Median household income ($) - White
Median household income ($) - Black or African American
Median household income ($) - Asian
Median household income ($) - Hispanic or Latino
Median household income ($) - American Indian and Alaska Native
Median household income ($) - Multirace
Median household income ($) - Other Race
Median household income for houses/condos with a mortgage ($)
Median household income for apartments without a mortgage ($)
Races - White alone (%)
Races - White alone (% change since 2000)
Races - Black alone (%)
Races - Black alone (% change since 2000)
Races - American Indian alone (%)
Races - American Indian alone (% change since 2000)
Races - Asian alone (%)
Races - Asian alone (% change since 2000)
Races - Hispanic (%)
Races - Hispanic (% change since 2000)
Races - Native Hawaiian and Other Pacific Islander alone (%)
Races - Native Hawaiian and Other Pacific Islander alone (% change since 2000)
Races - Two or more races (%)
Races - Two or more races (% change since 2000)
Races - Other race alone (%)
Races - Other race alone (% change since 2000)
Racial diversity
Unemployment (%)
Unemployment (% change since 2000)
Unemployment (%) - White
Unemployment (%) - Black or African American
Unemployment (%) - Asian
Unemployment (%) - Hispanic or Latino
Unemployment (%) - American Indian and Alaska Native
Unemployment (%) - Multirace
Unemployment (%) - Other Race
Population density (people per square mile)
Population - Males (%)
Population - Females (%)
Population - Males (%) - White
Population - Males (%) - Black or African American
Population - Males (%) - Asian
Population - Males (%) - Hispanic or Latino
Population - Males (%) - American Indian and Alaska Native
Population - Males (%) - Multirace
Population - Males (%) - Other Race
Population - Females (%) - White
Population - Females (%) - Black or African American
Population - Females (%) - Asian
Population - Females (%) - Hispanic or Latino
Population - Females (%) - American Indian and Alaska Native
Population - Females (%) - Multirace
Population - Females (%) - Other Race
Coronavirus confirmed cases (Jun 04, 2024)
Deaths caused by coronavirus (Jun 04, 2024)
Coronavirus confirmed cases (per 100k population) (Jun 04, 2024)
Deaths caused by coronavirus (per 100k population) (Jun 04, 2024)
Daily increase in number of cases (Jun 04, 2024)
Weekly increase in number of cases (Jun 04, 2024)
Cases doubled (in days) (Jun 04, 2024)
Hospitalized patients (Apr 18, 2022)
Negative test results (Apr 18, 2022)
Total test results (Apr 18, 2022)
COVID Vaccine doses distributed (per 100k population) (Sep 19, 2023)
COVID Vaccine doses administered (per 100k population) (Sep 19, 2023)
COVID Vaccine doses distributed (Sep 19, 2023)
COVID Vaccine doses administered (Sep 19, 2023)
Likely homosexual households (%)
Likely homosexual households (% change since 2000)
Likely homosexual households - Lesbian couples (%)
Likely homosexual households - Lesbian couples (% change since 2000)
Likely homosexual households - Gay men (%)
Likely homosexual households - Gay men (% change since 2000)
Cost of living index
Median gross rent ($)
Median contract rent ($)
Median monthly housing costs ($)
Median house or condo value ($)
Median house or condo value ($ change since 2000)
Mean house or condo value by units in structure - 1, detached ($)
Mean house or condo value by units in structure - 1, attached ($)
Mean house or condo value by units in structure - 2 ($)
Mean house or condo value by units in structure by units in structure - 3 or 4 ($)
Mean house or condo value by units in structure - 5 or more ($)
Mean house or condo value by units in structure - Boat, RV, van, etc. ($)
Mean house or condo value by units in structure - Mobile home ($)
Median house or condo value ($) - White
Median house or condo value ($) - Black or African American
Median house or condo value ($) - Asian
Median house or condo value ($) - Hispanic or Latino
Median house or condo value ($) - American Indian and Alaska Native
Median house or condo value ($) - Multirace
Median house or condo value ($) - Other Race
Median resident age
Resident age diversity
Median resident age - Males
Median resident age - Females
Median resident age - White
Median resident age - Black or African American
Median resident age - Asian
Median resident age - Hispanic or Latino
Median resident age - American Indian and Alaska Native
Median resident age - Multirace
Median resident age - Other Race
Median resident age - Males - White
Median resident age - Males - Black or African American
Median resident age - Males - Asian
Median resident age - Males - Hispanic or Latino
Median resident age - Males - American Indian and Alaska Native
Median resident age - Males - Multirace
Median resident age - Males - Other Race
Median resident age - Females - White
Median resident age - Females - Black or African American
Median resident age - Females - Asian
Median resident age - Females - Hispanic or Latino
Median resident age - Females - American Indian and Alaska Native
Median resident age - Females - Multirace
Median resident age - Females - Other Race
Commute - mean travel time to work (minutes)
Travel time to work - Less than 5 minutes (%)
Travel time to work - Less than 5 minutes (% change since 2000)
Travel time to work - 5 to 9 minutes (%)
Travel time to work - 5 to 9 minutes (% change since 2000)
Travel time to work - 10 to 19 minutes (%)
Travel time to work - 10 to 19 minutes (% change since 2000)
Travel time to work - 20 to 29 minutes (%)
Travel time to work - 20 to 29 minutes (% change since 2000)
Travel time to work - 30 to 39 minutes (%)
Travel time to work - 30 to 39 minutes (% change since 2000)
Travel time to work - 40 to 59 minutes (%)
Travel time to work - 40 to 59 minutes (% change since 2000)
Travel time to work - 60 to 89 minutes (%)
Travel time to work - 60 to 89 minutes (% change since 2000)
Travel time to work - 90 or more minutes (%)
Travel time to work - 90 or more minutes (% change since 2000)
Marital status - Never married (%)
Marital status - Now married (%)
Marital status - Separated (%)
Marital status - Widowed (%)
Marital status - Divorced (%)
Median family income ($)
Median family income (% change since 2000)
Median non-family income ($)
Median non-family income (% change since 2000)
Median per capita income ($)
Median per capita income (% change since 2000)
Median family income ($) - White
Median family income ($) - Black or African American
Median family income ($) - Asian
Median family income ($) - Hispanic or Latino
Median family income ($) - American Indian and Alaska Native
Median family income ($) - Multirace
Median family income ($) - Other Race
Median year house/condo built
Median year apartment built
Year house built - Built 2005 or later (%)
Year house built - Built 2000 to 2004 (%)
Year house built - Built 1990 to 1999 (%)
Year house built - Built 1980 to 1989 (%)
Year house built - Built 1970 to 1979 (%)
Year house built - Built 1960 to 1969 (%)
Year house built - Built 1950 to 1959 (%)
Year house built - Built 1940 to 1949 (%)
Year house built - Built 1939 or earlier (%)
Average household size
Household density (households per square mile)
Average household size - White
Average household size - Black or African American
Average household size - Asian
Average household size - Hispanic or Latino
Average household size - American Indian and Alaska Native
Average household size - Multirace
Average household size - Other Race
Occupied housing units (%)
Vacant housing units (%)
Owner occupied housing units (%)
Renter occupied housing units (%)
Vacancy status - For rent (%)
Vacancy status - For sale only (%)
Vacancy status - Rented or sold, not occupied (%)
Vacancy status - For seasonal, recreational, or occasional use (%)
Vacancy status - For migrant workers (%)
Vacancy status - Other vacant (%)
Residents with income below the poverty level (%)
Residents with income below 50% of the poverty level (%)
Children below poverty level (%)
Poor families by family type - Married-couple family (%)
Poor families by family type - Male, no wife present (%)
Poor families by family type - Female, no husband present (%)
Poverty status for native-born residents (%)
Poverty status for foreign-born residents (%)
Poverty among high school graduates not in families (%)
Poverty among people who did not graduate high school not in families (%)
Residents with income below the poverty level (%) - White
Residents with income below the poverty level (%) - Black or African American
Residents with income below the poverty level (%) - Asian
Residents with income below the poverty level (%) - Hispanic or Latino
Residents with income below the poverty level (%) - American Indian and Alaska Native
Residents with income below the poverty level (%) - Multirace
Residents with income below the poverty level (%) - Other Race
Air pollution - Air Quality Index (AQI)
Air pollution - CO
Air pollution - NO2
Air pollution - SO2
Air pollution - Ozone
Air pollution - PM10
Air pollution - PM25
Air pollution - Pb
Crime - Murders per 100,000 population
Crime - Rapes per 100,000 population
Crime - Robberies per 100,000 population
Crime - Assaults per 100,000 population
Crime - Burglaries per 100,000 population
Crime - Thefts per 100,000 population
Crime - Auto thefts per 100,000 population
Crime - Arson per 100,000 population
Crime - City-data.com crime index
Crime - Violent crime index
Crime - Property crime index
Crime - Murders per 100,000 population (5 year average)
Crime - Rapes per 100,000 population (5 year average)
Crime - Robberies per 100,000 population (5 year average)
Crime - Assaults per 100,000 population (5 year average)
Crime - Burglaries per 100,000 population (5 year average)
Crime - Thefts per 100,000 population (5 year average)
Crime - Auto thefts per 100,000 population (5 year average)
Crime - Arson per 100,000 population (5 year average)
Crime - City-data.com crime index (5 year average)
Crime - Violent crime index (5 year average)
Crime - Property crime index (5 year average)
1996 Presidential Elections Results (%) - Democratic Party (Clinton)
1996 Presidential Elections Results (%) - Republican Party (Dole)
1996 Presidential Elections Results (%) - Other
2000 Presidential Elections Results (%) - Democratic Party (Gore)
2000 Presidential Elections Results (%) - Republican Party (Bush)
2000 Presidential Elections Results (%) - Other
2004 Presidential Elections Results (%) - Democratic Party (Kerry)
2004 Presidential Elections Results (%) - Republican Party (Bush)
2004 Presidential Elections Results (%) - Other
2008 Presidential Elections Results (%) - Democratic Party (Obama)
2008 Presidential Elections Results (%) - Republican Party (McCain)
2008 Presidential Elections Results (%) - Other
2012 Presidential Elections Results (%) - Democratic Party (Obama)
2012 Presidential Elections Results (%) - Republican Party (Romney)
2012 Presidential Elections Results (%) - Other
2016 Presidential Elections Results (%) - Democratic Party (Clinton)
2016 Presidential Elections Results (%) - Republican Party (Trump)
2016 Presidential Elections Results (%) - Other
2020 Presidential Elections Results (%) - Democratic Party (Biden)
2020 Presidential Elections Results (%) - Republican Party (Trump)
2020 Presidential Elections Results (%) - Other
Ancestries Reported - Arab (%)
Ancestries Reported - Czech (%)
Ancestries Reported - Danish (%)
Ancestries Reported - Dutch (%)
Ancestries Reported - English (%)
Ancestries Reported - French (%)
Ancestries Reported - French Canadian (%)
Ancestries Reported - German (%)
Ancestries Reported - Greek (%)
Ancestries Reported - Hungarian (%)
Ancestries Reported - Irish (%)
Ancestries Reported - Italian (%)
Ancestries Reported - Lithuanian (%)
Ancestries Reported - Norwegian (%)
Ancestries Reported - Polish (%)
Ancestries Reported - Portuguese (%)
Ancestries Reported - Russian (%)
Ancestries Reported - Scotch-Irish (%)
Ancestries Reported - Scottish (%)
Ancestries Reported - Slovak (%)
Ancestries Reported - Subsaharan African (%)
Ancestries Reported - Swedish (%)
Ancestries Reported - Swiss (%)
Ancestries Reported - Ukrainian (%)
Ancestries Reported - United States (%)
Ancestries Reported - Welsh (%)
Ancestries Reported - West Indian (%)
Ancestries Reported - Other (%)
Educational Attainment - No schooling completed (%)
Educational Attainment - Less than high school (%)
Educational Attainment - High school or equivalent (%)
Educational Attainment - Less than 1 year of college (%)
Educational Attainment - 1 or more years of college (%)
Educational Attainment - Associate degree (%)
Educational Attainment - Bachelor's degree (%)
Educational Attainment - Master's degree (%)
Educational Attainment - Professional school degree (%)
Educational Attainment - Doctorate degree (%)
School Enrollment - Nursery, preschool (%)
School Enrollment - Kindergarten (%)
School Enrollment - Grade 1 to 4 (%)
School Enrollment - Grade 5 to 8 (%)
School Enrollment - Grade 9 to 12 (%)
School Enrollment - College undergrad (%)
School Enrollment - Graduate or professional (%)
School Enrollment - Not enrolled in school (%)
School enrollment - Public schools (%)
School enrollment - Private schools (%)
School enrollment - Not enrolled (%)
Median number of rooms in houses and condos
Median number of rooms in apartments
Housing units lacking complete plumbing facilities (%)
Housing units lacking complete kitchen facilities (%)
Density of houses
Urban houses (%)
Rural houses (%)
Households with people 60 years and over (%)
Households with people 65 years and over (%)
Households with people 75 years and over (%)
Households with one or more nonrelatives (%)
Households with no nonrelatives (%)
Population in households (%)
Family households (%)
Nonfamily households (%)
Population in families (%)
Family households with own children (%)
Median number of bedrooms in owner occupied houses
Mean number of bedrooms in owner occupied houses
Median number of bedrooms in renter occupied houses
Mean number of bedrooms in renter occupied houses
Median number of vehichles in owner occupied houses
Mean number of vehichles in owner occupied houses
Median number of vehichles in renter occupied houses
Mean number of vehichles in renter occupied houses
Mortgage status - with mortgage (%)
Mortgage status - with second mortgage (%)
Mortgage status - with home equity loan (%)
Mortgage status - with both second mortgage and home equity loan (%)
Mortgage status - without a mortgage (%)
Average family size
Average family size - White
Average family size - Black or African American
Average family size - Asian
Average family size - Hispanic or Latino
Average family size - American Indian and Alaska Native
Average family size - Multirace
Average family size - Other Race
Geographical mobility - Same house 1 year ago (%)
Geographical mobility - Moved within same county (%)
Geographical mobility - Moved from different county within same state (%)
Geographical mobility - Moved from different state (%)
Geographical mobility - Moved from abroad (%)
Place of birth - Born in state of residence (%)
Place of birth - Born in other state (%)
Place of birth - Native, outside of US (%)
Place of birth - Foreign born (%)
Housing units in structures - 1, detached (%)
Housing units in structures - 1, attached (%)
Housing units in structures - 2 (%)
Housing units in structures - 3 or 4 (%)
Housing units in structures - 5 to 9 (%)
Housing units in structures - 10 to 19 (%)
Housing units in structures - 20 to 49 (%)
Housing units in structures - 50 or more (%)
Housing units in structures - Mobile home (%)
Housing units in structures - Boat, RV, van, etc. (%)
House/condo owner moved in on average (years ago)
Renter moved in on average (years ago)
Year householder moved into unit - Moved in 1999 to March 2000 (%)
Year householder moved into unit - Moved in 1995 to 1998 (%)
Year householder moved into unit - Moved in 1990 to 1994 (%)
Year householder moved into unit - Moved in 1980 to 1989 (%)
Year householder moved into unit - Moved in 1970 to 1979 (%)
Year householder moved into unit - Moved in 1969 or earlier (%)
Means of transportation to work - Drove car alone (%)
Means of transportation to work - Carpooled (%)
Means of transportation to work - Public transportation (%)
Means of transportation to work - Bus or trolley bus (%)
Means of transportation to work - Streetcar or trolley car (%)
Means of transportation to work - Subway or elevated (%)
Means of transportation to work - Railroad (%)
Means of transportation to work - Ferryboat (%)
Means of transportation to work - Taxicab (%)
Means of transportation to work - Motorcycle (%)
Means of transportation to work - Bicycle (%)
Means of transportation to work - Walked (%)
Means of transportation to work - Other means (%)
Working at home (%)
Industry diversity
Most Common Industries - Agriculture, forestry, fishing and hunting, and mining (%)
Most Common Industries - Agriculture, forestry, fishing and hunting (%)
Most Common Industries - Mining, quarrying, and oil and gas extraction (%)
Most Common Industries - Construction (%)
Most Common Industries - Manufacturing (%)
Most Common Industries - Wholesale trade (%)
Most Common Industries - Retail trade (%)
Most Common Industries - Transportation and warehousing, and utilities (%)
Most Common Industries - Transportation and warehousing (%)
Most Common Industries - Utilities (%)
Most Common Industries - Information (%)
Most Common Industries - Finance and insurance, and real estate and rental and leasing (%)
Most Common Industries - Finance and insurance (%)
Most Common Industries - Real estate and rental and leasing (%)
Most Common Industries - Professional, scientific, and management, and administrative and waste management services (%)
Most Common Industries - Professional, scientific, and technical services (%)
Most Common Industries - Management of companies and enterprises (%)
Most Common Industries - Administrative and support and waste management services (%)
Most Common Industries - Educational services, and health care and social assistance (%)
Most Common Industries - Educational services (%)
Most Common Industries - Health care and social assistance (%)
Most Common Industries - Arts, entertainment, and recreation, and accommodation and food services (%)
Most Common Industries - Arts, entertainment, and recreation (%)
Most Common Industries - Accommodation and food services (%)
Most Common Industries - Other services, except public administration (%)
Most Common Industries - Public administration (%)
Occupation diversity
Most Common Occupations - Management, business, science, and arts occupations (%)
Most Common Occupations - Management, business, and financial occupations (%)
Most Common Occupations - Management occupations (%)
Most Common Occupations - Business and financial operations occupations (%)
Most Common Occupations - Computer, engineering, and science occupations (%)
Most Common Occupations - Computer and mathematical occupations (%)
Most Common Occupations - Architecture and engineering occupations (%)
Most Common Occupations - Life, physical, and social science occupations (%)
Most Common Occupations - Education, legal, community service, arts, and media occupations (%)
Most Common Occupations - Community and social service occupations (%)
Most Common Occupations - Legal occupations (%)
Most Common Occupations - Education, training, and library occupations (%)
Most Common Occupations - Arts, design, entertainment, sports, and media occupations (%)
Most Common Occupations - Healthcare practitioners and technical occupations (%)
Most Common Occupations - Health diagnosing and treating practitioners and other technical occupations (%)
Most Common Occupations - Health technologists and technicians (%)
Most Common Occupations - Service occupations (%)
Most Common Occupations - Healthcare support occupations (%)
Most Common Occupations - Protective service occupations (%)
Most Common Occupations - Fire fighting and prevention, and other protective service workers including supervisors (%)
Most Common Occupations - Law enforcement workers including supervisors (%)
Most Common Occupations - Food preparation and serving related occupations (%)
Most Common Occupations - Building and grounds cleaning and maintenance occupations (%)
Most Common Occupations - Personal care and service occupations (%)
Most Common Occupations - Sales and office occupations (%)
Most Common Occupations - Sales and related occupations (%)
Most Common Occupations - Office and administrative support occupations (%)
Most Common Occupations - Natural resources, construction, and maintenance occupations (%)
Most Common Occupations - Farming, fishing, and forestry occupations (%)
Most Common Occupations - Construction and extraction occupations (%)
Most Common Occupations - Installation, maintenance, and repair occupations (%)
Most Common Occupations - Production, transportation, and material moving occupations (%)
Most Common Occupations - Production occupations (%)
Most Common Occupations - Transportation occupations (%)
Most Common Occupations - Material moving occupations (%)
People in Group quarters - Institutionalized population (%)
People in Group quarters - Correctional institutions (%)
People in Group quarters - Federal prisons and detention centers (%)
People in Group quarters - Halfway houses (%)
People in Group quarters - Local jails and other confinement facilities (including police lockups) (%)
People in Group quarters - Military disciplinary barracks (%)
People in Group quarters - State prisons (%)
People in Group quarters - Other types of correctional institutions (%)
People in Group quarters - Nursing homes (%)
People in Group quarters - Hospitals/wards, hospices, and schools for the handicapped (%)
People in Group quarters - Hospitals/wards and hospices for chronically ill (%)
People in Group quarters - Hospices or homes for chronically ill (%)
People in Group quarters - Military hospitals or wards for chronically ill (%)
People in Group quarters - Other hospitals or wards for chronically ill (%)
People in Group quarters - Hospitals or wards for drug/alcohol abuse (%)
People in Group quarters - Mental (Psychiatric) hospitals or wards (%)
People in Group quarters - Schools, hospitals, or wards for the mentally retarded (%)
People in Group quarters - Schools, hospitals, or wards for the physically handicapped (%)
People in Group quarters - Institutions for the deaf (%)
People in Group quarters - Institutions for the blind (%)
People in Group quarters - Orthopedic wards and institutions for the physically handicapped (%)
People in Group quarters - Wards in general hospitals for patients who have no usual home elsewhere (%)
People in Group quarters - Wards in military hospitals for patients who have no usual home elsewhere (%)
People in Group quarters - Juvenile institutions (%)
People in Group quarters - Long-term care (%)
People in Group quarters - Homes for abused, dependent, and neglected children (%)
People in Group quarters - Residential treatment centers for emotionally disturbed children (%)
People in Group quarters - Training schools for juvenile delinquents (%)
People in Group quarters - Short-term care, detention or diagnostic centers for delinquent children (%)
People in Group quarters - Type of juvenile institution unknown (%)
People in Group quarters - Noninstitutionalized population (%)
People in Group quarters - College dormitories (includes college quarters off campus) (%)
People in Group quarters - Military quarters (%)
People in Group quarters - On base (%)
People in Group quarters - Barracks, unaccompanied personnel housing (UPH), (Enlisted/Officer), ;and similar group living quarters for military personnel (%)
People in Group quarters - Transient quarters for temporary residents (%)
People in Group quarters - Military ships (%)
People in Group quarters - Group homes (%)
People in Group quarters - Homes or halfway houses for drug/alcohol abuse (%)
People in Group quarters - Homes for the mentally ill (%)
People in Group quarters - Homes for the mentally retarded (%)
People in Group quarters - Homes for the physically handicapped (%)
People in Group quarters - Other group homes (%)
People in Group quarters - Religious group quarters (%)
People in Group quarters - Dormitories (%)
People in Group quarters - Agriculture workers' dormitories on farms (%)
People in Group quarters - Job Corps and vocational training facilities (%)
People in Group quarters - Other workers' dormitories (%)
People in Group quarters - Crews of maritime vessels (%)
People in Group quarters - Other nonhousehold living situations (%)
People in Group quarters - Other noninstitutional group quarters (%)
Residents speaking English at home (%)
Residents speaking English at home - Born in the United States (%)
Residents speaking English at home - Native, born elsewhere (%)
Residents speaking English at home - Foreign born (%)
Residents speaking Spanish at home (%)
Residents speaking Spanish at home - Born in the United States (%)
Residents speaking Spanish at home - Native, born elsewhere (%)
Residents speaking Spanish at home - Foreign born (%)
Residents speaking other language at home (%)
Residents speaking other language at home - Born in the United States (%)
Residents speaking other language at home - Native, born elsewhere (%)
Residents speaking other language at home - Foreign born (%)
Class of Workers - Employee of private company (%)
Class of Workers - Self-employed in own incorporated business (%)
Class of Workers - Private not-for-profit wage and salary workers (%)
Class of Workers - Local government workers (%)
Class of Workers - State government workers (%)
Class of Workers - Federal government workers (%)
Class of Workers - Self-employed workers in own not incorporated business and Unpaid family workers (%)
House heating fuel used in houses and condos - Utility gas (%)
House heating fuel used in houses and condos - Bottled, tank, or LP gas (%)
House heating fuel used in houses and condos - Electricity (%)
House heating fuel used in houses and condos - Fuel oil, kerosene, etc. (%)
House heating fuel used in houses and condos - Coal or coke (%)
House heating fuel used in houses and condos - Wood (%)
House heating fuel used in houses and condos - Solar energy (%)
House heating fuel used in houses and condos - Other fuel (%)
House heating fuel used in houses and condos - No fuel used (%)
House heating fuel used in apartments - Utility gas (%)
House heating fuel used in apartments - Bottled, tank, or LP gas (%)
House heating fuel used in apartments - Electricity (%)
House heating fuel used in apartments - Fuel oil, kerosene, etc. (%)
House heating fuel used in apartments - Coal or coke (%)
House heating fuel used in apartments - Wood (%)
House heating fuel used in apartments - Solar energy (%)
House heating fuel used in apartments - Other fuel (%)
House heating fuel used in apartments - No fuel used (%)
Armed forces status - In Armed Forces (%)
Armed forces status - Civilian (%)
Armed forces status - Civilian - Veteran (%)
Armed forces status - Civilian - Nonveteran (%)
Fatal accidents locations in years 2005-2021
Fatal accidents locations in 2005
Fatal accidents locations in 2006
Fatal accidents locations in 2007
Fatal accidents locations in 2008
Fatal accidents locations in 2009
Fatal accidents locations in 2010
Fatal accidents locations in 2011
Fatal accidents locations in 2012
Fatal accidents locations in 2013
Fatal accidents locations in 2014
Fatal accidents locations in 2015
Fatal accidents locations in 2016
Fatal accidents locations in 2017
Fatal accidents locations in 2018
Fatal accidents locations in 2019
Fatal accidents locations in 2020
Fatal accidents locations in 2021
Alcohol use - People drinking some alcohol every month (%)
Alcohol use - People not drinking at all (%)
Alcohol use - Average days/month drinking alcohol
Alcohol use - Average drinks/week
Alcohol use - Average days/year people drink much
Audiometry - Average condition of hearing (%)
Audiometry - People that can hear a whisper from across a quiet room (%)
Audiometry - People that can hear normal voice from across a quiet room (%)
Audiometry - Ears ringing, roaring, buzzing (%)
Audiometry - Had a job exposure to loud noise (%)
Audiometry - Had off-work exposure to loud noise (%)
Blood Pressure & Cholesterol - Has high blood pressure (%)
Blood Pressure & Cholesterol - Checking blood pressure at home (%)
Blood Pressure & Cholesterol - Frequently checking blood cholesterol (%)
Blood Pressure & Cholesterol - Has high cholesterol level (%)
Consumer Behavior - Money monthly spent on food at supermarket/grocery store
Consumer Behavior - Money monthly spent on food at other stores
Consumer Behavior - Money monthly spent on eating out
Consumer Behavior - Money monthly spent on carryout/delivered foods
Consumer Behavior - Income spent on food at supermarket/grocery store (%)
Consumer Behavior - Income spent on food at other stores (%)
Consumer Behavior - Income spent on eating out (%)
Consumer Behavior - Income spent on carryout/delivered foods (%)
Current Health Status - General health condition (%)
Current Health Status - Blood donors (%)
Current Health Status - Has blood ever tested for HIV virus (%)
Current Health Status - Left-handed people (%)
Dermatology - People using sunscreen (%)
Diabetes - Diabetics (%)
Diabetes - Had a blood test for high blood sugar (%)
Diabetes - People taking insulin (%)
Diet Behavior & Nutrition - Diet health (%)
Diet Behavior & Nutrition - Milk product consumption (# of products/month)
Diet Behavior & Nutrition - Meals not home prepared (#/week)
Diet Behavior & Nutrition - Meals from fast food or pizza place (#/week)
Diet Behavior & Nutrition - Ready-to-eat foods (#/month)
Diet Behavior & Nutrition - Frozen meals/pizza (#/month)
Drug Use - People that ever used marijuana or hashish (%)
Drug Use - Ever used hard drugs (%)
Drug Use - Ever used any form of cocaine (%)
Drug Use - Ever used heroin (%)
Drug Use - Ever used methamphetamine (%)
Health Insurance - People covered by health insurance (%)
Kidney Conditions-Urology - Avg. # of times urinating at night
Medical Conditions - People with asthma (%)
Medical Conditions - People with anemia (%)
Medical Conditions - People with psoriasis (%)
Medical Conditions - People with overweight (%)
Medical Conditions - Elderly people having difficulties in thinking or remembering (%)
Medical Conditions - People who ever received blood transfusion (%)
Medical Conditions - People having trouble seeing even with glass/contacts (%)
Medical Conditions - People with arthritis (%)
Medical Conditions - People with gout (%)
Medical Conditions - People with congestive heart failure (%)
Medical Conditions - People with coronary heart disease (%)
Medical Conditions - People with angina pectoris (%)
Medical Conditions - People who ever had heart attack (%)
Medical Conditions - People who ever had stroke (%)
Medical Conditions - People with emphysema (%)
Medical Conditions - People with thyroid problem (%)
Medical Conditions - People with chronic bronchitis (%)
Medical Conditions - People with any liver condition (%)
Medical Conditions - People who ever had cancer or malignancy (%)
Mental Health - People who have little interest in doing things (%)
Mental Health - People feeling down, depressed, or hopeless (%)
Mental Health - People who have trouble sleeping or sleeping too much (%)
Mental Health - People feeling tired or having little energy (%)
Mental Health - People with poor appetite or overeating (%)
Mental Health - People feeling bad about themself (%)
Mental Health - People who have trouble concentrating on things (%)
Mental Health - People moving or speaking slowly or too fast (%)
Mental Health - People having thoughts they would be better off dead (%)
Oral Health - Average years since last visit a dentist
Oral Health - People embarrassed because of mouth (%)
Oral Health - People with gum disease (%)
Oral Health - General health of teeth and gums (%)
Oral Health - Average days a week using dental floss/device
Oral Health - Average days a week using mouthwash for dental problem
Oral Health - Average number of teeth
Pesticide Use - Households using pesticides to control insects (%)
Pesticide Use - Households using pesticides to kill weeds (%)
Physical Activity - People doing vigorous-intensity work activities (%)
Physical Activity - People doing moderate-intensity work activities (%)
Physical Activity - People walking or bicycling (%)
Physical Activity - People doing vigorous-intensity recreational activities (%)
Physical Activity - People doing moderate-intensity recreational activities (%)
Physical Activity - Average hours a day doing sedentary activities
Physical Activity - Average hours a day watching TV or videos
Physical Activity - Average hours a day using computer
Physical Functioning - People having limitations keeping them from working (%)
Physical Functioning - People limited in amount of work they can do (%)
Physical Functioning - People that need special equipment to walk (%)
Physical Functioning - People experiencing confusion/memory problems (%)
Physical Functioning - People requiring special healthcare equipment (%)
Prescription Medications - Average number of prescription medicines taking
Preventive Aspirin Use - Adults 40+ taking low-dose aspirin (%)
Reproductive Health - Vaginal deliveries (%)
Reproductive Health - Cesarean deliveries (%)
Reproductive Health - Deliveries resulted in a live birth (%)
Reproductive Health - Pregnancies resulted in a delivery (%)
Reproductive Health - Women breastfeeding newborns (%)
Reproductive Health - Women that had a hysterectomy (%)
Reproductive Health - Women that had both ovaries removed (%)
Reproductive Health - Women that have ever taken birth control pills (%)
Reproductive Health - Women taking birth control pills (%)
Reproductive Health - Women that have ever used Depo-Provera or injectables (%)
Reproductive Health - Women that have ever used female hormones (%)
Sexual Behavior - People 18+ that ever had sex (vaginal, anal, or oral) (%)
Sexual Behavior - Males 18+ that ever had vaginal sex with a woman (%)
Sexual Behavior - Males 18+ that ever performed oral sex on a woman (%)
Sexual Behavior - Males 18+ that ever had anal sex with a woman (%)
Sexual Behavior - Males 18+ that ever had any sex with a man (%)
Sexual Behavior - Females 18+ that ever had vaginal sex with a man (%)
Sexual Behavior - Females 18+ that ever performed oral sex on a man (%)
Sexual Behavior - Females 18+ that ever had anal sex with a man (%)
Sexual Behavior - Females 18+ that ever had any kind of sex with a woman (%)
Sexual Behavior - Average age people first had sex
Sexual Behavior - Average number of female sex partners in lifetime (males 18+)
Sexual Behavior - Average number of female vaginal sex partners in lifetime (males 18+)
Sexual Behavior - Average age people first performed oral sex on a woman (18+)
Sexual Behavior - Average number of woman performed oral sex on in lifetime (18+)
Sexual Behavior - Average number of male sex partners in lifetime (males 18+)
Sexual Behavior - Average number of male anal sex partners in lifetime (males 18+)
Sexual Behavior - Average age people first performed oral sex on a man (18+)
Sexual Behavior - Average number of male oral sex partners in lifetime (18+)
Sexual Behavior - People using protection when performing oral sex (%)
Sexual Behavior - Average number of times people have vaginal or anal sex a year
Sexual Behavior - People having sex without condom (%)
Sexual Behavior - Average number of male sex partners in lifetime (females 18+)
Sexual Behavior - Average number of male vaginal sex partners in lifetime (females 18+)
Sexual Behavior - Average number of female sex partners in lifetime (females 18+)
Sexual Behavior - Circumcised males 18+ (%)
Sleep Disorders - Average hours sleeping at night
Sleep Disorders - People that has trouble sleeping (%)
Smoking-Cigarette Use - People smoking cigarettes (%)
Taste & Smell - People 40+ having problems with smell (%)
Taste & Smell - People 40+ having problems with taste (%)
Taste & Smell - People 40+ that ever had wisdom teeth removed (%)
Taste & Smell - People 40+ that ever had tonsils teeth removed (%)
Taste & Smell - People 40+ that ever had a loss of consciousness because of a head injury (%)
Taste & Smell - People 40+ that ever had a broken nose or other serious injury to face or skull (%)
Taste & Smell - People 40+ that ever had two or more sinus infections (%)
Weight - Average height (inches)
Weight - Average weight (pounds)
Weight - Average BMI
Weight - People that are obese (%)
Weight - People that ever were obese (%)
Weight - People trying to lose weight (%)
100%
urban population.
Estimated median house/condo value in 2022: $108,131
40215:
$108,131Kentucky:
$196,300
Median resident age: This zip code:
36.5 yearsKentucky median age:
39.4 years
Average household size: This zip code:
2.4 peopleKentucky:
2.4 people
Averages for the 2020 tax year for zip code 40215, filed in 2021:
Average Adjusted Gross Income (AGI) in 2020: $30,644 (Individual Income Tax Returns) Here:
$30,644State:
$61,342
Salary/wage: $28,199 (reported on 89.1% of returns )Here:
$28,199State:
$50,827
(% of AGI for various income ranges: 1194.8% for AGIs below $25k , 3734.8% for AGIs $25k-50k , 6662.3% for AGIs $50k-75k , 9883.6% for AGIs $75k-100k , 15383.6% for AGIs $100k-200k ) Taxable interest for individuals: $569 (reported on 7.5% of returns )This zip code:
$569Kentucky:
$1,441
(% of AGI for various income ranges: 2.3% for AGIs below $25k , 5.9% for AGIs $25k-50k , 7.3% for AGIs $50k-75k , 24.4% for AGIs $75k-100k , 37.3% for AGIs $100k-200k ) Ordinary dividends: $1,644 (reported on 3.7% of returns )(% of AGI for various income ranges: 1.8% for AGIs below $25k , 3.1% for AGIs $25k-50k , 32.8% for AGIs $50k-75k , 44.0% for AGIs $75k-100k , 73.6% for AGIs $100k-200k ) Net capital gain/loss in AGI: +$4,619 (reported on 3.3% of returns )Here:
+$4,619State:
+$19,475
(% of AGI for various income ranges: 2.7% for AGIs below $25k , 6.7% for AGIs $25k-50k , 42.2% for AGIs $50k-75k , 117.6% for AGIs $75k-100k , 527.3% for AGIs $100k-200k ) Profit/loss from business: +$5,005 (reported on 12.6% of returns )Here:
+$5,005State:
+$11,386
(% of AGI for various income ranges: 79.4% for AGIs below $25k , 65.8% for AGIs $25k-50k , 79.5% for AGIs $50k-75k , 178.0% for AGIs $75k-100k , 20.0% for AGIs $100k-200k ) Taxable individual retirement arrangement distribution: $12,619 (reported on 2.8% of returns )40215:
$12,619Kentucky:
$18,941
(% of AGI for various income ranges: 13.6% for AGIs below $25k , 21.9% for AGIs $25k-50k , 125.9% for AGIs $50k-75k , 159.6% for AGIs $75k-100k , 845.5% for AGIs $100k-200k ) Total itemized deductions: $23,353 (reported on 1.8% of returns )Here:
$23,353State:
$32,473
(% of AGI for various income ranges: 8.8% for AGIs below $25k , 39.1% for AGIs $25k-50k , 222.8% for AGIs $50k-75k , 357.6% for AGIs $75k-100k ) Charity contributions: $6,192 (reported on 1.2% of returns )(% of AGI for various income ranges: 7.0% for AGIs $25k-50k , 41.1% for AGIs $50k-75k , 98.8% for AGIs $75k-100k ) Taxes paid: $5,119 (reported on 1.7% of returns )(% of AGI for various income ranges: 0.7% for AGIs below $25k , 6.4% for AGIs $25k-50k , 46.1% for AGIs $50k-75k , 109.6% for AGIs $75k-100k ) Earned income credit: $2,590 (reported on 36.5% of returns )(% of AGI for various income ranges: 157.8% for AGIs below $25k , 99.9% for AGIs $25k-50k ) Percentage of individuals using paid preparers for their 2020 taxes: 94.2%(% for various income ranges: 94.7% for AGIs below $25k , 94.6% for AGIs $25k-50k , 92.9% for AGIs $50k-75k , 88.9% for AGIs $75k-100k , 89.5% for AGIs $100k-200k )
Averages for the 2012 tax year for zip code 40215, filed in 2013:
Average Adjusted Gross Income (AGI) in 2012: $25,977 (Individual Income Tax Returns) Here:
$25,977State:
$50,814
Salary/wage: $24,424 (reported on 90.1% of returns )Here:
$24,424State:
$42,723
(% of AGI for various income ranges: 82.4% for AGIs below $25k , 89.4% for AGIs $25k-50k , 84.5% for AGIs $50k-75k , 82.4% for AGIs $75k-100k , 68.3% for AGIs $100k-200k ) Taxable interest for individuals: $609 (reported on 9.9% of returns )This zip code:
$609Kentucky:
$1,381
(% of AGI for various income ranges: 0.4% for AGIs below $25k , 0.1% for AGIs $25k-50k , 0.2% for AGIs $50k-75k , 0.1% for AGIs $75k-100k , 0.4% for AGIs $100k-200k ) Ordinary dividends: $1,718 (reported on 4.9% of returns )(% of AGI for various income ranges: 0.3% for AGIs below $25k , 0.3% for AGIs $25k-50k , 0.5% for AGIs $50k-75k , 0.2% for AGIs $75k-100k , 0.3% for AGIs $100k-200k ) Net capital gain/loss in AGI: +$917 (reported on 2.6% of returns )(% of AGI for various income ranges: 0.3% for AGIs $50k-75k , 0.4% for AGIs $75k-100k ) Profit/loss from business: +$7,245 (reported on 10.2% of returns )Here:
+$7,245State:
+$10,862
(% of AGI for various income ranges: 6.8% for AGIs below $25k , 1.3% for AGIs $25k-50k , 1.7% for AGIs $50k-75k , 0.4% for AGIs $75k-100k ) Taxable individual retirement arrangement distribution: $8,833 (reported on 3.6% of returns )40215:
$8,833Kentucky:
$14,296
(% of AGI for various income ranges: 0.9% for AGIs below $25k , 0.9% for AGIs $25k-50k , 1.2% for AGIs $50k-75k , 4.6% for AGIs $75k-100k ) Total itemized deductions: $13,232 (27% of AGI, reported on 14.3% of returns )Here:
$13,232State:
$21,160
Here:
26.9% of AGIState:
20.0% of AGI
(% of AGI for various income ranges: 4.4% for AGIs below $25k , 7.0% for AGIs $25k-50k , 9.0% for AGIs $50k-75k , 11.5% for AGIs $75k-100k , 12.4% for AGIs $100k-200k ) Charity contributions: $2,388 (reported on 10.8% of returns )(% of AGI for various income ranges: 0.5% for AGIs below $25k , 0.9% for AGIs $25k-50k , 1.2% for AGIs $50k-75k , 1.7% for AGIs $75k-100k , 2.3% for AGIs $100k-200k ) Taxes paid: $4,321 (reported on 14.2% of returns )(% of AGI for various income ranges: 0.6% for AGIs below $25k , 2.2% for AGIs $25k-50k , 3.4% for AGIs $50k-75k , 4.8% for AGIs $75k-100k , 5.6% for AGIs $100k-200k ) Earned income credit: $2,473 (reported on 40.4% of returns )(% of AGI for various income ranges: 11.1% for AGIs below $25k , 1.6% for AGIs $25k-50k ) Percentage of individuals using paid preparers for their 2012 taxes: 52.4%(% for various income ranges: 53.3% for AGIs below $25k , 50.0% for AGIs $25k-50k , 53.5% for AGIs $50k-75k , 54.2% for AGIs $75k-100k , 54.5% for AGIs $100k-200k )
Averages for the 2004 tax year for zip code 40215, filed in 2005:
Average Adjusted Gross Income (AGI) in 2004: $24,631 (Individual Income Tax Returns) Here:
$24,631State:
$41,540
Salary/wage: $23,527 (reported on 90.4% of returns )Here:
$23,527State:
$36,432
(% of AGI for various income ranges: 84.3% for AGIs below $10k , 85.7% for AGIs $10k-25k , 89.6% for AGIs $25k-50k , 86.8% for AGIs $50k-75k , 87.6% for AGIs $75k-100k , 61.1% for AGIs over 100k ) Taxable interest for individuals: $1,102 (reported on 20.1% of returns )This zip code:
$1,102Kentucky:
$1,571
(% of AGI for various income ranges: 1.5% for AGIs below $10k , 1.3% for AGIs $10k-25k , 0.7% for AGIs $25k-50k , 0.8% for AGIs $50k-75k , 0.6% for AGIs $75k-100k , 0.8% for AGIs over 100k ) Taxable dividends: $957 (reported on 7.4% of returns )(% of AGI for various income ranges: 0.5% for AGIs below $10k , 0.3% for AGIs $10k-25k , 0.3% for AGIs $25k-50k , 0.3% for AGIs $50k-75k , 0.2% for AGIs $75k-100k , 0.4% for AGIs over 100k ) Net capital gain/loss: +$3,353 (reported on 4.6% of returns )Here:
+$3,353State:
+$9,663
(% of AGI for various income ranges: -0.1% for AGIs below $10k , 0.2% for AGIs $10k-25k , 0.0% for AGIs $25k-50k , 0.6% for AGIs $50k-75k , 0.8% for AGIs $75k-100k , 9.6% for AGIs over 100k ) Profit/loss from business: +$4,556 (reported on 8.0% of returns )Here:
+$4,556State:
+$9,233
(% of AGI for various income ranges: 5.0% for AGIs below $10k , 2.5% for AGIs $10k-25k , 0.9% for AGIs $25k-50k , 1.1% for AGIs $50k-75k , 0.2% for AGIs $75k-100k ) IRA payment deduction: $1,788 (reported on 1.5% of returns )40215:
$1,788Kentucky:
$2,955
Total itemized deductions: $11,405 (25% of AGI, reported on 19.4% of returns )Here:
$11,405State:
$17,474
Here:
24.9% of AGIState:
21.0% of AGI
(% of AGI for various income ranges: 3.4% for AGIs below $10k , 4.6% for AGIs $10k-25k , 9.3% for AGIs $25k-50k , 13.1% for AGIs $50k-75k , 14.3% for AGIs $75k-100k , 12.1% for AGIs over 100k ) Charity contributions deductions: $1,779 (4% of AGI, reported on 16.3% of returns )Here:
3.7% of AGIState:
4.0% of AGI
(% of AGI for various income ranges: 0.3% for AGIs below $10k , 0.5% for AGIs $10k-25k , 1.1% for AGIs $25k-50k , 1.8% for AGIs $50k-75k , 2.0% for AGIs $75k-100k , 2.1% for AGIs over 100k ) Total tax: $2,600 (reported on 60.9% of returns )(% of AGI for various income ranges: 1.5% for AGIs below $10k , 3.2% for AGIs $10k-25k , 6.2% for AGIs $25k-50k , 9.0% for AGIs $50k-75k , 10.7% for AGIs $75k-100k , 15.7% for AGIs over 100k ) Earned income credit: $1,889 (reported on 35.5% of returns )Percentage of individuals using paid preparers for their 2004 taxes: 61.8%(% for various income ranges: 59.4% for AGIs below $10k , 65.3% for AGIs $10k-25k , 59.7% for AGIs $25k-50k , 59.2% for AGIs $50k-75k , 60.9% for AGIs $75k-100k , 72.2% for AGIs over 100k )
Estimated median household income in 2022: This zip code:
$40,818Kentucky:
$59,341
Nearest zip codes: 40208 ,
40209 ,
40214 ,
40210 ,
40216 ,
40217 .
Shively Zip Code Map
Percentage of family households: This zip code:
39.3%Kentucky:
45.9%
Percentage of households with unmarried partners: This zip code:
11.6%Kentucky:
47.1%
Likely homosexual households (counted as self-reported same-sex unmarried-partner households)
Lesbian couples: 0.1% of all households Gay men: 0.1% of all households
Household received Food Stamps/SNAP in the past 12 months: 2,196Household did not receive Food Stamps/SNAP in the past 12 months: 5,914
Women who had a birth in the past 12 months: 330 (126 now married , 210 unmarried) Women who did not have a birth in the past 12 months: 4,098 (1,136 now married , 2,946 unmarried)
Housing units in zip code 40215 with a mortgage: 2,242 (278
second mortgage , 22
home equity loan , 158
both second mortgage and home equity loan )
Houses without a mortgage: 14
Median monthly owner costs for units with a mortgage: $1,003
Median monthly owner costs for units without a mortgage: $434
Residents with income below the poverty level in 2022:
This zip code:
29.5%Whole state:
16.5%
Residents with income below 50% of the poverty level in 2022:
This zip code:
15.1%Whole state:
9.0%
Median number of rooms in houses and condos: Median number of rooms in apartments:
Year house built (houses)
7 2020 or later113 2010 to 2019196 2000 to 2009289 1990 to 1999337 1980 to 1989796 1970 to 19791,141 1960 to 19691,859 1950 to 19592,405 1940 to 19491,381 1939 or earlier
Zip code 40215 household income distribution in 2022 698 Less than $10,000480 $10,000 to $14,999508 $15,000 to $19,999654 $20,000 to $24,999568 $25,000 to $29,999500 $30,000 to $34,999444 $35,000 to $39,999685 $40,000 to $44,999321 $45,000 to $49,999877 $50,000 to $59,999708 $60,000 to $74,999922 $75,000 to $99,999432 $100,000 to $124,999137 $125,000 to $149,999103 $150,000 to $199,99985 $200,000 or moreEstimate of home value of owner-occupied houses/condos in 2022 in zip code 40215 86 Less than $10,00065 $10,000 to $14,9995 $15,000 to $19,99917 $20,000 to $24,99918 $25,000 to $29,99910 $30,000 to $34,99917 $35,000 to $39,99970 $40,000 to $49,999106 $50,000 to $59,999283 $60,000 to $69,999227 $70,000 to $79,999396 $80,000 to $89,999309 $90,000 to $99,999589 $100,000 to $124,999320 $125,000 to $149,999312 $150,000 to $174,99949 $175,000 to $199,99935 $200,000 to $249,99923 $250,000 to $299,99954 $300,000 to $399,99951 $500,000 to $749,999Rent paid by renters in 2022 in zip code 40215 51 Less than $100115 $100 to $14936 $150 to $199135 $200 to $24941 $250 to $299109 $300 to $34963 $350 to $399115 $400 to $44984 $450 to $499347 $500 to $549253 $550 to $599440 $600 to $649367 $650 to $699365 $700 to $749468 $750 to $799671 $800 to $899302 $900 to $999353 $1,000 to $1,24968 $1,250 to $1,499125 No cash rent
Median gross rent in 2022: $909.
Median price asked for vacant for-sale houses and condos in 2022: $157,990.
Estimated median house (or condo) value in 2022 for: White Non-Hispanic householders: $107,098Black or African American householders: $123,111American Indian or Alaska Native householders: $94,701Asian householders: $136,886Two or more races householders: $117,945Hispanic or Latino householders: $129,137Estimated median house or condo value in 2022: $108,131
40215:
$108,131Kentucky:
$196,300
Lower value quartile - upper value quartile: $85,101 - $143,229
Mean price in 2022: Detached houses: $296,246Here:
$296,246State:
$256,452
Townhouses or other attached units: $324,768Here:
$324,768State:
$264,090
In 2-unit structures: $229,571Here:
$229,571State:
$211,203
In 3-to-4-unit structures: $142,806Here:
$142,806State:
$169,074
In 5-or-more-unit structures: $199,353Here:
$199,353State:
$245,174
Mobile homes: $137,257Here:
$137,257State:
$84,635
Occupied boats, RVs, vans, etc.: $80,553Here:
$80,553State:
$52,431
Housing units in structures:
One, detached: 6,245One, attached: 146Two: 1543 or 4: 1,2935 to 9: 37010 to 19: 34920 to 49: 18850 or more: 299Mobile homes: 130Unemployment : 7.1%
Means of transportation to work in zip code 40215 71.3% 6,029 Drove a car alone9.4% 794 Carpooled2.1% 176 Bus or trolley bus0.9% 77 Taxi0.2% 19 Motorcycle0.2% 18 Bicycle2.2% 185 Walked5.6% 475 Other means6.9% 582 Worked at homeTravel time to work (commute) in zip code 40215 107 Less than 5 minutes639 5 to 9 minutes976 10 to 14 minutes1,790 15 to 19 minutes1,934 20 to 24 minutes635 25 to 29 minutes827 30 to 34 minutes137 35 to 39 minutes143 40 to 44 minutes330 45 to 59 minutes201 60 to 89 minutes67 90 or more minutes
Neighborhoods in zip code 40215: Percentage of zip code residents living and working in this county: 95.3%
Household type by relationship:
Households: 19,534
Male householders: 3,629 (1,649 living alone ), Female householders: 4,469 (1,458 living alone )1,669 spouses (1,555 opposite-sex spouses ), 1,064 unmarried partners , (1,014 opposite-sex unmarried partners ), 5,800 children (5,362 natural , 140 adopted , 299 stepchildren ), 724 grandchildren , 145 brothers or sisters , 339 parents , 10 foster children , 287 other relatives , 1,160 non-relatives In group quarters: 108 (-1 institutionalized population )
Size of family households: 1,509 2-persons , 1,247 3-persons , 667 4-persons , 493 5-persons , 192 6-persons , 48 7-or-more-persons
Size of nonfamily households: 3,105 1-person , 653 2-persons , 111 3-persons , 53 4-persons , 8 5-persons
1,127 married couples with children. single-parent households (560 men , 2,518 women ).
88.2% of residents of 40215 zip code speak English at home. of residents speak Spanish at home (29% very well, 39% well, 27% not well, 5% not at all ).of residents speak other Indo-European language at home (64% very well, 32% well, 2% not well, 1% not at all ).of residents speak Asian or Pacific Island language at home (26% very well, 6% well, 61% not well, 7% not at all ).of residents speak other language at home (38% very well, 44% well, 18% not well ).
Foreign born population: 1,513 (7.7%)
(30.5%
of them are naturalized citizens )
This zip code:
7.7%Whole state:
4.0%
20% Barbados 15% Kenya 13% Honduras 8% Somalia 8% Zimbabwe 7% Nepal 6% Thailand 8% English 7% Irish 6% American 6% German 3% African 2% Afghan 1% Somali
Year of entry for the foreign-born population
1,086 2010 or later 351 2000 to 2009 187 1990 to 1999 110 Before 1990
There are
164 Medical Specialists in Zip Code 40215 .
Facilities with environmental interests located in this zip code:
FRAYSER ELEMENTARY SCHOOL (1230 LARCHMONT AVENUE in LOUISVILLE, KY)
(National Center for Education Statistics) - STATE ID-056275290 Organizations: JEFFERSON COUNTY (SCHOOL DISTRICT)
FIVE STAR FORD MART #863 (3901 TAYLOR BLVD in LOUISVILLE, KY)
(Integrated Compliance Information System) - ICIS-HQ-1998-0022, FORMAL ENFORCEMENT ACTION Business SIC classification: LOCAL TRUCKING WITHOUT STORAGE; TRANSPORTATION SERVICES; PETROLEUM AND PETROLEUM PRODUCTS WHOLESALERS, EXCEPT BULK STATIONS AND TERMINALS
FORMER CHAPMAN PROPERTIES (1851 BERRY BLVD in LOUISVILLE, KY)
(Resource Conservation and Recovery Act (tracking hazardous waste)) Business NAICS classification: GENERAL AUTOMOTIVE REPAIR.Organizations: FIFTH THIRD BANK (CONTACT/OWNER)
3609 NICHOLS MEADOWS CIRCLE (3609 NICHOLS MEADOWS CIRCLE in LOUISVILLE, KY)
(Resource Conservation and Recovery Act (tracking hazardous waste)) Organizations: HOUSING AUTHORITY OF LOUISVILLE (CONTACT/OWNER)
A.C. TOOL & MACHINE CO. (1735 BERRY BLVD. in LOUISVILLE, KY)
(Resource Conservation and Recovery Act (tracking hazardous waste)) Organizations: MICHAEL R. CARTER & EVAN P. CARTER (CONTACT/OWNER)
ASHLAND CLEANERS (717 W ASHLAND AVE in LOUISVILLE, KY)
(Resource Conservation and Recovery Act (tracking hazardous waste)) Organizations: ROBYN RICHARDS (CONTACT/OWNER)
BP OIL COMPANY (4406 TAYLOR BLVD in LOUISVILLE, KY)
(Resource Conservation and Recovery Act (tracking hazardous waste)) Organizations: KIEL BROTHERS OIL COMPANY (CONTACT/OWNER)
NELLIE B GRAY (4105 TAYLOR BLVD in LOUISVILLE, KY)
(Resource Conservation and Recovery Act (tracking hazardous waste))
CARITAS MEDICAL CENTER (1850 BLUEGRASS AVE. in LOUISVILLE, KY)
Conditionally Exempt Small Quantity Generators, less than 100 kg/month of hazardous waste (Resource Conservation and Recovery Act (tracking hazardous waste)) - notification
COMMONWEALTH SIGN CO (1824 BERRY BLVD. in LOUISVILLE, KY)
Small Quantity Generators, between 100 kg and 1000 kg of hazardous waste/month (Resource Conservation and Recovery Act (tracking hazardous waste)) - notification Organizations: JOLLY PIEPER LLC (CONTACT/OWNER)
CARITAS HEALTH CENTER (4400 CHURCHMAN AVE in LOUISVILLE, KY)
AIR SYNTHETIC MINOR (AIRS/AFS) Alternative names: SAINTS MARY & ELIZABETH HOSPITAL
Housing units lacking complete plumbing facilities: 3.3%
Housing units lacking complete kitchen facilities: 6.2%
65.2% Utility gas 32.3% Electricity 1.3% Bottled, tank, or LP gas 0.7% Other fuel
Population in 1990: 24,661. Population change in the 1990s: +476 (+1.9%).
Place of birth for U.S.-born residents:
This state: 14,057Northeast: 382Midwest: 1,536South: 1,243West: 575
51% of the 40215 zip code residents lived in the same house 5 years ago.
Out of people who lived in different houses, 86% lived in this county.
Out of people who lived in different counties, 50% lived in Kentucky.
84% of the 40215 zip code residents lived in the same house 1 year ago.
Out of people who lived in different houses, 72% moved from this county.
Out of people who lived in different houses, 9% moved from different county within same state.
Out of people who lived in different houses, 12% moved from different state.
Out of people who lived in different houses, 4% moved from abroad.
Private vs. public school enrollment:
Students in private schools in grades 1 to 8 (elementary and middle school): 299
Students in private schools in grades 9 to 12 (high school): 118
Students in private undergraduate colleges: 96
Occupation by median earnings in the past 12 months ($)
74,829 Computer and mathematical occupations 64,152 Law enforcement workers including supervisors 59,742 Health diagnosing and treating practitioners and other technical occupations 57,367 Business and financial operations occupations 46,901 Education, training, and library occupations 46,090 Management occupations
Top industries in this zip code by the number of employees in 2005:
Health Care and Social Assistance: General Medical and Surgical Hospitals (over 1000 employees: 1 establishment)Health Care and Social Assistance: Offices of Physicians (except Mental Health Specialists) (100-249: 1, 20-49: 6, 10-19: 6, 5-9: 8, 1-4: 11)Accommodation and Food Services: Limited-Service Restaurants (20-49: 5, 10-19: 2, 5-9: 1, 1-4: 1)Health Care and Social Assistance: Child Day Care Services (20-49: 3, 5-9: 1, 1-4: 3)Other Services (except Public Administration): Religious Organizations (20-49: 1, 10-19: 1, 5-9: 4, 1-4: 8)Other Services (except Public Administration): Labor Unions and Similar Labor Organizations (50-99: 1, 5-9: 1)Administrative and Support and Waste Management and Remediation Services: Janitorial Services (50-99: 1, 1-4: 2)Accommodation and Food Services: Food Service Contractors (50-99: 1)Health Care and Social Assistance: Services for the Elderly and Persons with Disabilities (50-99: 1)
People in group quarters in 2010:
141 people in state prisons
17 people in residential treatment centers for juveniles (non-correctional)
People in group quarters in 2000:
188 people in homes for the mentally retarded
117 people in nursing homes
15 people in homes or halfway houses for drug/alcohol abuse
4 people in religious group quarters
Fatal accident statistics in 2014:
Fatal accident count: 2Vehicles involved in fatal accidents: 5Fatal accidents caused by drunken drivers: 0Fatalities: 4Persons involved in fatal accidents: 6Pedestrians involved in fatal accidents: 0
Fatal accident statistics in 2013:
Fatal accident count: 6Vehicles involved in fatal accidents: 10Fatal accidents caused by drunken drivers: 4Fatalities: 6Persons involved in fatal accidents: 13Pedestrians involved in fatal accidents: 0
Home Mortgage Disclosure Act Aggregated Statistics For Year 2009(Based on 5 full and 14 partial tracts) A) FHA, FSA/RHS & VA B) Conventional C) Refinancings D) Home Improvement Loans E) Loans on Dwellings For 5+ Families F) Non-occupant Loans on G) Loans On Manufactured Number Average Value Number Average Value Number Average Value Number Average Value Number Average Value Number Average Value Number Average Value
LOANS ORIGINATED 101 $85,717 131 $58,993 316 $79,995 40 $34,441 6 $346,182 187 $59,226 0 $0 APPLICATIONS APPROVED, NOT ACCEPTED 8 $89,716 10 $42,314 31 $75,485 6 $23,078 0 $0 5 $63,262 1 $21,640 APPLICATIONS DENIED 22 $80,658 51 $55,761 246 $77,833 55 $27,965 2 $332,580 44 $56,567 1 $49,780 APPLICATIONS WITHDRAWN 18 $74,174 10 $71,464 107 $80,491 6 $70,597 2 $143,780 23 $65,015 0 $0 FILES CLOSED FOR INCOMPLETENESS 2 $41,415 0 $0 29 $76,592 2 $61,990 0 $0 3 $52,240 0 $0
Aggregated Statistics For Year 2008(Based on 5 full and 14 partial tracts) A) FHA, FSA/RHS & VA B) Conventional C) Refinancings D) Home Improvement Loans E) Loans on Dwellings For 5+ Families F) Non-occupant Loans on G) Loans On Manufactured Number Average Value Number Average Value Number Average Value Number Average Value Number Average Value Number Average Value Number Average Value
LOANS ORIGINATED 123 $78,822 214 $61,095 292 $73,749 44 $26,958 4 $211,018 249 $60,192 11 $24,027 APPLICATIONS APPROVED, NOT ACCEPTED 4 $53,642 24 $50,622 62 $72,288 8 $19,181 0 $0 32 $57,151 10 $25,386 APPLICATIONS DENIED 32 $73,995 43 $59,416 377 $79,022 132 $36,562 0 $0 79 $57,230 6 $18,735 APPLICATIONS WITHDRAWN 14 $83,456 16 $51,706 106 $81,553 15 $48,975 3 $961,123 16 $83,915 0 $0 FILES CLOSED FOR INCOMPLETENESS 4 $70,280 5 $111,312 30 $76,042 3 $26,217 2 $640,750 7 $43,390 0 $0
Aggregated Statistics For Year 2007(Based on 5 full and 14 partial tracts) A) FHA, FSA/RHS & VA B) Conventional C) Refinancings D) Home Improvement Loans E) Loans on Dwellings For 5+ Families F) Non-occupant Loans on G) Loans On Manufactured Number Average Value Number Average Value Number Average Value Number Average Value Number Average Value Number Average Value Number Average Value
LOANS ORIGINATED 82 $82,931 349 $69,431 417 $71,722 64 $28,028 8 $1,848,519 287 $66,371 9 $20,686 APPLICATIONS APPROVED, NOT ACCEPTED 4 $72,865 48 $62,942 80 $72,006 21 $32,703 0 $0 32 $58,791 14 $23,771 APPLICATIONS DENIED 13 $86,737 101 $75,243 515 $75,800 129 $28,387 1 $307,600 84 $63,173 5 $66,180 APPLICATIONS WITHDRAWN 6 $84,287 36 $76,256 174 $78,187 7 $31,150 2 $93,770 31 $59,108 1 $104,580 FILES CLOSED FOR INCOMPLETENESS 3 $94,403 15 $72,762 42 $84,700 5 $52,948 0 $0 7 $66,650 0 $0
Aggregated Statistics For Year 2006(Based on 5 full and 14 partial tracts) A) FHA, FSA/RHS & VA B) Conventional C) Refinancings D) Home Improvement Loans E) Loans on Dwellings For 5+ Families F) Non-occupant Loans on G) Loans On Manufactured Number Average Value Number Average Value Number Average Value Number Average Value Number Average Value Number Average Value Number Average Value
LOANS ORIGINATED 85 $85,710 414 $64,263 597 $66,269 106 $30,969 12 $294,176 381 $61,793 8 $15,364 APPLICATIONS APPROVED, NOT ACCEPTED 4 $62,495 77 $59,324 128 $66,271 16 $23,921 0 $0 54 $73,350 12 $19,468 APPLICATIONS DENIED 24 $75,424 120 $69,498 488 $68,698 140 $28,521 0 $0 66 $69,436 10 $18,310 APPLICATIONS WITHDRAWN 3 $96,627 69 $344,307 213 $75,242 24 $33,678 0 $0 39 $57,406 1 $6,280 FILES CLOSED FOR INCOMPLETENESS 1 $82,680 12 $63,821 54 $86,882 2 $24,025 0 $0 6 $64,153 0 $0
Aggregated Statistics For Year 2005(Based on 5 full and 14 partial tracts) A) FHA, FSA/RHS & VA B) Conventional C) Refinancings D) Home Improvement Loans E) Loans on Dwellings For 5+ Families F) Non-occupant Loans on G) Loans On Manufactured Number Average Value Number Average Value Number Average Value Number Average Value Number Average Value Number Average Value Number Average Value
LOANS ORIGINATED 113 $86,645 451 $63,153 742 $67,258 112 $32,560 10 $557,309 413 $62,071 0 $0 APPLICATIONS APPROVED, NOT ACCEPTED 11 $71,837 112 $58,496 141 $75,660 11 $14,124 1 $161,250 34 $64,455 11 $22,832 APPLICATIONS DENIED 18 $79,498 188 $71,931 601 $73,654 135 $25,705 0 $0 108 $64,752 22 $34,846 APPLICATIONS WITHDRAWN 14 $72,934 88 $109,870 247 $82,329 28 $91,614 0 $0 57 $128,448 0 $0 FILES CLOSED FOR INCOMPLETENESS 2 $73,865 42 $64,500 55 $82,804 8 $57,285 0 $0 21 $81,639 0 $0
Aggregated Statistics For Year 2004(Based on 5 full and 14 partial tracts) A) FHA, FSA/RHS & VA B) Conventional C) Refinancings D) Home Improvement Loans E) Loans on Dwellings For 5+ Families F) Non-occupant Loans on G) Loans On Manufactured Number Average Value Number Average Value Number Average Value Number Average Value Number Average Value Number Average Value Number Average Value
LOANS ORIGINATED 119 $80,763 416 $66,080 990 $65,542 104 $32,066 5 $215,006 524 $61,415 2 $43,070 APPLICATIONS APPROVED, NOT ACCEPTED 7 $64,477 75 $70,653 206 $68,148 15 $21,365 0 $0 40 $65,780 10 $25,307 APPLICATIONS DENIED 28 $71,261 138 $60,086 627 $68,203 126 $28,648 1 $16,230 98 $56,748 23 $49,744 APPLICATIONS WITHDRAWN 12 $75,278 59 $66,298 352 $69,775 23 $44,076 0 $0 59 $61,762 0 $0 FILES CLOSED FOR INCOMPLETENESS 2 $69,605 21 $74,634 52 $69,971 1 $22,980 0 $0 5 $53,096 0 $0
Aggregated Statistics For Year 2003(Based on 5 full and 14 partial tracts) A) FHA, FSA/RHS & VA B) Conventional C) Refinancings D) Home Improvement Loans E) Loans on Dwellings For 5+ Families F) Non-occupant Loans on Number Average Value Number Average Value Number Average Value Number Average Value Number Average Value Number Average Value
LOANS ORIGINATED 117 $82,139 343 $64,739 1,245 $67,566 107 $22,774 5 $1,100,418 401 $61,561 APPLICATIONS APPROVED, NOT ACCEPTED 4 $85,395 43 $62,526 224 $64,152 16 $23,359 0 $0 37 $63,221 APPLICATIONS DENIED 12 $67,506 105 $60,366 714 $65,291 105 $19,500 4 $74,942 102 $56,050 APPLICATIONS WITHDRAWN 15 $83,297 50 $69,564 296 $74,858 9 $25,021 0 $0 52 $57,705 FILES CLOSED FOR INCOMPLETENESS 4 $98,638 22 $79,428 87 $68,019 4 $58,100 0 $0 21 $57,322
Aggregated Statistics For Year 2002(Based on 5 full and 14 partial tracts) A) FHA, FSA/RHS & VA B) Conventional C) Refinancings D) Home Improvement Loans E) Loans on Dwellings For 5+ Families F) Non-occupant Loans on Number Average Value Number Average Value Number Average Value Number Average Value Number Average Value Number Average Value
LOANS ORIGINATED 147 $75,698 295 $59,507 1,064 $62,235 109 $15,964 4 $276,165 452 $54,249 APPLICATIONS APPROVED, NOT ACCEPTED 17 $65,758 32 $60,948 197 $64,511 16 $18,174 0 $0 10 $62,217 APPLICATIONS DENIED 13 $79,327 82 $63,608 544 $60,000 112 $14,526 0 $0 47 $63,093 APPLICATIONS WITHDRAWN 14 $79,099 32 $74,749 222 $69,763 12 $27,008 1 $919,870 18 $59,876 FILES CLOSED FOR INCOMPLETENESS 10 $56,655 9 $69,863 65 $71,535 1 $35,550 0 $0 6 $79,357
Aggregated Statistics For Year 2001(Based on 5 full and 14 partial tracts) A) FHA, FSA/RHS & VA B) Conventional C) Refinancings D) Home Improvement Loans E) Loans on Dwellings For 5+ Families F) Non-occupant Loans on Number Average Value Number Average Value Number Average Value Number Average Value Number Average Value Number Average Value
LOANS ORIGINATED 155 $75,555 324 $61,897 1,214 $54,189 197 $15,603 5 $259,834 538 $52,769 APPLICATIONS APPROVED, NOT ACCEPTED 8 $60,684 23 $63,551 173 $53,221 45 $18,680 0 $0 29 $56,779 APPLICATIONS DENIED 33 $72,490 98 $55,642 551 $54,971 188 $13,347 3 $107,283 71 $46,439 APPLICATIONS WITHDRAWN 11 $71,686 28 $59,128 275 $62,791 12 $18,738 0 $0 37 $66,528 FILES CLOSED FOR INCOMPLETENESS 2 $52,430 5 $61,814 50 $62,605 1 $21,640 0 $0 5 $50,994
Aggregated Statistics For Year 2000(Based on 5 full and 14 partial tracts) A) FHA, FSA/RHS & VA B) Conventional C) Refinancings D) Home Improvement Loans E) Loans on Dwellings For 5+ Families F) Non-occupant Loans on Number Average Value Number Average Value Number Average Value Number Average Value Number Average Value Number Average Value
LOANS ORIGINATED 219 $70,864 277 $60,023 536 $50,532 179 $15,138 3 $177,960 250 $54,304 APPLICATIONS APPROVED, NOT ACCEPTED 17 $64,324 46 $52,113 152 $47,426 56 $19,164 0 $0 27 $41,015 APPLICATIONS DENIED 34 $68,022 126 $41,393 412 $46,440 236 $11,463 0 $0 33 $37,534 APPLICATIONS WITHDRAWN 14 $57,076 51 $56,890 209 $50,213 23 $24,705 0 $0 20 $56,798 FILES CLOSED FOR INCOMPLETENESS 8 $53,168 4 $34,010 28 $52,517 2 $22,500 0 $0 4 $36,192
Aggregated Statistics For Year 1999(Based on 3 full and 7 partial tracts) A) FHA, FSA/RHS & VA B) Conventional C) Refinancings D) Home Improvement Loans E) Loans on Dwellings For 5+ Families F) Non-occupant Loans on Number Average Value Number Average Value Number Average Value Number Average Value Number Average Value Number Average Value
LOANS ORIGINATED 134 $67,205 166 $54,790 457 $51,151 128 $12,908 2 $538,360 190 $51,573 APPLICATIONS APPROVED, NOT ACCEPTED 2 $87,855 21 $58,468 134 $47,845 34 $11,849 0 $0 10 $49,947 APPLICATIONS DENIED 16 $68,782 67 $42,582 263 $48,525 121 $11,898 1 $66,390 27 $30,336 APPLICATIONS WITHDRAWN 5 $76,014 22 $76,087 146 $54,251 14 $21,061 0 $0 10 $85,354 FILES CLOSED FOR INCOMPLETENESS 1 $59,610 2 $92,485 35 $55,653 1 $29,700 0 $0 3 $42,763
Private Mortgage Insurance Companies Aggregated Statistics For Year 2009(Based on 2 full and 12 partial tracts) A) Conventional B) Refinancings Number Average Value Number Average Value
LOANS ORIGINATED 7 $108,187 13 $88,912 APPLICATIONS APPROVED, NOT ACCEPTED 5 $110,816 8 $99,914 APPLICATIONS DENIED 0 $0 2 $175,715 APPLICATIONS WITHDRAWN 0 $0 0 $0 FILES CLOSED FOR INCOMPLETENESS 0 $0 0 $0
Aggregated Statistics For Year 2008(Based on 5 full and 14 partial tracts) A) Conventional B) Refinancings C) Non-occupant Loans on Number Average Value Number Average Value Number Average Value
LOANS ORIGINATED 40 $79,185 20 $77,162 18 $61,037 APPLICATIONS APPROVED, NOT ACCEPTED 19 $141,519 11 $104,387 8 $67,534 APPLICATIONS DENIED 3 $37,067 7 $77,320 0 $0 APPLICATIONS WITHDRAWN 10 $186,891 0 $0 0 $0 FILES CLOSED FOR INCOMPLETENESS 0 $0 1 $172,070 0 $0
Aggregated Statistics For Year 2007(Based on 5 full and 14 partial tracts) A) Conventional B) Refinancings C) Non-occupant Loans on Number Average Value Number Average Value Number Average Value
LOANS ORIGINATED 160 $79,740 52 $87,803 35 $74,501 APPLICATIONS APPROVED, NOT ACCEPTED 23 $91,413 6 $78,455 5 $83,718 APPLICATIONS DENIED 1 $155,840 0 $0 0 $0 APPLICATIONS WITHDRAWN 11 $92,294 3 $100,567 5 $108,298 FILES CLOSED FOR INCOMPLETENESS 0 $0 2 $70,325 0 $0
Aggregated Statistics For Year 2006(Based on 5 full and 14 partial tracts) A) Conventional B) Refinancings C) Non-occupant Loans on Number Average Value Number Average Value Number Average Value
LOANS ORIGINATED 108 $78,415 42 $84,530 38 $65,067 APPLICATIONS APPROVED, NOT ACCEPTED 20 $71,868 13 $87,140 10 $79,372 APPLICATIONS DENIED 2 $79,690 2 $106,605 1 $121,790 APPLICATIONS WITHDRAWN 8 $70,631 5 $88,936 2 $107,010 FILES CLOSED FOR INCOMPLETENESS 0 $0 0 $0 0 $0
Aggregated Statistics For Year 2005(Based on 5 full and 14 partial tracts) A) Conventional B) Refinancings C) Non-occupant Loans on Number Average Value Number Average Value Number Average Value
LOANS ORIGINATED 86 $76,981 45 $78,607 32 $69,667 APPLICATIONS APPROVED, NOT ACCEPTED 20 $70,208 17 $88,804 11 $66,390 APPLICATIONS DENIED 2 $45,390 0 $0 0 $0 APPLICATIONS WITHDRAWN 1 $148,360 8 $80,409 0 $0 FILES CLOSED FOR INCOMPLETENESS 2 $55,730 3 $96,210 2 $55,730
Aggregated Statistics For Year 2004(Based on 5 full and 14 partial tracts) A) Conventional B) Refinancings C) Non-occupant Loans on Number Average Value Number Average Value Number Average Value
LOANS ORIGINATED 96 $77,058 63 $78,852 52 $67,369 APPLICATIONS APPROVED, NOT ACCEPTED 16 $64,221 38 $73,378 16 $55,007 APPLICATIONS DENIED 9 $127,010 3 $79,790 7 $97,809 APPLICATIONS WITHDRAWN 6 $105,513 9 $75,759 5 $57,892 FILES CLOSED FOR INCOMPLETENESS 2 $88,300 4 $80,855 2 $88,300
Aggregated Statistics For Year 2003(Based on 5 full and 14 partial tracts) A) Conventional B) Refinancings C) Non-occupant Loans on Number Average Value Number Average Value Number Average Value
LOANS ORIGINATED 112 $71,360 127 $79,622 51 $60,649 APPLICATIONS APPROVED, NOT ACCEPTED 11 $88,857 30 $71,277 16 $58,152 APPLICATIONS DENIED 0 $0 0 $0 0 $0 APPLICATIONS WITHDRAWN 2 $133,170 19 $75,229 11 $67,385 FILES CLOSED FOR INCOMPLETENESS 0 $0 1 $77,000 0 $0
Aggregated Statistics For Year 2002(Based on 5 full and 14 partial tracts) A) Conventional B) Refinancings C) Non-occupant Loans on Number Average Value Number Average Value Number Average Value
LOANS ORIGINATED 61 $66,959 107 $77,552 28 $58,961 APPLICATIONS APPROVED, NOT ACCEPTED 8 $82,104 23 $78,302 3 $40,093 APPLICATIONS DENIED 3 $136,813 1 $117,470 1 $71,590 APPLICATIONS WITHDRAWN 3 $89,753 19 $84,741 4 $54,710 FILES CLOSED FOR INCOMPLETENESS 0 $0 0 $0 0 $0
Aggregated Statistics For Year 2001(Based on 5 full and 14 partial tracts) A) Conventional B) Refinancings C) Non-occupant Loans on Number Average Value Number Average Value Number Average Value
LOANS ORIGINATED 86 $73,195 109 $76,914 18 $67,862 APPLICATIONS APPROVED, NOT ACCEPTED 9 $78,807 9 $87,380 0 $0 APPLICATIONS DENIED 1 $79,520 3 $71,603 0 $0 APPLICATIONS WITHDRAWN 0 $0 5 $95,124 0 $0 FILES CLOSED FOR INCOMPLETENESS 0 $0 1 $103,590 0 $0
Aggregated Statistics For Year 2000(Based on 5 full and 14 partial tracts) A) Conventional B) Refinancings C) Non-occupant Loans on Number Average Value Number Average Value Number Average Value
LOANS ORIGINATED 63 $68,619 34 $64,747 13 $67,734 APPLICATIONS APPROVED, NOT ACCEPTED 8 $62,175 6 $60,453 3 $49,280 APPLICATIONS DENIED 3 $47,360 2 $80,680 1 $84,190 APPLICATIONS WITHDRAWN 8 $67,105 0 $0 0 $0 FILES CLOSED FOR INCOMPLETENESS 0 $0 0 $0 0 $0
Aggregated Statistics For Year 1999(Based on 3 full and 7 partial tracts) A) Conventional B) Refinancings C) Non-occupant Loans on Number Average Value Number Average Value Number Average Value
LOANS ORIGINATED 31 $71,075 24 $55,401 3 $40,620 APPLICATIONS APPROVED, NOT ACCEPTED 2 $43,930 4 $71,282 1 $54,000 APPLICATIONS DENIED 1 $84,660 2 $51,685 0 $0 APPLICATIONS WITHDRAWN 1 $47,300 0 $0 0 $0 FILES CLOSED FOR INCOMPLETENESS 0 $0 0 $0 0 $0
2002 - 2018 National Fire Incident Reporting System (NFIRS) incidents See full 2006 National Fire Incident Reporting System statistics for zip code 40215, Kentucky
Most common first names in zip code 40215 among deceased individuals Name Count Lived (average)
Mary 393 75.6 years William 299 72.0 years James 299 69.1 years John 239 72.0 years Charles 198 70.0 years Robert 154 68.3 years Joseph 148 72.8 years George 134 72.0 years Anna 92 78.1 years Dorothy 91 73.0 years
Most common last names in zip code 40215 among deceased individuals Last name Count Lived (average)
Smith 96 73.2 years Brown 88 71.5 years Jones 74 71.4 years Miller 68 73.8 years Johnson 63 73.0 years Williams 49 70.6 years Wilson 45 67.9 years Clark 41 72.5 years Martin 40 77.4 years Thompson 40 67.2 years
Businesses in zip code 40215
Name Count Name Count
Cricket Wireless 2 Long John Silver's 1 Dairy Queen 1 McDonald's 1 H&R Block 1 Rite Aid 1 Hardee's 1 U-Haul 1 KFC 1 Wendy's 1


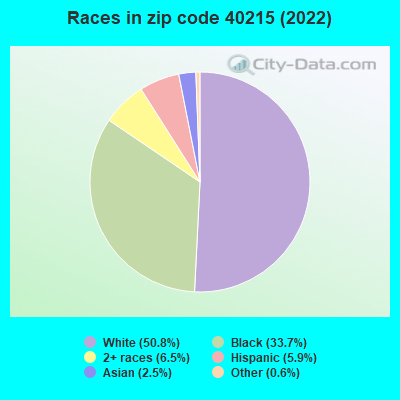


 Nearest zip codes: 40208, 40209, 40214, 40210, 40216, 40217.
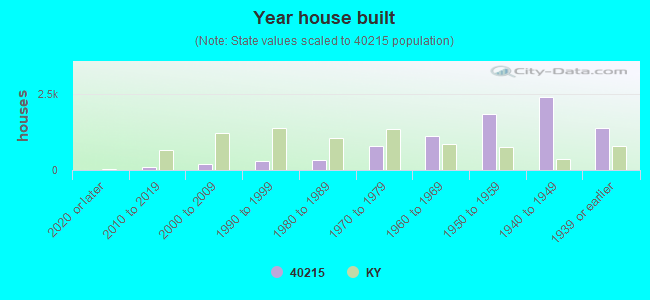

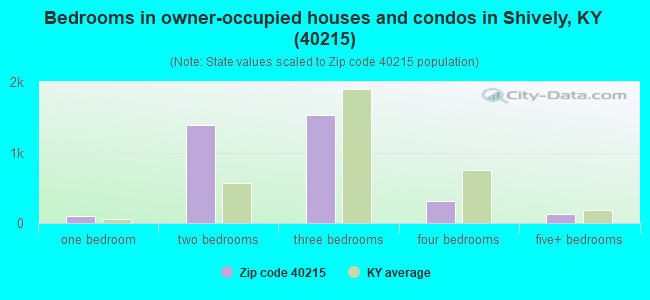


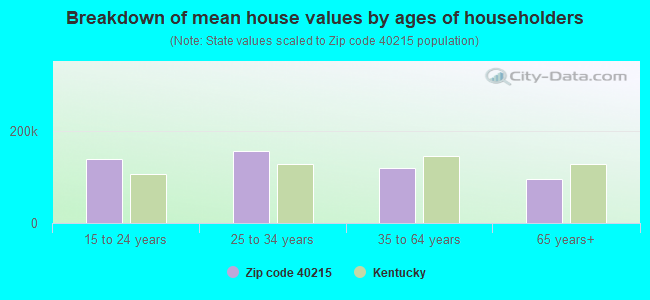


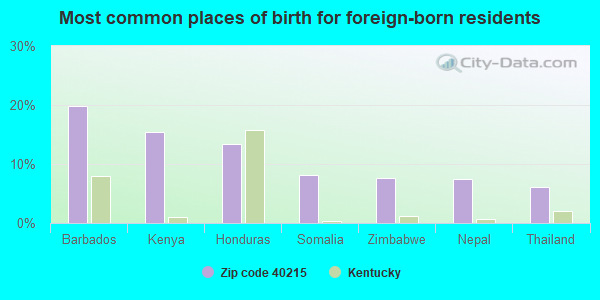
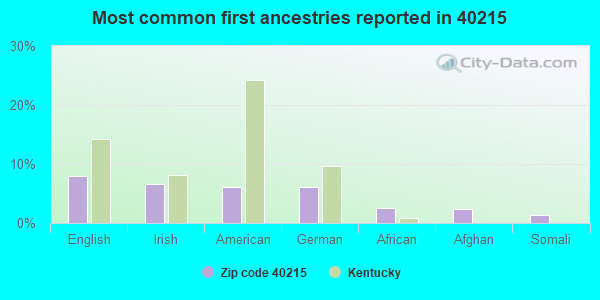
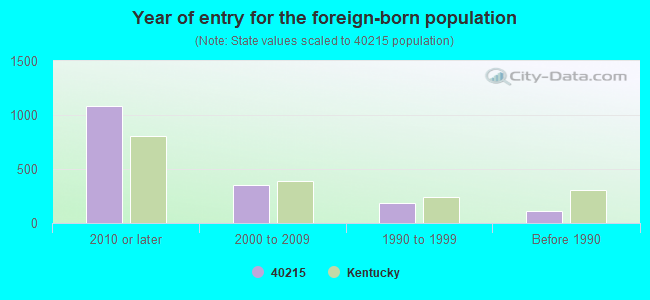


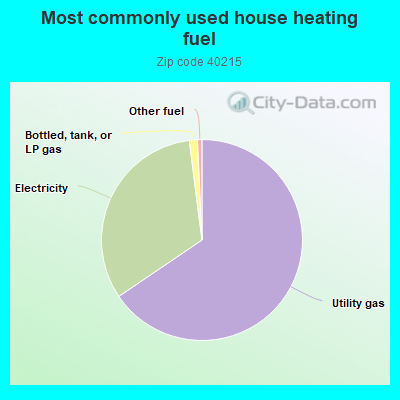
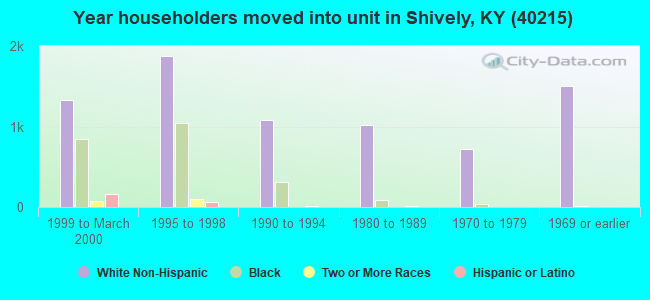
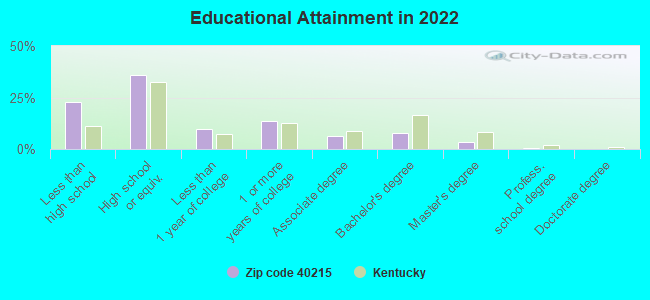
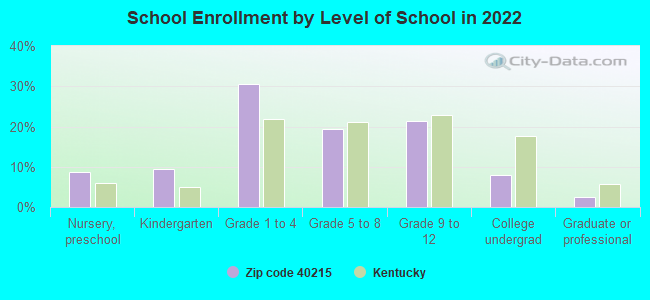
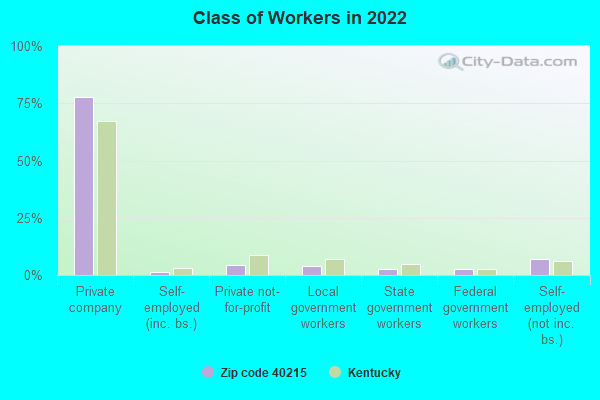
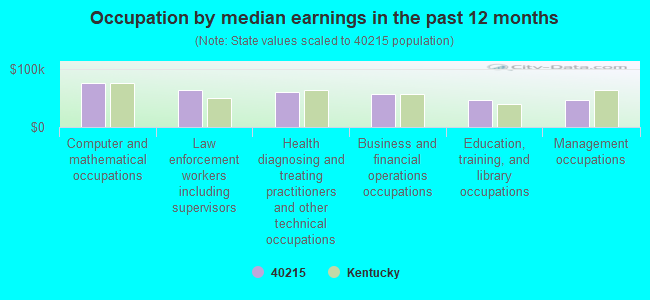
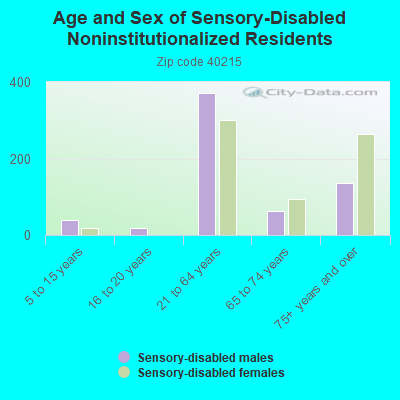
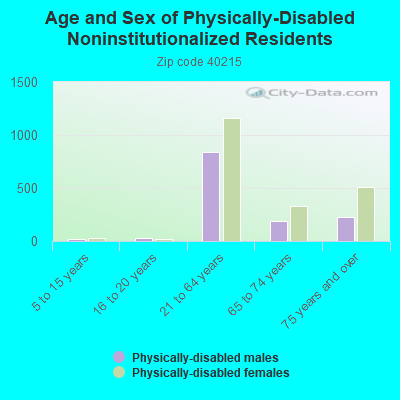
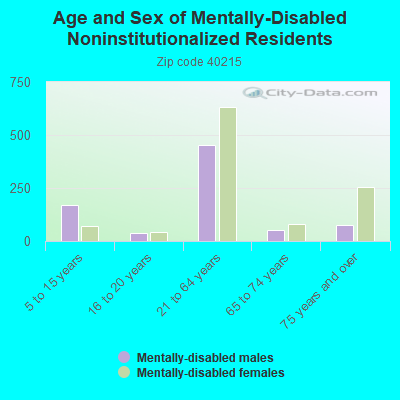
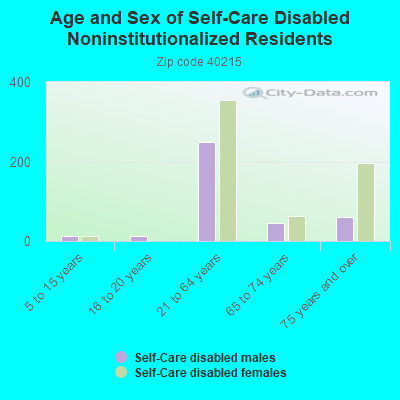
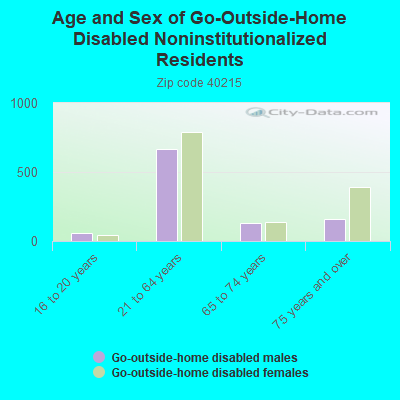
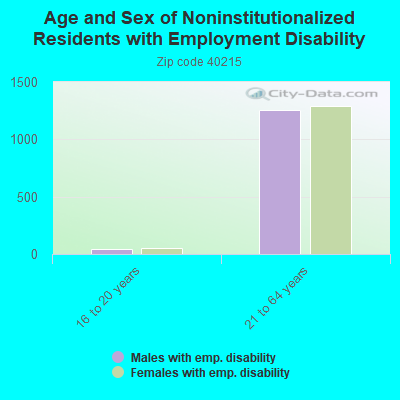
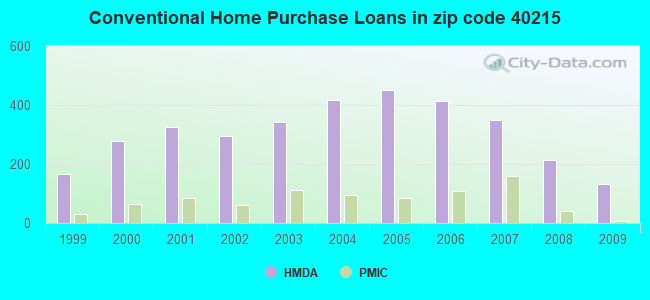
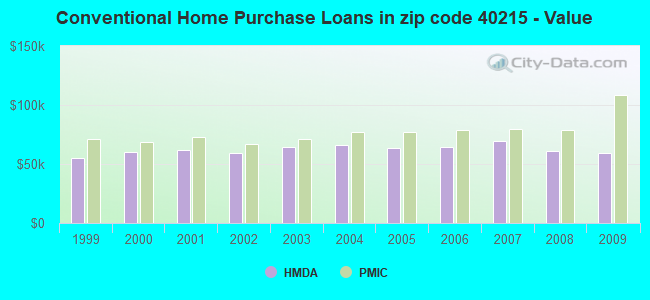
 Based on the data from the years 2002 - 2018 the average number of fires per year is 123. The highest number of fire incidents - 197 took place in 2003, and the least - 47 in 2002. The data has a growing trend.
 When looking into fire subcategories, the most incidents belonged to: Outside Fires (44.3%), and Structure Fires (31.1%).