Estimated zip code population in 2022: 4,844 Zip code population in 2010: 5,409 Zip code population in 2000: 6,501
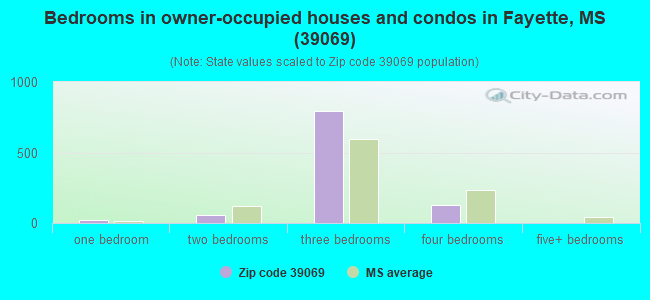
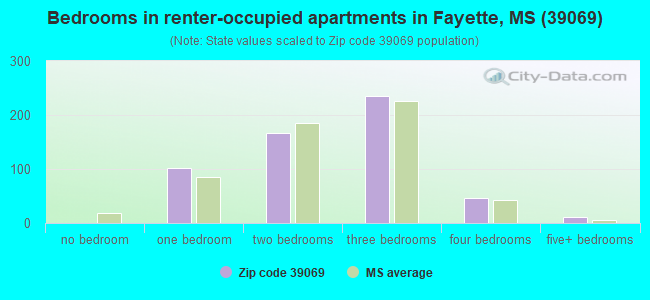
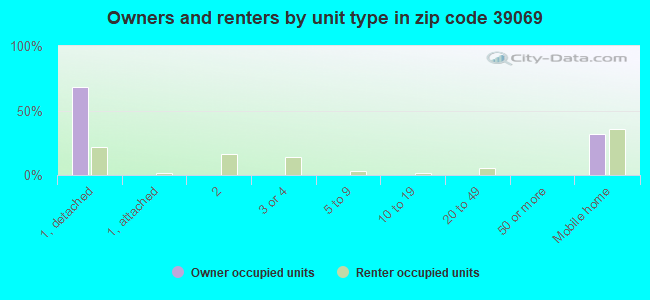
Houses and condos: 2,030 Renter-occupied apartments: 559
% of renters here:
36%
State:
30%
March 2022 cost of living index in zip code 39069: 76.6 (low, U.S. average is 100)
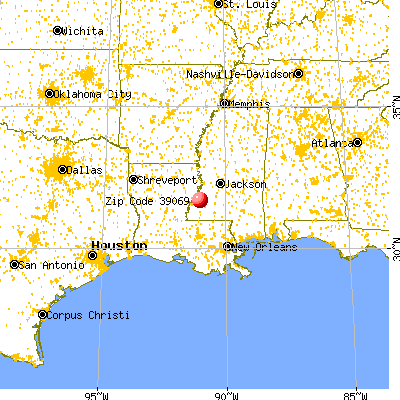
Land area: 176.3 sq. mi. Water area: 0.1 sq. mi.
Population density: 27 people per square mile
(very low).
OSM Map
General Map
Google Map
MSN Map
OSM Map
General Map
Google Map
MSN Map
OSM Map
General Map
Google Map
MSN Map
OSM Map
General Map
Google Map
MSN Map
Please wait while loading the map...
Real estate property taxes paid for housing units in 2022:
This zip code:
0.8% ($654)
Mississippi:
0.7% ($1,161)
Median real estate property taxes paid for housing units with mortgages in 2022: $714 (0.9%) Median real estate property taxes paid for housing units with no mortgage in 2022: $602 (0.8%)
Business Search- 14 Million verified businesses
Males: 2,274
(47.0%)
Females: 2,569
(53.0%)
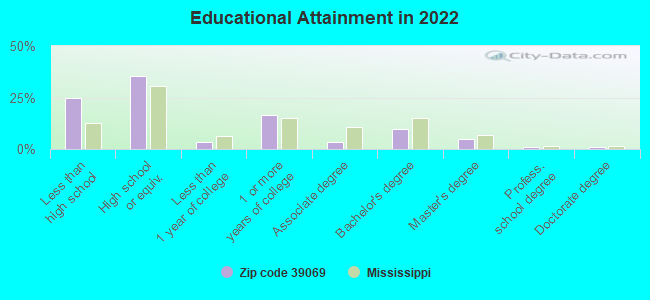
For population 25 years and over in 39069:
High school or higher: 75.2%
Bachelor's degree or higher: 16.3%
Graduate or professional degree: 6.8%
Unemployed: 3.5%
Mean travel time to work (commute): 19.6 minutes
For population 15 years and over in 39069:
Never married: 51.6%
Now married: 26.4%
Separated: 1.6%
Widowed: 9.7%
Divorced: 10.7%
Zip code 39069 compared to state average:
Median household income below state average.
Median house value below state average.
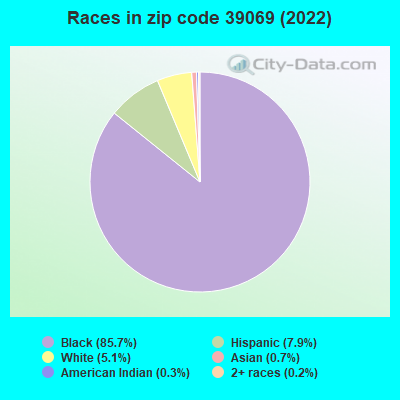
Black race population percentage above state average.
Hispanic race population percentage above state average.
Foreign-born population percentage significantly below state average.
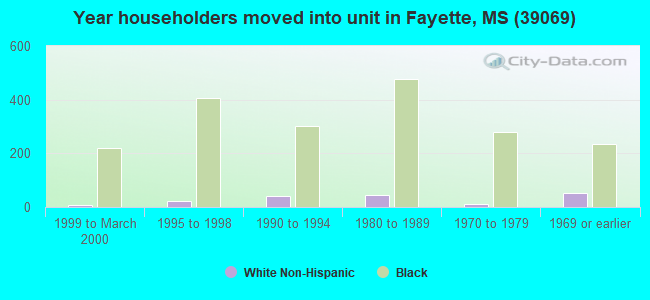
Length of stay since moving in significantly above state average.
Percentage of population with a bachelor's degree or higher below state average.
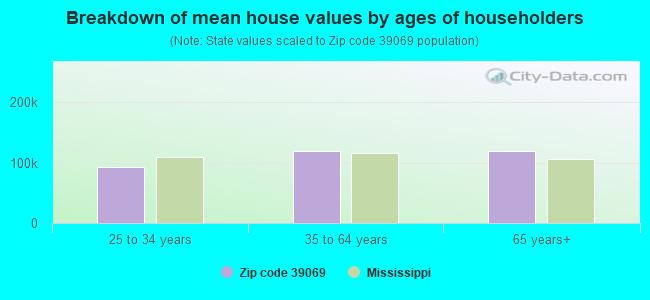
Estimated median house/condo value in 2022: $77,483
39069:
$77,483
Mississippi:
$162,500
According to our research of Mississippi and other state lists, there were 17 registered sex offenders living in 39069 zip code as of May 22, 2024. The ratio of all residents to sex offenders in zip code 39069 is 358 to 1. The ratio of registered sex offenders to all residents in this zip code is near the state average.
Median resident age:
This zip code:
36.8 years
Mississippi median age:
38.9 years
Average household size:
This zip code:
2.8 people
Mississippi:
2.5 people
Averages for the 2020 tax year for zip code 39069, filed in 2021:
Average Adjusted Gross Income (AGI) in 2020: $32,349 (Individual Income Tax Returns)
Here:
$32,349
State:
$54,084
Salary/wage: $32,739 (reported on 83.6% of returns)
Here:
$32,739
State:
$45,187
(% of AGI for various income ranges: 1599.4% for AGIs below $25k, 4235.0% for AGIs $25k-50k, 7669.1% for AGIs $50k-75k, 11198.0% for AGIs $75k-100k, 22477.5% for AGIs $100k-200k)
Taxable interest for individuals: $420 (reported on 11.7% of returns)
This zip code:
$420
Mississippi:
$1,434
(% of AGI for various income ranges: 1.5% for AGIs below $25k, 2.0% for AGIs $25k-50k, 12.7% for AGIs $50k-75k, 22.0% for AGIs $75k-100k, 142.5% for AGIs $100k-200k)
Ordinary dividends: $925 (reported on 1.9% of returns)
Here:
$925
State:
$6,661
(% of AGI for various income ranges: 0.9% for AGIs below $25k, 58.0% for AGIs $75k-100k)
Net capital gain/loss in AGI: +$8,075 (reported on 1.9% of returns)
Here:
+$8,075
State:
+$16,833
(% of AGI for various income ranges: 293.6% for AGIs $50k-75k)
Taxable individual retirement arrangement distribution: $9,600 (reported on 2.3% of returns)
39069:
$9,600
Mississippi:
$17,717
(% of AGI for various income ranges: 18.5% for AGIs below $25k, 288.2% for AGIs $50k-75k)
Total itemized deductions: $29,718 (reported on 5.2% of returns)
Here:
$29,718
State:
$34,027
(% of AGI for various income ranges: 186.8% for AGIs $25k-50k, 596.4% for AGIs $50k-75k, 1406.0% for AGIs $75k-100k, 2440.0% for AGIs $100k-200k)
Charity contributions: $9,900 (reported on 4.7% of returns)
Here:
$9,900
State:
$14,997
(% of AGI for various income ranges: 41.0% for AGIs $25k-50k, 169.1% for AGIs $50k-75k, 472.0% for AGIs $75k-100k, 907.5% for AGIs $100k-200k)
Taxes paid: $4,845 (reported on 5.2% of returns)
39069:
$4,845
State:
$6,353
(% of AGI for various income ranges: 33.2% for AGIs $25k-50k, 74.5% for AGIs $50k-75k, 216.0% for AGIs $75k-100k, 442.5% for AGIs $100k-200k)
Earned income credit: $2,973 (reported on 46.0% of returns)
Here:
$2,973
State:
$2,689
(% of AGI for various income ranges: 247.5% for AGIs below $25k, 147.2% for AGIs $25k-50k)
Percentage of individuals using paid preparers for their 2020 taxes: 86.4%
Here:
86%
State:
94%
(% for various income ranges: 85.7% for AGIs below $25k, 89.4% for AGIs $25k-50k, 82.4% for AGIs $50k-75k, 77.8% for AGIs $75k-100k, 88.9% for AGIs $100k-200k)
Averages for the 2012 tax year for zip code 39069, filed in 2013:
Average Adjusted Gross Income (AGI) in 2012: $28,196 (Individual Income Tax Returns)
Here:
$28,196
State:
$46,197
Salary/wage: $28,062 (reported on 88.5% of returns)
Here:
$28,062
State:
$38,549
(% of AGI for various income ranges: 101.2% for AGIs below $25k, 89.5% for AGIs $25k-50k, 82.9% for AGIs $50k-75k, 79.1% for AGIs $75k-100k, 65.1% for AGIs $100k-200k)
Taxable interest for individuals: $811 (reported on 12.9% of returns)
This zip code:
$811
Mississippi:
$1,482
(% of AGI for various income ranges: 0.4% for AGIs below $25k, 0.4% for AGIs $25k-50k, 0.1% for AGIs $50k-75k, 0.2% for AGIs $75k-100k, 0.7% for AGIs $100k-200k)
Ordinary dividends: $700 (reported on 2.8% of returns)
Here:
$700
State:
$5,401
Net capital gain/loss in AGI: +$1,067 (reported on 1.4% of returns)
Here:
+$1,067
State:
+$12,121
Taxable individual retirement arrangement distribution: $7,420 (reported on 2.3% of returns)
39069:
$7,420
Mississippi:
$13,665
Total itemized deductions: $20,416 (39% of AGI, reported on 20.7% of returns)
Here:
$20,416
State:
$22,078
Here:
39.3% of AGI
State:
21.8% of AGI
(% of AGI for various income ranges: 7.1% for AGIs below $25k, 17.6% for AGIs $25k-50k, 22.7% for AGIs $50k-75k, 17.1% for AGIs $75k-100k, 14.5% for AGIs $100k-200k)
Charity contributions: $4,678 (reported on 16.6% of returns)
Here:
$4,678
State:
$6,081
(% of AGI for various income ranges: 0.9% for AGIs below $25k, 2.9% for AGIs $25k-50k, 3.7% for AGIs $50k-75k, 4.8% for AGIs $75k-100k, 4.1% for AGIs $100k-200k)
Taxes paid: $3,149 (reported on 20.7% of returns)
39069:
$3,149
State:
$5,794
(% of AGI for various income ranges: 0.9% for AGIs below $25k, 2.2% for AGIs $25k-50k, 3.2% for AGIs $50k-75k, 3.2% for AGIs $75k-100k, 4.2% for AGIs $100k-200k)
Earned income credit: $2,978 (reported on 55.3% of returns)
Here:
$2,978
State:
$2,710
(% of AGI for various income ranges: 17.3% for AGIs below $25k, 2.2% for AGIs $25k-50k)
Percentage of individuals using paid preparers for their 2012 taxes: 59.0%
Here:
59%
State:
60%
(% for various income ranges: 54.2% for AGIs below $25k, 64.3% for AGIs $25k-50k, 66.7% for AGIs $50k-75k, 71.4% for AGIs $75k-100k, 80.0% for AGIs $100k-200k)
Averages for the 2004 tax year for zip code 39069, filed in 2005:
Average Adjusted Gross Income (AGI) in 2004: $22,898 (Individual Income Tax Returns)
Here:
$22,898
State:
$36,110
Salary/wage: $20,955 (reported on 92.1% of returns)
Here:
$20,955
State:
$31,757
(% of AGI for various income ranges: 92.8% for AGIs below $10k, 89.8% for AGIs $10k-25k, 88.9% for AGIs $25k-50k, 83.6% for AGIs $50k-75k, 71.0% for AGIs $75k-100k, 48.2% for AGIs over 100k)
Taxable interest for individuals: $1,022 (reported on 16.5% of returns)
This zip code:
$1,022
Mississippi:
$1,649
(% of AGI for various income ranges: 1.2% for AGIs below $10k, 0.9% for AGIs $10k-25k, 0.5% for AGIs $25k-50k, 0.9% for AGIs $50k-75k, 0.6% for AGIs $75k-100k, 0.4% for AGIs over 100k)
Taxable dividends: $1,000 (reported on 4.1% of returns)
Here:
$1,000
State:
$3,089
(% of AGI for various income ranges: 0.1% for AGIs $10k-25k, 0.0% for AGIs $25k-50k, 0.1% for AGIs $50k-75k, 1.6% for AGIs $75k-100k)
Net capital gain/loss: +$10,689 (reported on 3.1% of returns)
Here:
+$10,689
State:
+$8,427
(% of AGI for various income ranges: -0.0% for AGIs $10k-25k, 0.4% for AGIs $25k-50k, 1.7% for AGIs $50k-75k, 16.2% for AGIs $75k-100k)
Profit/loss from business: +$3,244 (reported on 9.2% of returns)
Here:
+$3,244
State:
+$8,818
(% of AGI for various income ranges: 5.5% for AGIs below $10k, 1.7% for AGIs $10k-25k, -0.8% for AGIs $25k-50k, 5.2% for AGIs $50k-75k)
Total itemized deductions: $17,531 (34% of AGI, reported on 12.2% of returns)
Here:
$17,531
State:
$17,896
Here:
33.8% of AGI
State:
22.5% of AGI
(% of AGI for various income ranges: 3.0% for AGIs $10k-25k, 12.2% for AGIs $25k-50k, 15.0% for AGIs $50k-75k, 15.9% for AGIs $75k-100k, 13.6% for AGIs over 100k)
Charity contributions deductions: $3,960 (8% of AGI, reported on 11.4% of returns)
Here:
$3,960
State:
$4,735
Here:
7.6% of AGI
State:
5.7% of AGI
(% of AGI for various income ranges: 0.6% for AGIs $10k-25k, 2.1% for AGIs $25k-50k, 3.7% for AGIs $50k-75k, 4.5% for AGIs $75k-100k, 3.0% for AGIs over 100k)
Total tax: $2,696 (reported on 42.0% of returns)
39069:
$2,696
State:
$5,562
(% of AGI for various income ranges: 1.7% for AGIs below $10k, 1.5% for AGIs $10k-25k, 4.0% for AGIs $25k-50k, 8.6% for AGIs $50k-75k, 9.7% for AGIs $75k-100k, 14.8% for AGIs over 100k)
Earned income credit: $2,293 (reported on 56.5% of returns)
Here:
$2,293
State:
$2,107
Percentage of individuals using paid preparers for their 2004 taxes: 66.6%
Here:
67%
State:
65%
(% for various income ranges: 61.6% for AGIs below $10k, 74.5% for AGIs $10k-25k, 57.9% for AGIs $25k-50k, 60.7% for AGIs $50k-75k, 62.9% for AGIs $75k-100k, 77.3% for AGIs over 100k)
Likely homosexual households (counted as self-reported same-sex unmarried-partner households)
Lesbian couples: 0.3% of all households
Gay men: 0.0% of all households
Household received Food Stamps/SNAP in the past 12 months: 521 Household did not receive Food Stamps/SNAP in the past 12 months: 1,049
Women who had a birth in the past 12 months: 7 (0 now married, 7 unmarried) Women who did not have a birth in the past 12 months: 1,030 (103 now married, 929 unmarried)
Housing units in zip code 39069 with a mortgage: 264 Median monthly owner costs for units with a mortgage: $855 Median monthly owner costs for units without a mortgage: $334
Residents with income below the poverty level in 2022:
This zip code:
34.4%
Whole state:
19.1%
Residents with income below 50% of the poverty level in 2022:
This zip code:
14.8%
Whole state:
10.3%
Median number of rooms in houses and condos:
Here:
5.3
State:
6.3
Median number of rooms in apartments:
Here:
4.6
State:
4.8
Notable locations in this zip code not listed on our city pages
Churches in zip code 39069 include: Pine Grove Church (A), Rose Hill Number 2 Church (B), Saint Anthonys Church (C), Mount Zion Church of God in Christ (D), Fayette Baptist Church (E), Taylor Chapel Baptist Church (F), Rose Hill Number 1 Church (G), Greenleaf Church (H), Clifton Church (I). Display/hide their locations on the map
Cemeteries: Thompson Cemetery (1), Marble Cemetery (2), Hughes Cemetery (3), Puffel Cemetery (4), Clark Cemetery (5), Saint Paul Cemetery (6), Darden Cemetery (7). Display/hide their locations on the map
Streams, rivers, and creeks: Beaver Branch (A), Turpin Creek (B), Burch Creek (C), Terry Creek (D), Tanyard Branch (E), Stampley Creek (F), Shankstown Creek (G), Ross Branch (H), Puffer Branch (I). Display/hide their locations on the map
In group quarters: 464 (-1 institutionalized population)
Size of family households: 489 2-persons, 230 3-persons, 231 4-persons, 245 5-persons, 7 6-persons, 18 7-or-more-persons
Size of nonfamily households: 350 1-person
56 married couples with children.
655 single-parent households (104 men, 551 women).
98.1% of residents of 39069 zip code speak English at home.
0.7% of residents speak Spanish at home (62% very well, 9% well, 28% not at all).
1.1% of residents speak other Indo-European language at home (43% well, 57% not well).
0.3% of residents speak other language at home (100% very well).
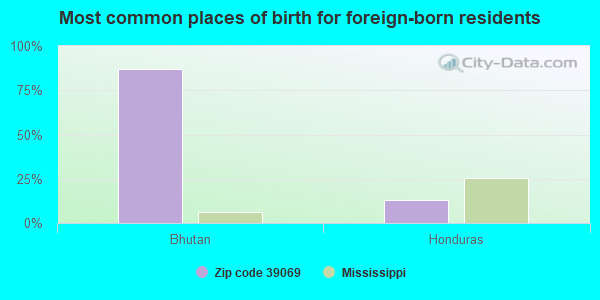
Foreign born population: 38 (0.8%) (18.8% of them are naturalized citizens)
This zip code:
0.8%
Whole state:
2.2%
87%Bhutan
13%Honduras
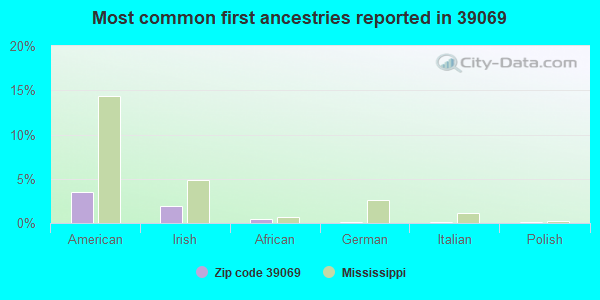
4%American
2%Irish
0%African
0%German
0%Italian
0%Polish
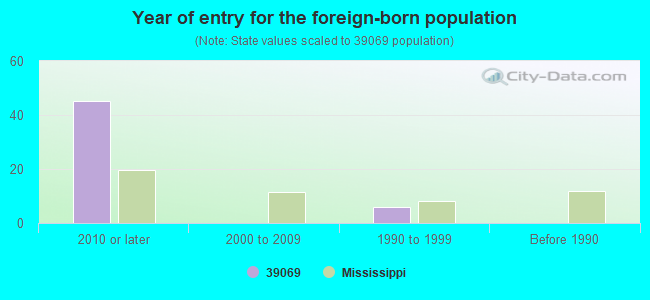
Year of entry for the foreign-born population
452010 or later
02000 to 2009
61990 to 1999
0Before 1990
Major facilities with environmental interests located in this zip code:
ITT SWF AUTO ELECTRIC (HIGHWAY 33 FAYETTE INDUSTRIAL PARK in FAYETTE, MS)
STATE MASTER (Mississippi compliance, permits, activity tracking ) - ENSITE-MSD052528296, CESQG (Resource Conservation and Recovery Act (tracking hazardous waste)) Organizations: CORPORATE SHAREHOLDERS (CONTACT/OWNER)
Alternative names: ITT AUTOMOTIVE ELECTRICAL DIVISION
FAYETTE POTW, NORTH LAGOON (OLD HIGHWAY 61 NORTH in FAYETTE, MS)
STATE MASTER (Mississippi compliance, permits, activity tracking ) - ENSITE-MS0027766, National Pollutant Discharge Elimination System Permit National Pollutant Discharge Elimination System NON-MAJOR (Tracking pollutant discharge elimination systems) - permit Business SIC classification: SEWERAGE SYSTEMS Alternative names: JEFFERSON COUNTY
FAYETTE POTW, NORTHEAST (HIGHWAY 28 EAST in FAYETTE, MS)
STATE MASTER (Mississippi compliance, permits, activity tracking ) - ENSITE-MS0025984, National Pollutant Discharge Elimination System Permit National Pollutant Discharge Elimination System NON-MAJOR (Tracking pollutant discharge elimination systems) - permit Business SIC classification: SEWERAGE SYSTEMS Alternative names: JEFFERSON COUNTY
FAYETTE POTW, SOUTHWEST (HIGHWAY 61 SOUTH in FAYETTE, MS)
STATE MASTER (Mississippi compliance, permits, activity tracking ) - ENSITE-MS0026239, National Pollutant Discharge Elimination System Permit National Pollutant Discharge Elimination System NON-MAJOR (Tracking pollutant discharge elimination systems) - permit Business SIC classification: SEWERAGE SYSTEMS Alternative names: JEFFERSON COUNTY
FAYETTE, CITY OF, SUNNYSIDE SUBDIVISION (HIGHWAY 61 NORTH in FAYETTE, MS)
STATE MASTER (Mississippi compliance, permits, activity tracking ) - ENSITE-MS0022501, National Pollutant Discharge Elimination System Permit National Pollutant Discharge Elimination System NON-MAJOR (Tracking pollutant discharge elimination systems) - permit Business SIC classification: LAND SUBDIVIDERS AND DEVELOPERS, EXCEPT CEMETERIES Alternative names: JEFFERSON COUNTY, SUNNYSIDE SUB DIVISION
FAYETTE VOC CENTER (205 INDUSTRIAL PARK DRIVE in FAYETTE, MS)
(National Center for Education Statistics) - STATE ID-3200090 Organizations: JEFFERSON CO SCHOOL DIST (SCHOOL DISTRICT)
JEFFERSON CO ELEM SCHOOL (430 HWY 33 in FAYETTE, MS)
(National Center for Education Statistics) - STATE ID-3200004 Organizations: JEFFERSON CO SCHOOL DIST (SCHOOL DISTRICT)
JEFFERSON CO HIGH (2277 MAIN STREET in FAYETTE, MS)
(National Center for Education Statistics) - STATE ID-3200008 Organizations: JEFFERSON CO SCHOOL DIST (SCHOOL DISTRICT)
JEFFERSON COUNTY ALTERNATIVE SCHOOL (468 HWY 33 in FAYETTE, MS)
(National Center for Education Statistics) - STATE ID-3200092 Organizations: JEFFERSON CO SCHOOL DIST (SCHOOL DISTRICT)
JEFFERSON COUNTY MIDDLE SCHOOL (468 HWY 33 in FAYETTE, MS)
(National Center for Education Statistics) - STATE ID-3200010 Organizations: JEFFERSON CO SCHOOL DIST (SCHOOL DISTRICT)
MPIC - STARTER MOTOR SERVICE SHOP (303 HIGHWAY 33 in FAYETTE, MS)
Large Quantity Generators, more that 1000 kg of hazardous waste/month (Resource Conservation and Recovery Act (tracking hazardous waste)) Organizations: MISSISSIPPI PRISON INDUSTRIES CORP. (CONTACT/OPERATOR)
, JEFFERSON COUNTY BOARD OF SUPERVISORS (CONTACT/OWNER)
JEFFERSON COUNTY SCHOOL DISTRICT (P. O. BOX 157 in FAYETTE, MS)
COMPLIANCE ACTIVITY (Tracking inspections of insecticide, fungicide, and rodenticide, and toxic substances)
JEFFERSON COUNTY SCHOOL DISTRICT (723 SOUTH MAIN ST. in FAYETETE, MS)
COMPLIANCE ACTIVITY (Tracking inspections of insecticide, fungicide, and rodenticide, and toxic substances)
Housing units lacking complete plumbing facilities: 4.7% Housing units lacking complete kitchen facilities: 0.8%
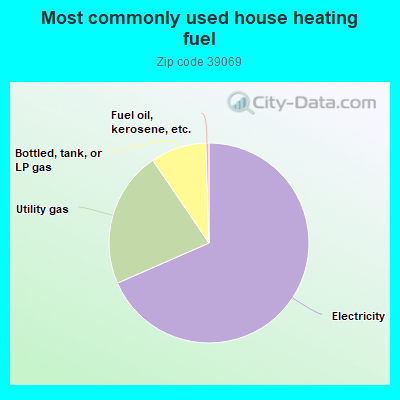
68.5%Electricity
22.1%Utility gas
9.0%Bottled, tank, or LP gas
0.5%Fuel oil, kerosene, etc.
Population in 1990: 6,319. Population change in the 1990s: +182 (+2.9%).
Place of birth for U.S.-born residents:
This state: 4,380
Northeast: 15
Midwest: 71
South: 252
West: 45
72% of the 39069 zip code residents lived in the same house 5 years ago. Out of people who lived in different houses, 62% lived in this county. Out of people who lived in different counties, 50% lived in Mississippi.
94% of the 39069 zip code residents lived in the same house 1 year ago. Out of people who lived in different houses, 2% moved from this county. Out of people who lived in different houses, 72% moved from different county within same state. Out of people who lived in different houses, 28% moved from different state.
Private vs. public school enrollment:
Students in private schools in grades 1 to 8 (elementary and middle school):
Here:
0.0%
Mississippi:
16.1%
Students in private schools in grades 9 to 12 (high school): 4
Here:
1.5%
Mississippi:
14.6%
Students in private undergraduate colleges: 5
Here:
2.0%
Mississippi:
12.8%
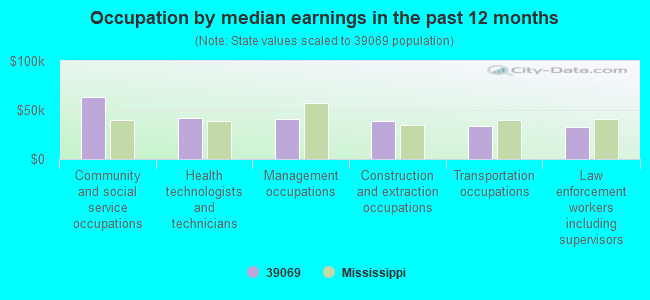
Occupation by median earnings in the past 12 months ($)
63,025Community and social service occupations
42,022Health technologists and technicians
41,167Management occupations
38,333Construction and extraction occupations
33,432Transportation occupations
32,184Law enforcement workers including supervisors
Top industries in this zip code by the number of employees in 2005:
Health Care and Social Assistance: General Medical and Surgical Hospitals (50-99 employees: 1 establishment)
Health Care and Social Assistance: Child Day Care Services (20-49: 1, 1-4: 2)
Health Care and Social Assistance: All Other Outpatient Care Centers (20-49: 1)
Finance and Insurance: Commercial Banking (10-19: 1, 5-9: 1)
Other Services (except Public Administration): Funeral Homes and Funeral Services (5-9: 1, 1-4: 1)
Health Care and Social Assistance: Home Health Care Services (5-9: 1)
People in group quarters in 2010:
336 people in state prisons
57 people in nursing facilities/skilled-nursing facilities
People in group quarters in 2000:
563 people in state prisons
55 people in nursing homes
18 people in local jails and other confinement facilities (including police lockups)
Fatal accident statistics in 2014:
Fatal accident count: 2
Vehicles involved in fatal accidents: 2
Fatal accidents caused by drunken drivers: 1
Fatalities: 2
Persons involved in fatal accidents: 13
Pedestrians involved in fatal accidents: 0
Fatal accident statistics in 2013:
Fatal accident count: 1
Vehicles involved in fatal accidents: 1
Fatal accidents caused by drunken drivers: 0
Fatalities: 1
Persons involved in fatal accidents: 6
Pedestrians involved in fatal accidents: 0
2003 - 2018 National Fire Incident Reporting System (NFIRS) incidents
Based on the data from the years 2003 - 2018 the average number of fire incidents per year is 19. The highest number of fires - 39 took place in 2018, and the least - 1 in 2012. The data has a growing trend.
When looking into fire subcategories, the most reports belonged to: Structure Fires (73.1%), and Mobile Property/Vehicle Fires (16.2%).
Fire incident types reported to NFIRS in Zip Code 39069


 Nearest zip codes: 39096, 39661, 39668, 39653, 39144, 39630.


 Based on the data from the years 2003 - 2018 the average number of fire incidents per year is 19. The highest number of fires - 39 took place in 2018, and the least - 1 in 2012. The data has a growing trend.
 When looking into fire subcategories, the most reports belonged to: Structure Fires (73.1%), and Mobile Property/Vehicle Fires (16.2%).