Estimated zip code population in 2022: 2,508 Zip code population in 2010: 2,656 Zip code population in 2000: 2,710
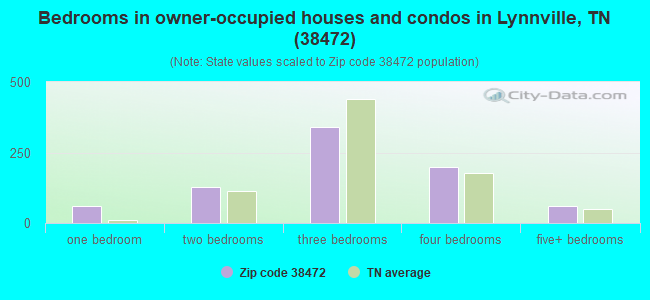
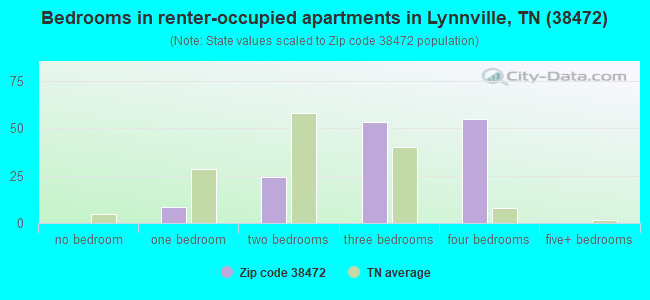
Houses and condos: 1,182 Renter-occupied apartments: 139
% of renters here:
15%
State:
33%
March 2022 cost of living index in zip code 38472: 79.1 (low, U.S. average is 100)
Land area: 99.4 sq. mi. Water area: 0.0 sq. mi.
Population density: 25 people per square mile
(very low).
OSM Map
General Map
Google Map
MSN Map
OSM Map
General Map
Google Map
MSN Map
OSM Map
General Map
Google Map
MSN Map
OSM Map
General Map
Google Map
MSN Map
Please wait while loading the map...
Real estate property taxes paid for housing units in 2022:
This zip code:
0.5% ($1,233)
Tennessee:
0.5% ($1,376)
Median real estate property taxes paid for housing units with mortgages in 2022: $1,347 (0.5%) Median real estate property taxes paid for housing units with no mortgage in 2022: $1,126 (0.6%)
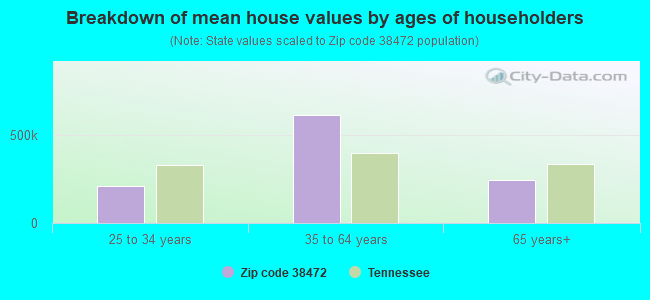
Estimated median house/condo value in 2022: $242,835
38472:
$242,835
Tennessee:
$284,800
According to our research of Tennessee and other state lists, there were 4 registered sex offenders living in 38472 zip code as of May 24, 2024. The ratio of all residents to sex offenders in zip code 38472 is 669 to 1. The ratio of registered sex offenders to all residents in this zip code is lower than the state average.
Median resident age:
This zip code:
47.9 years
Tennessee median age:
39.2 years
Average household size:
This zip code:
2.7 people
Tennessee:
2.4 people
Averages for the 2020 tax year for zip code 38472, filed in 2021:
Average Adjusted Gross Income (AGI) in 2020: $60,715 (Individual Income Tax Returns)
Here:
$60,715
State:
$69,014
Salary/wage: $50,432 (reported on 79.2% of returns)
Here:
$50,432
State:
$55,872
(% of AGI for various income ranges: 995.5% for AGIs below $25k, 3547.8% for AGIs $25k-50k, 6390.0% for AGIs $50k-75k, 8359.0% for AGIs $75k-100k, 13102.0% for AGIs $100k-200k)
Taxable interest for individuals: $1,984 (reported on 30.4% of returns)
This zip code:
$1,984
Tennessee:
$1,945
(% of AGI for various income ranges: 33.8% for AGIs below $25k, 32.6% for AGIs $25k-50k, 25.3% for AGIs $50k-75k, 32.0% for AGIs $75k-100k, 64.0% for AGIs $100k-200k)
Ordinary dividends: $7,559 (reported on 13.6% of returns)
Here:
$7,559
State:
$8,105
(% of AGI for various income ranges: 15.2% for AGIs below $25k, 46.3% for AGIs $25k-50k, 23.3% for AGIs $50k-75k, 126.0% for AGIs $75k-100k, 76.0% for AGIs $100k-200k)
Net capital gain/loss in AGI: +$34,720 (reported on 16.0% of returns)
Here:
+$34,720
State:
+$33,664
(% of AGI for various income ranges: 0.3% for AGIs below $25k, 65.9% for AGIs $25k-50k, 92.0% for AGIs $50k-75k, 271.0% for AGIs $75k-100k, 923.0% for AGIs $100k-200k)
Profit/loss from business: +$19,065 (reported on 20.8% of returns)
Here:
+$19,065
State:
+$18,991
(% of AGI for various income ranges: 276.2% for AGIs below $25k, 292.2% for AGIs $25k-50k, 353.3% for AGIs $50k-75k, 345.0% for AGIs $75k-100k, 2492.0% for AGIs $100k-200k)
Taxable individual retirement arrangement distribution: $16,755 (reported on 8.8% of returns)
38472:
$16,755
Tennessee:
$20,036
(% of AGI for various income ranges: 79.0% for AGIs below $25k, 210.4% for AGIs $25k-50k, 1046.0% for AGIs $75k-100k)
Total itemized deductions: $32,900 (reported on 2.4% of returns)
Here:
$32,900
State:
$40,136
(% of AGI for various income ranges: 987.0% for AGIs $75k-100k)
Charity contributions: $19,650 (reported on 1.6% of returns)
Here:
$19,650
State:
$19,852
(% of AGI for various income ranges: 145.6% for AGIs $25k-50k)
Taxes paid: $4,300 (reported on 2.4% of returns)
38472:
$4,300
State:
$6,038
(% of AGI for various income ranges: 129.0% for AGIs $75k-100k)
Earned income credit: $2,238 (reported on 16.8% of returns)
Here:
$2,238
State:
$2,391
(% of AGI for various income ranges: 87.2% for AGIs below $25k, 80.4% for AGIs $25k-50k)
Percentage of individuals using paid preparers for their 2020 taxes: 96.0%
Here:
96%
State:
93%
(% for various income ranges: 92.5% for AGIs below $25k, 97.1% for AGIs $25k-50k, 100.0% for AGIs $50k-75k, 92.3% for AGIs $75k-100k, 100.0% for AGIs $100k-200k, 100.0% for AGIs over 200k)
Averages for the 2012 tax year for zip code 38472, filed in 2013:
Average Adjusted Gross Income (AGI) in 2012: $48,733 (Individual Income Tax Returns)
Here:
$48,733
State:
$53,767
Salary/wage: $38,993 (reported on 84.7% of returns)
Here:
$38,993
State:
$45,421
(% of AGI for various income ranges: 74.7% for AGIs below $25k, 79.4% for AGIs $25k-50k, 77.0% for AGIs $50k-75k, 78.5% for AGIs $75k-100k, 46.0% for AGIs $100k-200k)
Taxable interest for individuals: $921 (reported on 29.7% of returns)
This zip code:
$921
Tennessee:
$1,732
(% of AGI for various income ranges: 1.3% for AGIs below $25k, 0.7% for AGIs $25k-50k, 0.3% for AGIs $50k-75k, 0.6% for AGIs $75k-100k, 0.4% for AGIs $100k-200k)
Ordinary dividends: $2,833 (reported on 10.8% of returns)
Here:
$2,833
State:
$6,739
(% of AGI for various income ranges: 0.4% for AGIs below $25k, 2.0% for AGIs $25k-50k, 0.3% for AGIs $50k-75k, 0.3% for AGIs $75k-100k, 0.2% for AGIs $100k-200k)
Net capital gain/loss in AGI: +$1,862 (reported on 14.4% of returns)
Here:
+$1,862
State:
+$19,082
(% of AGI for various income ranges: 0.1% for AGIs below $25k, 0.2% for AGIs $25k-50k, 1.5% for AGIs $50k-75k, 1.2% for AGIs $75k-100k)
Profit/loss from business: +$10,160 (reported on 18.0% of returns)
Here:
+$10,160
State:
+$15,240
(% of AGI for various income ranges: 13.5% for AGIs below $25k, 3.8% for AGIs $25k-50k, 3.5% for AGIs $50k-75k, 4.8% for AGIs $75k-100k)
Taxable individual retirement arrangement distribution: $11,500 (reported on 9.0% of returns)
38472:
$11,500
Tennessee:
$15,505
(% of AGI for various income ranges: 2.2% for AGIs below $25k, 3.1% for AGIs $25k-50k, 6.9% for AGIs $75k-100k)
Total itemized deductions: $19,365 (17% of AGI, reported on 15.3% of returns)
Here:
$19,365
State:
$21,976
Here:
17.1% of AGI
State:
17.8% of AGI
(% of AGI for various income ranges: 7.0% for AGIs $25k-50k, 7.1% for AGIs $50k-75k, 6.5% for AGIs $75k-100k, 6.7% for AGIs $100k-200k)
Charity contributions: $4,838 (reported on 11.7% of returns)
Here:
$4,838
State:
$6,709
(% of AGI for various income ranges: 1.1% for AGIs $25k-50k, 0.8% for AGIs $50k-75k, 0.8% for AGIs $75k-100k, 2.0% for AGIs $100k-200k)
Taxes paid: $3,625 (reported on 14.4% of returns)
38472:
$3,625
State:
$4,829
(% of AGI for various income ranges: 1.0% for AGIs $25k-50k, 1.0% for AGIs $50k-75k, 1.3% for AGIs $75k-100k, 1.4% for AGIs $100k-200k)
Earned income credit: $2,050 (reported on 21.6% of returns)
Here:
$2,050
State:
$2,404
(% of AGI for various income ranges: 6.0% for AGIs below $25k, 1.3% for AGIs $25k-50k)
Percentage of individuals using paid preparers for their 2012 taxes: 64.9%
Here:
65%
State:
52%
(% for various income ranges: 56.8% for AGIs below $25k, 62.5% for AGIs $25k-50k, 75.0% for AGIs $50k-75k, 81.8% for AGIs $75k-100k, 75.0% for AGIs $100k-200k)
Averages for the 2004 tax year for zip code 38472, filed in 2005:
Average Adjusted Gross Income (AGI) in 2004: $35,959 (Individual Income Tax Returns)
Here:
$35,959
State:
$44,088
Salary/wage: $34,451 (reported on 85.4% of returns)
Here:
$34,451
State:
$38,825
(% of AGI for various income ranges: 127.5% for AGIs below $10k, 79.0% for AGIs $10k-25k, 87.2% for AGIs $25k-50k, 86.5% for AGIs $50k-75k, 88.6% for AGIs $75k-100k, 60.6% for AGIs over 100k)
Taxable interest for individuals: $1,280 (reported on 35.7% of returns)
This zip code:
$1,280
Tennessee:
$1,802
(% of AGI for various income ranges: 5.9% for AGIs below $10k, 2.3% for AGIs $10k-25k, 0.9% for AGIs $25k-50k, 1.3% for AGIs $50k-75k, 0.4% for AGIs $75k-100k, 1.2% for AGIs over 100k)
Taxable dividends: $1,262 (reported on 14.0% of returns)
Here:
$1,262
State:
$3,727
(% of AGI for various income ranges: 4.0% for AGIs below $10k, 0.2% for AGIs $10k-25k, 0.4% for AGIs $25k-50k, 0.3% for AGIs $50k-75k, 0.3% for AGIs $75k-100k, 0.9% for AGIs over 100k)
Net capital gain/loss: +$8,407 (reported on 13.2% of returns)
Here:
+$8,407
State:
+$15,776
(% of AGI for various income ranges: 1.8% for AGIs below $10k, 0.6% for AGIs $10k-25k, 1.7% for AGIs $25k-50k, 2.8% for AGIs $50k-75k, 0.4% for AGIs $75k-100k, 9.1% for AGIs over 100k)
Profit/loss from business: +$5,403 (reported on 16.7% of returns)
Here:
+$5,403
State:
+$12,882
(% of AGI for various income ranges: -20.0% for AGIs below $10k, 6.4% for AGIs $10k-25k, 4.1% for AGIs $25k-50k, 1.8% for AGIs $50k-75k, 1.3% for AGIs $75k-100k, 2.0% for AGIs over 100k)
IRA payment deduction: $2,950 (reported on 1.6% of returns)
38472:
$2,950
Tennessee:
$2,934
Total itemized deductions: $15,971 (23% of AGI, reported on 17.1% of returns)
Here:
$15,971
State:
$18,035
Here:
22.8% of AGI
State:
19.9% of AGI
(% of AGI for various income ranges: 6.9% for AGIs $10k-25k, 6.4% for AGIs $25k-50k, 7.4% for AGIs $50k-75k, 10.2% for AGIs $75k-100k, 8.5% for AGIs over 100k)
Charity contributions deductions: $3,848 (5% of AGI, reported on 13.4% of returns)
Here:
$3,848
State:
$5,167
Here:
4.9% of AGI
State:
5.3% of AGI
(% of AGI for various income ranges: 0.4% for AGIs $10k-25k, 0.8% for AGIs $25k-50k, 1.1% for AGIs $50k-75k, 2.5% for AGIs $75k-100k, 2.7% for AGIs over 100k)
Total tax: $4,638 (reported on 74.3% of returns)
38472:
$4,638
State:
$7,482
(% of AGI for various income ranges: 5.1% for AGIs below $10k, 4.2% for AGIs $10k-25k, 6.6% for AGIs $25k-50k, 8.4% for AGIs $50k-75k, 11.3% for AGIs $75k-100k, 17.9% for AGIs over 100k)
Earned income credit: $1,749 (reported on 17.8% of returns)
Here:
$1,749
State:
$1,826
Percentage of individuals using paid preparers for their 2004 taxes: 68.6%
Here:
69%
State:
60%
(% for various income ranges: 54.5% for AGIs below $10k, 71.0% for AGIs $10k-25k, 68.7% for AGIs $25k-50k, 79.6% for AGIs $50k-75k, 74.4% for AGIs $75k-100k, 76.0% for AGIs over 100k)
Likely homosexual households (counted as self-reported same-sex unmarried-partner households)
Lesbian couples: 0.0% of all households
Gay men: 1.4% of all households
Household received Food Stamps/SNAP in the past 12 months: 52 Household did not receive Food Stamps/SNAP in the past 12 months: 880
Women who had a birth in the past 12 months: 7 (8 now married, 0 unmarried) Women who did not have a birth in the past 12 months: 453 (178 now married, 275 unmarried)
Housing units in zip code 38472 with a mortgage: 319 (13 second mortgage, 14 home equity loan, 2 both second mortgage and home equity loan) Median monthly owner costs for units with a mortgage: $1,206 Median monthly owner costs for units without a mortgage: $417
Residents with income below the poverty level in 2022:
This zip code:
6.5%
Whole state:
13.3%
Residents with income below 50% of the poverty level in 2022:
This zip code:
2.9%
Whole state:
7.1%
Median number of rooms in houses and condos:
Here:
6.5
State:
6.5
Median number of rooms in apartments:
Here:
6.3
State:
4.4
Notable locations in this zip code not listed on our city pages
Notable locations in zip code 38472: Round Hill (A), Dodson Siding (B), Robertson Fork (C), Giles County Fire and Rescue Squad Lynnville (D), Giles County Fire and Rescue Squad Richland (E). Display/hide their locations on the map
Churches in zip code 38472 include: Round Hill Missionary Baptist Church (A), Fry Branch Church (B), Robertson Fork Church (C), Saint John Church (D), Taylor Chapel (E), Round Hill African Methodist Episcopal Church (F), Big Creek Church (G), Briar Ridge Church (H), New Hope Church (I). Display/hide their locations on the map
Cemeteries: Joines Cemetery (1), Waco Cemetery (2), Kincaid Cemetery (3), Lane Cemetery (4), Wilsford Cemetery (5), Gooch Cemetery (6), Yokley Cemetery (7). Display/hide their locations on the map
Streams, rivers, and creeks: Mack Branch (A), Lynn Creek (B), Ball Branch (C), Yokley Creek (D), Gimlet Branch (E), Fry Branch (F), Chapel Branch (G), Brownlow Creek (H), Blue Branch (I). Display/hide their locations on the map
Size of family households: 341 2-persons, 89 3-persons, 96 4-persons, 35 5-persons, 3 6-persons, 56 7-or-more-persons
Size of nonfamily households: 270 1-person, 37 2-persons
482 married couples with children.
87 single-parent households (22 men, 65 women).
98.4% of residents of 38472 zip code speak English at home.
0.6% of residents speak Spanish at home (100% very well).
0.9% of residents speak other Indo-European language at home (95% very well, 5% well).
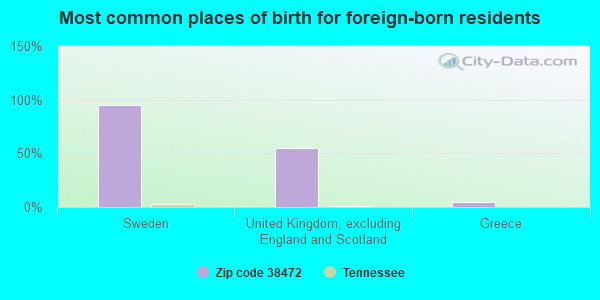
Foreign born population: 22 (0.9%) (100.0% of them are naturalized citizens)
This zip code:
0.9%
Whole state:
5.6%
95%Sweden
55%United Kingdom, excluding England and Scotland
5%Greece
39%American
20%English
7%Scottish
7%Irish
4%German
2%Italian
2%European
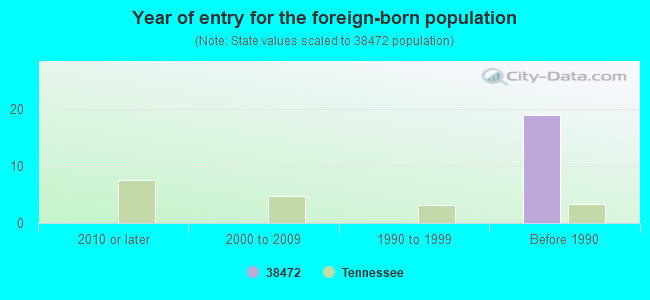
Year of entry for the foreign-born population
02010 or later
02000 to 2009
01990 to 1999
19Before 1990
Housing units lacking complete plumbing facilities: 7.5% Housing units lacking complete kitchen facilities: 15.8%
58.0%Electricity
23.1%Utility gas
13.2%Bottled, tank, or LP gas
5.9%Wood
Population in 1990: 2,712.
Place of birth for U.S.-born residents:
This state: 1,418
Northeast: 140
Midwest: 306
South: 470
West: 151
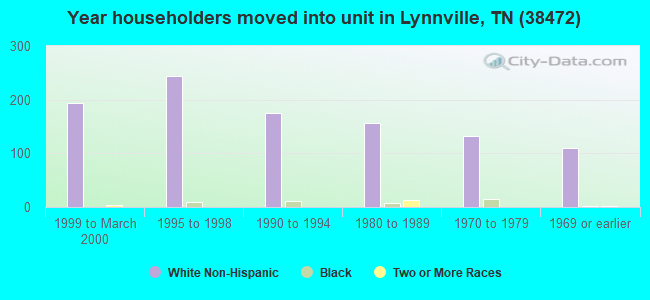
65% of the 38472 zip code residents lived in the same house 5 years ago. Out of people who lived in different houses, 38% lived in this county. Out of people who lived in different counties, 50% lived in Tennessee.
95% of the 38472 zip code residents lived in the same house 1 year ago. Out of people who lived in different houses, 30% moved from this county. Out of people who lived in different houses, 59% moved from different county within same state. Out of people who lived in different houses, 19% moved from different state.
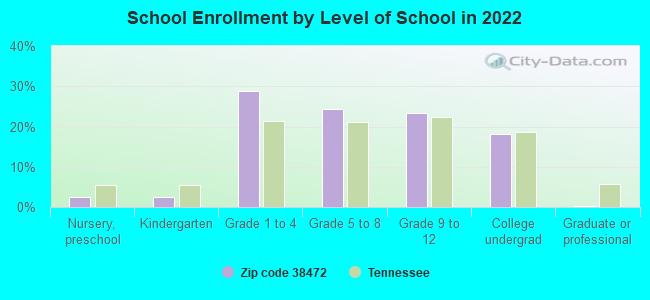
Private vs. public school enrollment:
Students in private schools in grades 1 to 8 (elementary and middle school): 61
Here:
19.8%
Tennessee:
15.0%
Students in private schools in grades 9 to 12 (high school): 29
Here:
21.9%
Tennessee:
16.2%
Students in private undergraduate colleges: 29
Here:
28.8%
Tennessee:
23.5%
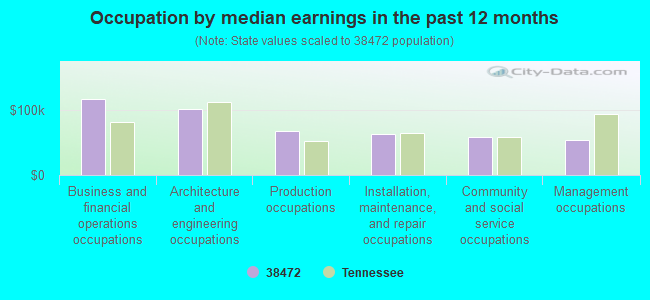
Occupation by median earnings in the past 12 months ($)
117,332Business and financial operations occupations
102,137Architecture and engineering occupations
67,242Production occupations
63,973Installation, maintenance, and repair occupations
58,880Community and social service occupations
54,569Management occupations
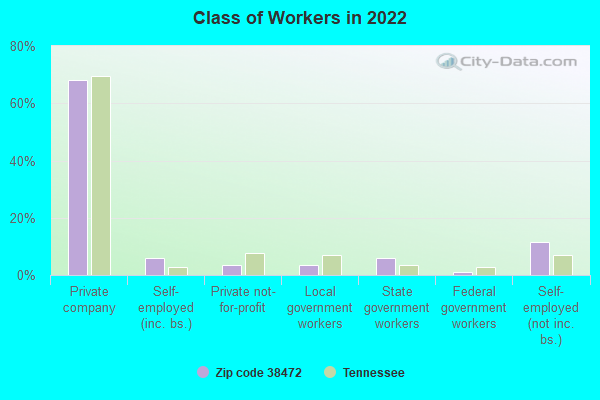
Top industries in this zip code by the number of employees in 2005:
Administrative and Support and Waste Management and Remediation Services: Landscaping Services (1-4 employees: 3 establishments)
Other Services (except Public Administration): Religious Organizations (1-4: 3)
Fatal accident statistics in 2014:
Fatal accident count: 1
Vehicles involved in fatal accidents: 1
Fatal accidents caused by drunken drivers: 1
Fatalities: 1
Persons involved in fatal accidents: 1
Pedestrians involved in fatal accidents: 0
Fatal accident statistics in 2013:
Fatal accident count: 2
Vehicles involved in fatal accidents: 3
Fatal accidents caused by drunken drivers: 0
Fatalities: 2
Persons involved in fatal accidents: 4
Pedestrians involved in fatal accidents: 0
Most common first names in zip code 38472 among deceased individuals
Name
Count
Lived (average)
James
48
72.8 years
William
35
75.1 years
Robert
28
71.7 years
John
25
72.8 years
Mary
22
79.4 years
Willie
12
76.4 years
George
11
77.1 years
Charlie
8
72.5 years
Annie
8
77.0 years
Raymond
7
78.4 years
Most common last names in zip code 38472 among deceased individuals
Last name
Count
Lived (average)
Hickman
19
79.1 years
Braden
15
81.1 years
Sands
15
77.7 years
Smith
12
84.2 years
Bonds
10
78.4 years
Hobbs
9
79.9 years
Brown
9
78.1 years
White
9
75.8 years
Thurman
9
83.3 years
Moore
8
83.7 years
Discuss Lynnville, Tennessee (TN) on our hugely popular Tennessee forum.


 Nearest zip codes: 38451, 38478, 37047, 38456, 38474, 38401.