Estimated zip code population in 2022: 3,098 Zip code population in 2010: 3,308 Zip code population in 2000: 3,258
Houses and condos: 1,933 Renter-occupied apartments: 332
% of renters here:
24%
State:
33%
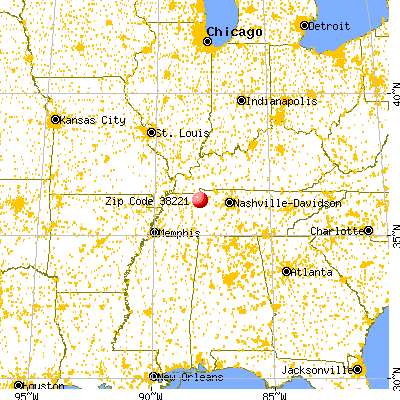
March 2022 cost of living index in zip code 38221: 77.9 (low, U.S. average is 100)
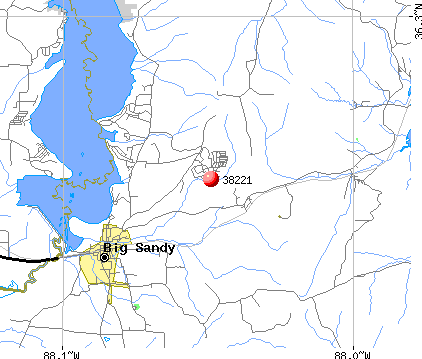
Land area: 108.4 sq. mi. Water area: 17.3 sq. mi.
Population density: 29 people per square mile
(very low).
OSM Map
General Map
Google Map
MSN Map
OSM Map
General Map
Google Map
MSN Map
OSM Map
General Map
Google Map
MSN Map
OSM Map
General Map
Google Map
MSN Map
Please wait while loading the map...
Real estate property taxes paid for housing units in 2022:
This zip code:
0.5% ($668)
Tennessee:
0.5% ($1,376)
Median real estate property taxes paid for housing units with mortgages in 2022: $688 (0.5%) Median real estate property taxes paid for housing units with no mortgage in 2022: $648 (0.5%)
Business Search- 14 Million verified businesses
Males: 1,448
(46.8%)
Females: 1,649
(53.2%)
For population 25 years and over in 38221:
High school or higher: 88.7%
Bachelor's degree or higher: 9.5%
Graduate or professional degree: 4.8%
Unemployed: 9.5%
Mean travel time to work (commute): 32.5 minutes
For population 15 years and over in 38221:
Never married: 23.9%
Now married: 46.2%
Separated: 4.3%
Widowed: 10.6%
Divorced: 15.0%
Zip code 38221 compared to state average:
Median house value below state average.
Unemployed percentage above state average.
Black race population percentage significantly below state average.
Hispanic race population percentage below state average.
Median age significantly above state average.
Foreign-born population percentage significantly below state average.
Length of stay since moving in significantly above state average.
Number of college students below state average.
Percentage of population with a bachelor's degree or higher significantly below state average.
Averages for the 2020 tax year for zip code 38221, filed in 2021:
Average Adjusted Gross Income (AGI) in 2020: $47,499 (Individual Income Tax Returns)
Here:
$47,499
State:
$69,014
Salary/wage: $42,184 (reported on 71.9% of returns)
Here:
$42,184
State:
$55,872
(% of AGI for various income ranges: 1005.6% for AGIs below $25k, 3033.5% for AGIs $25k-50k, 5437.3% for AGIs $50k-75k, 7887.5% for AGIs $75k-100k, 12037.5% for AGIs $100k-200k)
Taxable interest for individuals: $1,064 (reported on 31.1% of returns)
This zip code:
$1,064
Tennessee:
$1,945
(% of AGI for various income ranges: 10.0% for AGIs below $25k, 44.6% for AGIs $25k-50k, 86.7% for AGIs $50k-75k, 32.5% for AGIs $75k-100k, 167.5% for AGIs $100k-200k)
Ordinary dividends: $2,131 (reported on 11.9% of returns)
Here:
$2,131
State:
$8,105
(% of AGI for various income ranges: 16.1% for AGIs below $25k, 20.0% for AGIs $25k-50k, 67.3% for AGIs $50k-75k, 152.5% for AGIs $100k-200k)
Net capital gain/loss in AGI: +$9,233 (reported on 11.1% of returns)
Here:
+$9,233
State:
+$33,664
(% of AGI for various income ranges: 10.2% for AGIs below $25k, 35.4% for AGIs $25k-50k, 122.0% for AGIs $50k-75k, 237.5% for AGIs $75k-100k, 1097.5% for AGIs $100k-200k)
Profit/loss from business: +$9,491 (reported on 17.0% of returns)
Here:
+$9,491
State:
+$18,991
(% of AGI for various income ranges: 103.2% for AGIs below $25k, 146.9% for AGIs $25k-50k, 180.0% for AGIs $50k-75k, 1385.0% for AGIs $100k-200k)
Taxable individual retirement arrangement distribution: $18,817 (reported on 8.9% of returns)
38221:
$18,817
Tennessee:
$20,036
(% of AGI for various income ranges: 47.6% for AGIs below $25k, 126.5% for AGIs $25k-50k, 530.7% for AGIs $50k-75k, 1172.5% for AGIs $100k-200k)
Earned income credit: $2,168 (reported on 20.7% of returns)
Here:
$2,168
State:
$2,391
(% of AGI for various income ranges: 95.1% for AGIs below $25k, 83.5% for AGIs $25k-50k)
Percentage of individuals using paid preparers for their 2020 taxes: 93.3%
Here:
93%
State:
93%
(% for various income ranges: 94.5% for AGIs below $25k, 94.1% for AGIs $25k-50k, 95.0% for AGIs $50k-75k, 90.9% for AGIs $75k-100k, 91.7% for AGIs $100k-200k, 66.7% for AGIs over 200k)
Averages for the 2012 tax year for zip code 38221, filed in 2013:
Average Adjusted Gross Income (AGI) in 2012: $36,132 (Individual Income Tax Returns)
Here:
$36,132
State:
$53,767
Salary/wage: $33,269 (reported on 75.0% of returns)
Here:
$33,269
State:
$45,421
(% of AGI for various income ranges: 66.4% for AGIs below $25k, 70.7% for AGIs $25k-50k, 71.5% for AGIs $50k-75k, 70.0% for AGIs $75k-100k, 66.8% for AGIs $100k-200k)
Taxable interest for individuals: $1,195 (reported on 29.8% of returns)
This zip code:
$1,195
Tennessee:
$1,732
(% of AGI for various income ranges: 1.7% for AGIs below $25k, 0.9% for AGIs $25k-50k, 1.2% for AGIs $50k-75k, 0.9% for AGIs $75k-100k, 0.4% for AGIs $100k-200k)
Ordinary dividends: $1,477 (reported on 10.5% of returns)
Here:
$1,477
State:
$6,739
(% of AGI for various income ranges: 1.1% for AGIs below $25k, 0.4% for AGIs $25k-50k, 0.2% for AGIs $50k-75k, 0.7% for AGIs $75k-100k)
Net capital gain/loss in AGI: +$2,070 (reported on 8.1% of returns)
Here:
+$2,070
State:
+$19,082
(% of AGI for various income ranges: 0.2% for AGIs $25k-50k, 0.3% for AGIs $50k-75k, 2.6% for AGIs $75k-100k)
Profit/loss from business: +$8,627 (reported on 17.7% of returns)
Here:
+$8,627
State:
+$15,240
(% of AGI for various income ranges: 9.5% for AGIs below $25k, 4.6% for AGIs $25k-50k, 1.4% for AGIs $50k-75k, 8.1% for AGIs $75k-100k)
Taxable individual retirement arrangement distribution: $11,900 (reported on 8.9% of returns)
38221:
$11,900
Tennessee:
$15,505
(% of AGI for various income ranges: 2.6% for AGIs below $25k, 1.6% for AGIs $25k-50k, 2.7% for AGIs $50k-75k, 11.3% for AGIs $75k-100k)
Total itemized deductions: $19,281 (28% of AGI, reported on 12.9% of returns)
Here:
$19,281
State:
$21,976
Here:
27.9% of AGI
State:
17.8% of AGI
(% of AGI for various income ranges: 6.4% for AGIs below $25k, 5.1% for AGIs $25k-50k, 8.4% for AGIs $50k-75k, 8.0% for AGIs $75k-100k, 7.1% for AGIs $100k-200k)
Charity contributions: $3,291 (reported on 8.9% of returns)
Here:
$3,291
State:
$6,709
(% of AGI for various income ranges: 1.0% for AGIs below $25k, 1.3% for AGIs $50k-75k, 1.5% for AGIs $100k-200k)
Taxes paid: $3,112 (reported on 12.9% of returns)
38221:
$3,112
State:
$4,829
(% of AGI for various income ranges: 0.6% for AGIs below $25k, 0.6% for AGIs $25k-50k, 1.3% for AGIs $50k-75k, 1.3% for AGIs $75k-100k, 1.8% for AGIs $100k-200k)
Earned income credit: $2,324 (reported on 26.6% of returns)
Here:
$2,324
State:
$2,404
(% of AGI for various income ranges: 7.8% for AGIs below $25k, 1.1% for AGIs $25k-50k)
Percentage of individuals using paid preparers for their 2012 taxes: 62.1%
Here:
62%
State:
52%
(% for various income ranges: 60.9% for AGIs below $25k, 60.0% for AGIs $25k-50k, 60.0% for AGIs $50k-75k, 71.4% for AGIs $75k-100k, 75.0% for AGIs $100k-200k)
Averages for the 2004 tax year for zip code 38221, filed in 2005:
Average Adjusted Gross Income (AGI) in 2004: $26,778 (Individual Income Tax Returns)
Here:
$26,778
State:
$44,088
Salary/wage: $26,219 (reported on 78.0% of returns)
Here:
$26,219
State:
$38,825
(% of AGI for various income ranges: 123.7% for AGIs below $10k, 70.2% for AGIs $10k-25k, 75.9% for AGIs $25k-50k, 83.6% for AGIs $50k-75k, 76.8% for AGIs $75k-100k, 53.7% for AGIs over 100k)
Taxable interest for individuals: $1,287 (reported on 35.8% of returns)
This zip code:
$1,287
Tennessee:
$1,802
(% of AGI for various income ranges: 8.1% for AGIs below $10k, 2.3% for AGIs $10k-25k, 1.4% for AGIs $25k-50k, 2.0% for AGIs $50k-75k, 0.7% for AGIs $75k-100k, 0.3% for AGIs over 100k)
Taxable dividends: $651 (reported on 11.4% of returns)
Here:
$651
State:
$3,727
(% of AGI for various income ranges: 1.9% for AGIs below $10k, 0.3% for AGIs $10k-25k, 0.3% for AGIs $25k-50k, 0.1% for AGIs $50k-75k, 0.1% for AGIs $75k-100k)
Net capital gain/loss: +$1,071 (reported on 8.7% of returns)
Here:
+$1,071
State:
+$15,776
(% of AGI for various income ranges: 2.3% for AGIs below $10k, 0.1% for AGIs $10k-25k, 0.0% for AGIs $25k-50k, 1.1% for AGIs $50k-75k, 0.1% for AGIs $75k-100k)
Profit/loss from business: +$5,126 (reported on 21.3% of returns)
Here:
+$5,126
State:
+$12,882
(% of AGI for various income ranges: 29.8% for AGIs below $10k, 8.5% for AGIs $10k-25k, 2.9% for AGIs $25k-50k, 1.8% for AGIs $50k-75k, 0.7% for AGIs $75k-100k)
IRA payment deduction: $2,417 (reported on 2.8% of returns)
38221:
$2,417
Tennessee:
$2,934
Total itemized deductions: $15,065 (31% of AGI, reported on 13.0% of returns)
Here:
$15,065
State:
$18,035
Here:
30.7% of AGI
State:
19.9% of AGI
(% of AGI for various income ranges: 5.2% for AGIs $10k-25k, 9.2% for AGIs $25k-50k, 7.8% for AGIs $50k-75k, 11.2% for AGIs $75k-100k)
Charity contributions deductions: $2,040 (4% of AGI, reported on 9.5% of returns)
Here:
$2,040
State:
$5,167
Here:
4.1% of AGI
State:
5.3% of AGI
(% of AGI for various income ranges: 0.5% for AGIs $10k-25k, 0.6% for AGIs $25k-50k, 0.9% for AGIs $50k-75k, 2.0% for AGIs $75k-100k)
Total tax: $3,032 (reported on 67.5% of returns)
38221:
$3,032
State:
$7,482
(% of AGI for various income ranges: 5.9% for AGIs below $10k, 3.7% for AGIs $10k-25k, 6.0% for AGIs $25k-50k, 8.5% for AGIs $50k-75k, 12.0% for AGIs $75k-100k, 17.7% for AGIs over 100k)
Earned income credit: $1,728 (reported on 26.8% of returns)
Here:
$1,728
State:
$1,826
Percentage of individuals using paid preparers for their 2004 taxes: 65.8%
Here:
66%
State:
60%
(% for various income ranges: 62.6% for AGIs below $10k, 67.2% for AGIs $10k-25k, 66.8% for AGIs $25k-50k, 69.2% for AGIs $50k-75k, 57.8% for AGIs $75k-100k, 73.7% for AGIs over 100k)
Household received Food Stamps/SNAP in the past 12 months: 132 Household did not receive Food Stamps/SNAP in the past 12 months: 1,246
Women who had a birth in the past 12 months: 9 (0 now married, 9 unmarried) Women who did not have a birth in the past 12 months: 556 (220 now married, 335 unmarried)
Housing units in zip code 38221 with a mortgage: 409 Median monthly owner costs for units with a mortgage: $956 Median monthly owner costs for units without a mortgage: $392
Residents with income below the poverty level in 2022:
This zip code:
17.4%
Whole state:
13.3%
Residents with income below 50% of the poverty level in 2022:
This zip code:
12.1%
Whole state:
7.1%
Median number of rooms in houses and condos:
Here:
5.5
State:
6.5
Median number of rooms in apartments:
Here:
5.0
State:
4.4
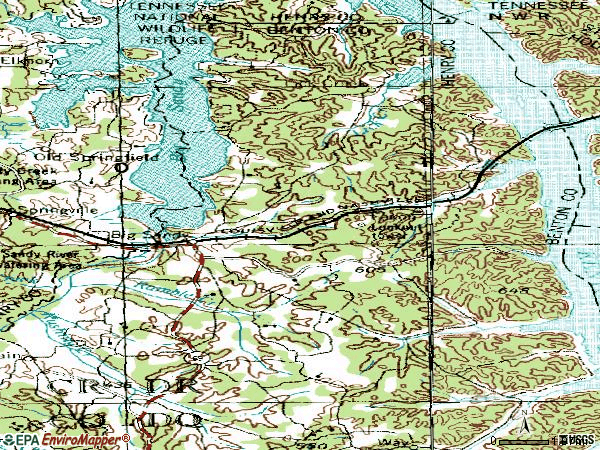
Notable locations in this zip code not listed on our city pages
Notable locations in zip code 38221: Whites Resort (A), Whites Camp Dock (B), Sulphur Creek Dock (C), Snows Camp Dock (D), Sandys Camp Dock (E), Sandys Camp (F), Randys Camp Dock (G), Randys Camp (H), Grannys Branch Dock (I), Big Sandy Dock Number Two (J), Big Sandy Dock (K), Bass Bay Resort Dock (L), Bass Bay Resort (M), Lick Creek Landing (N), Little Crooked Creek Landing (O), New Hope Landing (P), Big Sandy Volunteer Fire Department (Q). Display/hide their locations on the map
Churches in zip code 38221 include: Mount Carmel Church (A), Ramble Creek Baptist Church (B), Baker Chapel (C), Pleasant Ridge Church (D), Hill Chapel (E), Oak Hill Church (F), New Hope Church (G), Mount Zion Baptist Church (H), Mount Vincent Church (I). Display/hide their locations on the map
Cemeteries: Irish Cemetery (1), Wheatley Cemetery (2), Willow Cemetery (3), Wilson Cemetery (4), Wynn Cemetery (5), Leegan Cemetery (6), Liberty Cemetery (7). Display/hide their locations on the map
Streams, rivers, and creeks: Lockhart Branch (A), Jones Creek (B), Jones Branch (C), Hurricane Branch (D), Hope Creek (E), Hollingsworth Branch (F), Greenbrier Branch (G), Granny Branch (H), Gin Creek (I). Display/hide their locations on the map
Size of family households: 454 2-persons, 243 3-persons, 115 4-persons, 41 5-persons, 11 6-persons
Size of nonfamily households: 456 1-person, 51 2-persons
269 married couples with children.
155 single-parent households (28 men, 127 women).
99.4% of residents of 38221 zip code speak English at home.
0.1% of residents speak Spanish at home (100% very well).
0.7% of residents speak other Indo-European language at home (100% very well).
Foreign born population: 48 (1.6%) (100.0% of them are naturalized citizens)
This zip code:
1.6%
Whole state:
5.6%
86%Honduras
49%American
11%English
9%Irish
8%German
2%Scottish
2%Scotch-Irish
1%French
Year of entry for the foreign-born population
02010 or later
472000 to 2009
51990 to 1999
6Before 1990
Facilities with environmental interests located in this zip code:
AT&T-CLEVELAND (OFF HIGHWAY 11 in BIG SANDY, TN)
(Resource Conservation and Recovery Act (tracking hazardous waste))
Housing units lacking complete plumbing facilities: 2.8% Housing units lacking complete kitchen facilities: 7.1%
46.7%Electricity
35.0%Utility gas
10.3%Bottled, tank, or LP gas
6.6%Wood
0.8%Fuel oil, kerosene, etc.
0.6%Other fuel
Population in 1990: 2,647. Population change in the 1990s: +611 (+23.1%).
Place of birth for U.S.-born residents:
This state: 1,737
Northeast: 71
Midwest: 589
South: 427
West: 204
56% of the 38221 zip code residents lived in the same house 5 years ago. Out of people who lived in different houses, 53% lived in this county. Out of people who lived in different counties, 50% lived in Tennessee.
94% of the 38221 zip code residents lived in the same house 1 year ago. Out of people who lived in different houses, 28% moved from this county. Out of people who lived in different houses, 44% moved from different county within same state. Out of people who lived in different houses, 35% moved from different state.
Private vs. public school enrollment:
Students in private schools in grades 1 to 8 (elementary and middle school): 4
Here:
2.2%
Tennessee:
15.0%
Students in private schools in grades 9 to 12 (high school): 1
Here:
1.0%
Tennessee:
16.2%
Students in private undergraduate colleges: 40
Here:
82.6%
Tennessee:
23.5%
Occupation by median earnings in the past 12 months ($)
82,829Installation, maintenance, and repair occupations
61,799Business and financial operations occupations
54,764Health diagnosing and treating practitioners and other technical occupations
39,596Production occupations
31,354Management occupations
30,970Material moving occupations
Top industries in this zip code by the number of employees in 2005:
Finance and Insurance: Commercial Banking (10-19: 1)
Administrative and Support and Waste Management and Remediation Services: All Other Support Services (5-9: 1)
Construction: Other Heavy and Civil Engineering Construction (5-9: 1)
Real Estate and Rental and Leasing: Offices of Real Estate Agents and Brokers (1-4: 2)
Construction: New Single-Family Housing Construction (except Operative Builders) (1-4: 2)
Other Services (except Public Administration): Religious Organizations (1-4: 2)
Fatal accident statistics in 2014:
Fatal accident count: 1
Vehicles involved in fatal accidents: 1
Fatal accidents caused by drunken drivers: 1
Fatalities: 1
Persons involved in fatal accidents: 2
Pedestrians involved in fatal accidents: 0
Fatal accident statistics in 2013:
Fatal accident count: 2
Vehicles involved in fatal accidents: 2
Fatal accidents caused by drunken drivers: 0
Fatalities: 2
Persons involved in fatal accidents: 3
Pedestrians involved in fatal accidents: 0
2002 - 2018 National Fire Incident Reporting System (NFIRS) incidents
According to the data from the years 2002 - 2018 the average number of fires per year is 20. The highest number of fires - 32 took place in 2005, and the least - 4 in 2003. The data has a constant trend.
When looking into fire subcategories, the most incidents belonged to: Outside Fires (43.6%), and Structure Fires (42.7%).
Fire incident types reported to NFIRS in Zip Code 38221


 Nearest zip codes: 38256, 38333, 37175, 38320, 38222, 38236.


 According to the data from the years 2002 - 2018 the average number of fires per year is 20. The highest number of fires - 32 took place in 2005, and the least - 4 in 2003. The data has a constant trend.
 When looking into fire subcategories, the most incidents belonged to: Outside Fires (43.6%), and Structure Fires (42.7%).