Estimated zip code population in 2022: 3,635 Zip code population in 2010: 2,630 Zip code population in 2000: 2,209
Houses and condos: 1,445 Renter-occupied apartments: 147
% of renters here:
10%
State:
33%
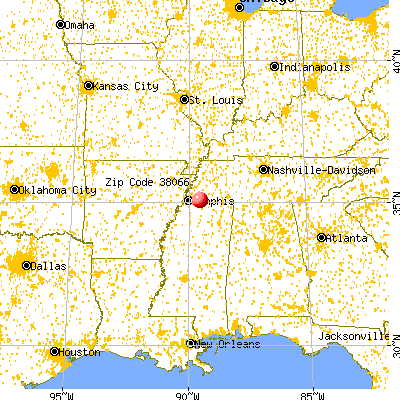
March 2022 cost of living index in zip code 38066: 79.6 (low, U.S. average is 100)
Land area: 61.3 sq. mi. Water area: 0.1 sq. mi.
Population density: 59 people per square mile
(very low).
OSM Map
General Map
Google Map
MSN Map
OSM Map
General Map
Google Map
MSN Map
OSM Map
General Map
Google Map
MSN Map
OSM Map
General Map
Google Map
MSN Map
Please wait while loading the map...
Real estate property taxes paid for housing units in 2022:
This zip code:
0.3% ($1,138)
Tennessee:
0.5% ($1,376)
Median real estate property taxes paid for housing units with mortgages in 2022: $1,368 (0.3%) Median real estate property taxes paid for housing units with no mortgage in 2022: $656 (0.3%)
Business Search- 14 Million verified businesses
Males: 1,722
(47.4%)
Females: 1,913
(52.6%)
For population 25 years and over in 38066:
High school or higher: 94.1%
Bachelor's degree or higher: 31.1%
Graduate or professional degree: 10.9%
Unemployed: 4.0%
Mean travel time to work (commute): 38.6 minutes
For population 15 years and over in 38066:
Never married: 29.9%
Now married: 53.2%
Separated: 0.6%
Widowed: 7.3%
Divorced: 9.0%
Zip code 38066 compared to state average:
Black race population percentage above state average.
Median age significantly above state average.
Renting percentage significantly below state average.
Length of stay since moving in significantly above state average.
Estimated median house/condo value in 2022: $348,484
38066:
$348,484
Tennessee:
$284,800
According to our research of Tennessee and other state lists, there were 8 registered sex offenders living in 38066 zip code as of June 07, 2024. The ratio of all residents to sex offenders in zip code 38066 is 373 to 1. The ratio of registered sex offenders to all residents in this zip code is near the state average.
Median resident age:
This zip code:
51.1 years
Tennessee median age:
39.2 years
Average household size:
This zip code:
2.5 people
Tennessee:
2.4 people
Averages for the 2020 tax year for zip code 38066, filed in 2021:
Average Adjusted Gross Income (AGI) in 2020: $101,415 (Individual Income Tax Returns)
Here:
$101,415
State:
$69,014
Salary/wage: $83,977 (reported on 80.3% of returns)
Here:
$83,977
State:
$55,872
(% of AGI for various income ranges: 1367.9% for AGIs below $25k, 4143.7% for AGIs $25k-50k, 6200.6% for AGIs $50k-75k, 9788.8% for AGIs $75k-100k, 19057.4% for AGIs $100k-200k, 78441.7% for AGIs over 200k)
Taxable interest for individuals: $2,212 (reported on 34.7% of returns)
This zip code:
$2,212
Tennessee:
$1,945
(% of AGI for various income ranges: 14.5% for AGIs below $25k, 18.9% for AGIs $25k-50k, 79.4% for AGIs $50k-75k, 45.0% for AGIs $75k-100k, 127.4% for AGIs $100k-200k, 1371.7% for AGIs over 200k)
Ordinary dividends: $7,341 (reported on 21.4% of returns)
Here:
$7,341
State:
$8,105
(% of AGI for various income ranges: 30.6% for AGIs below $25k, 25.9% for AGIs $25k-50k, 90.6% for AGIs $50k-75k, 86.2% for AGIs $75k-100k, 412.1% for AGIs $100k-200k, 2580.0% for AGIs over 200k)
Net capital gain/loss in AGI: +$14,263 (reported on 20.2% of returns)
Here:
+$14,263
State:
+$33,664
(% of AGI for various income ranges: 2.7% for AGIs below $25k, 7.0% for AGIs $25k-50k, 46.9% for AGIs $50k-75k, 86.2% for AGIs $75k-100k, 634.7% for AGIs $100k-200k, 6023.3% for AGIs over 200k)
Profit/loss from business: +$18,382 (reported on 22.0% of returns)
Here:
+$18,382
State:
+$18,991
(% of AGI for various income ranges: 561.9% for AGIs $50k-75k, 740.0% for AGIs $75k-100k, 1416.3% for AGIs $100k-200k, 5080.0% for AGIs over 200k)
Taxable individual retirement arrangement distribution: $30,458 (reported on 11.0% of returns)
38066:
$30,458
Tennessee:
$20,036
(% of AGI for various income ranges: 65.2% for AGIs below $25k, 68.1% for AGIs $25k-50k, 342.5% for AGIs $50k-75k, 982.1% for AGIs $100k-200k, 4956.7% for AGIs over 200k)
Total itemized deductions: $34,750 (reported on 13.9% of returns)
Here:
$34,750
State:
$40,136
(% of AGI for various income ranges: 327.4% for AGIs $25k-50k, 723.1% for AGIs $50k-75k, 932.5% for AGIs $75k-100k, 1171.6% for AGIs $100k-200k, 5545.0% for AGIs over 200k)
Charity contributions: $13,461 (reported on 13.3% of returns)
Here:
$13,461
State:
$19,852
(% of AGI for various income ranges: 298.8% for AGIs $50k-75k, 297.5% for AGIs $75k-100k, 398.4% for AGIs $100k-200k, 2705.0% for AGIs over 200k)
Taxes paid: $5,188 (reported on 13.9% of returns)
38066:
$5,188
State:
$6,038
(% of AGI for various income ranges: 19.7% for AGIs below $25k, 104.4% for AGIs $50k-75k, 146.2% for AGIs $75k-100k, 205.3% for AGIs $100k-200k, 843.3% for AGIs over 200k)
Earned income credit: $2,378 (reported on 13.3% of returns)
Here:
$2,378
State:
$2,391
(% of AGI for various income ranges: 116.1% for AGIs below $25k, 60.7% for AGIs $25k-50k)
Percentage of individuals using paid preparers for their 2020 taxes: 91.3%
Here:
91%
State:
93%
(% for various income ranges: 89.1% for AGIs below $25k, 91.7% for AGIs $25k-50k, 91.3% for AGIs $50k-75k, 85.7% for AGIs $75k-100k, 91.9% for AGIs $100k-200k, 100.0% for AGIs over 200k)
Averages for the 2012 tax year for zip code 38066, filed in 2013:
Average Adjusted Gross Income (AGI) in 2012: $70,919 (Individual Income Tax Returns)
Here:
$70,919
State:
$53,767
Salary/wage: $63,044 (reported on 85.2% of returns)
Here:
$63,044
State:
$45,421
(% of AGI for various income ranges: 74.8% for AGIs below $25k, 83.7% for AGIs $25k-50k, 76.3% for AGIs $50k-75k, 69.3% for AGIs $75k-100k, 73.9% for AGIs $100k-200k, 76.1% for AGIs over 200k)
Taxable interest for individuals: $1,761 (reported on 30.4% of returns)
This zip code:
$1,761
Tennessee:
$1,732
(% of AGI for various income ranges: 0.3% for AGIs below $25k, 0.4% for AGIs $25k-50k, 0.8% for AGIs $50k-75k, 0.5% for AGIs $75k-100k, 0.6% for AGIs $100k-200k, 1.2% for AGIs over 200k)
Ordinary dividends: $3,781 (reported on 15.6% of returns)
Here:
$3,781
State:
$6,739
(% of AGI for various income ranges: 0.4% for AGIs below $25k, 0.2% for AGIs $25k-50k, 0.6% for AGIs $50k-75k, 0.6% for AGIs $100k-200k, 1.6% for AGIs over 200k)
Net capital gain/loss in AGI: +$8,635 (reported on 12.6% of returns)
Here:
+$8,635
State:
+$19,082
(% of AGI for various income ranges: 1.0% for AGIs $100k-200k, 3.7% for AGIs over 200k)
Profit/loss from business: +$12,755 (reported on 23.0% of returns)
Here:
+$12,755
State:
+$15,240
(% of AGI for various income ranges: 7.9% for AGIs below $25k, 3.2% for AGIs $25k-50k, 2.0% for AGIs $50k-75k, 7.5% for AGIs $75k-100k, 8.3% for AGIs $100k-200k)
Taxable individual retirement arrangement distribution: $14,667 (reported on 8.9% of returns)
38066:
$14,667
Tennessee:
$15,505
(% of AGI for various income ranges: 3.7% for AGIs below $25k, 6.8% for AGIs $50k-75k, 3.4% for AGIs $100k-200k)
Total itemized deductions: $22,144 (18% of AGI, reported on 35.6% of returns)
Here:
$22,144
State:
$21,976
Here:
17.8% of AGI
State:
17.8% of AGI
(% of AGI for various income ranges: 7.9% for AGIs below $25k, 12.7% for AGIs $25k-50k, 14.0% for AGIs $50k-75k, 14.3% for AGIs $75k-100k, 13.5% for AGIs $100k-200k, 7.6% for AGIs over 200k)
Charity contributions: $5,860 (reported on 31.1% of returns)
Here:
$5,860
State:
$6,709
(% of AGI for various income ranges: 1.7% for AGIs below $25k, 3.0% for AGIs $25k-50k, 3.6% for AGIs $50k-75k, 3.4% for AGIs $75k-100k, 2.7% for AGIs $100k-200k, 2.0% for AGIs over 200k)
Taxes paid: $4,062 (reported on 35.6% of returns)
38066:
$4,062
State:
$4,829
(% of AGI for various income ranges: 0.9% for AGIs below $25k, 1.5% for AGIs $25k-50k, 2.3% for AGIs $50k-75k, 2.8% for AGIs $75k-100k, 2.9% for AGIs $100k-200k, 1.5% for AGIs over 200k)
Earned income credit: $2,620 (reported on 22.2% of returns)
Here:
$2,620
State:
$2,404
(% of AGI for various income ranges: 10.4% for AGIs below $25k, 0.9% for AGIs $25k-50k)
Percentage of individuals using paid preparers for their 2012 taxes: 63.0%
Here:
63%
State:
52%
(% for various income ranges: 62.7% for AGIs below $25k, 60.6% for AGIs $25k-50k, 60.0% for AGIs $50k-75k, 70.0% for AGIs $75k-100k, 60.0% for AGIs $100k-200k, 83.3% for AGIs over 200k)
Averages for the 2004 tax year for zip code 38066, filed in 2005:
Average Adjusted Gross Income (AGI) in 2004: $47,158 (Individual Income Tax Returns)
Here:
$47,158
State:
$44,088
Salary/wage: $39,698 (reported on 88.4% of returns)
Here:
$39,698
State:
$38,825
(% of AGI for various income ranges: 108.9% for AGIs below $10k, 88.3% for AGIs $10k-25k, 85.7% for AGIs $25k-50k, 83.9% for AGIs $50k-75k, 88.4% for AGIs $75k-100k, 57.4% for AGIs over 100k)
Taxable interest for individuals: $1,786 (reported on 30.3% of returns)
This zip code:
$1,786
Tennessee:
$1,802
(% of AGI for various income ranges: 3.4% for AGIs below $10k, 0.9% for AGIs $10k-25k, 0.9% for AGIs $25k-50k, 0.8% for AGIs $50k-75k, 0.2% for AGIs $75k-100k, 1.6% for AGIs over 100k)
Taxable dividends: $1,821 (reported on 14.8% of returns)
Here:
$1,821
State:
$3,727
(% of AGI for various income ranges: 0.7% for AGIs below $10k, 0.8% for AGIs $10k-25k, 0.5% for AGIs $25k-50k, 0.1% for AGIs $50k-75k, 0.2% for AGIs $75k-100k, 0.8% for AGIs over 100k)
Net capital gain/loss: +$9,898 (reported on 12.5% of returns)
Here:
+$9,898
State:
+$15,776
(% of AGI for various income ranges: -1.6% for AGIs below $10k, 0.3% for AGIs $10k-25k, -0.1% for AGIs $25k-50k, 0.1% for AGIs $50k-75k, 0.4% for AGIs $75k-100k, 6.1% for AGIs over 100k)
Profit/loss from business: +$11,699 (reported on 17.0% of returns)
Here:
+$11,699
State:
+$12,882
(% of AGI for various income ranges: 11.4% for AGIs below $10k, 1.4% for AGIs $10k-25k, 3.8% for AGIs $25k-50k, 3.0% for AGIs $50k-75k, 2.4% for AGIs $75k-100k, 5.8% for AGIs over 100k)
IRA payment deduction: $2,636 (reported on 1.0% of returns)
38066:
$2,636
Tennessee:
$2,934
Total itemized deductions: $17,290 (19% of AGI, reported on 30.9% of returns)
Here:
$17,290
State:
$18,035
Here:
19.1% of AGI
State:
19.9% of AGI
(% of AGI for various income ranges: 8.8% for AGIs $10k-25k, 13.2% for AGIs $25k-50k, 17.2% for AGIs $50k-75k, 13.3% for AGIs $75k-100k, 9.1% for AGIs over 100k)
Charity contributions deductions: $4,843 (5% of AGI, reported on 28.0% of returns)
Here:
$4,843
State:
$5,167
Here:
5.2% of AGI
State:
5.3% of AGI
(% of AGI for various income ranges: 1.8% for AGIs $10k-25k, 3.5% for AGIs $25k-50k, 3.2% for AGIs $50k-75k, 4.0% for AGIs $75k-100k, 2.5% for AGIs over 100k)
Total tax: $8,369 (reported on 70.7% of returns)
38066:
$8,369
State:
$7,482
(% of AGI for various income ranges: 3.5% for AGIs below $10k, 3.0% for AGIs $10k-25k, 6.2% for AGIs $25k-50k, 8.7% for AGIs $50k-75k, 10.7% for AGIs $75k-100k, 20.0% for AGIs over 100k)
Earned income credit: $1,725 (reported on 26.2% of returns)
Here:
$1,725
State:
$1,826
Percentage of individuals using paid preparers for their 2004 taxes: 63.6%
Here:
64%
State:
60%
(% for various income ranges: 54.9% for AGIs below $10k, 67.5% for AGIs $10k-25k, 66.6% for AGIs $25k-50k, 60.2% for AGIs $50k-75k, 61.1% for AGIs $75k-100k, 64.9% for AGIs over 100k)
Household received Food Stamps/SNAP in the past 12 months: 84 Household did not receive Food Stamps/SNAP in the past 12 months: 1,353
Women who had a birth in the past 12 months: 51 (46 now married, 5 unmarried) Women who did not have a birth in the past 12 months: 656 (264 now married, 392 unmarried)
Housing units in zip code 38066 with a mortgage: 763 (52 second mortgage, 46 both second mortgage and home equity loan) Houses without a mortgage: 20
Median monthly owner costs for units with a mortgage: $1,823 Median monthly owner costs for units without a mortgage: $331
Residents with income below the poverty level in 2022:
This zip code:
11.1%
Whole state:
13.3%
Residents with income below 50% of the poverty level in 2022:
This zip code:
10.0%
Whole state:
7.1%
Median number of rooms in houses and condos:
Here:
7.3
State:
6.5
Median number of rooms in apartments:
Here:
4.6
State:
4.4
Notable locations in this zip code not listed on our city pages
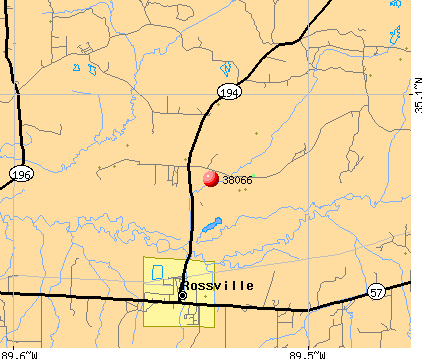
Churches in zip code 38066 include: New Bethel Church (A), Rossville Baptist Church (B), Saint Luke Church (C), Stinson Church (D), Sanctified Church (E), Thomas Chapel (F), Pleasants Church (G), Philadelphia Church (H), Mount Vernon Church (I). Display/hide their locations on the map
Cemeteries: Hunter Cemetery (1), Teel Cemetery (2), Waller Cemetery (3), Warr Cemetery (4), Knox Cemetery (5), Alexander Cemetery (6), Blain Cemetery (7). Display/hide their locations on the map
Reservoirs and swamps: Johnson Lake (A), Mustin Lake Number One (B), Mustin Lake Number Two (C), Church Lake (D), Keith Lake Number Three (E), Lily Lake (F). Display/hide their locations on the map
Size of family households: 517 2-persons, 199 3-persons, 163 4-persons, 97 5-persons, 30 6-persons, 6 7-or-more-persons
Size of nonfamily households: 325 1-person, 92 2-persons
410 married couples with children.
69 single-parent households (4 men, 65 women).
92.1% of residents of 38066 zip code speak English at home.
6.2% of residents speak Spanish at home (63% very well, 13% well, 24% not well).
0.7% of residents speak other Indo-European language at home (100% very well).
1.3% of residents speak Asian or Pacific Island language at home (44% very well, 49% well, 7% not well).
Foreign born population: 169 (4.7%) (23.8% of them are naturalized citizens)
This zip code:
4.7%
Whole state:
5.6%
57%Honduras
8%Laos
7%Thailand
4%Uruguay
2%France
2%Chile
1%Sweden
14%English
12%American
6%Irish
4%German
3%Scottish
2%Italian
1%Scotch-Irish
Year of entry for the foreign-born population
242010 or later
1152000 to 2009
61990 to 1999
26Before 1990
Facilities with environmental interests located in this zip code:
DE SOTO FERTLIZER CO INC. (PO BOX 218 in ROSSVILLE, TN)
(Resource Conservation and Recovery Act (tracking hazardous waste)) Business NAICS classification: FERTILIZER (MIXING ONLY) MANUFACTURING.
Housing units lacking complete plumbing facilities: 1.9% Housing units lacking complete kitchen facilities: 2.1%
64.7%Utility gas
29.8%Electricity
5.4%Bottled, tank, or LP gas
Population in 1990: 3,730.
Place of birth for U.S.-born residents:
This state: 2,226
Northeast: 122
Midwest: 296
South: 671
West: 131
71% of the 38066 zip code residents lived in the same house 5 years ago. Out of people who lived in different houses, 36% lived in this county. Out of people who lived in different counties, 50% lived in Tennessee.
96% of the 38066 zip code residents lived in the same house 1 year ago. Out of people who lived in different houses, 13% moved from this county. Out of people who lived in different houses, 70% moved from different county within same state. Out of people who lived in different houses, 33% moved from different state.
Private vs. public school enrollment:
Students in private schools in grades 1 to 8 (elementary and middle school): 68
Here:
24.9%
Tennessee:
15.0%
Students in private schools in grades 9 to 12 (high school): 51
Here:
39.1%
Tennessee:
16.2%
Students in private undergraduate colleges: 58
Here:
42.1%
Tennessee:
23.5%
Occupation by median earnings in the past 12 months ($)
159,273Law enforcement workers including supervisors
132,951Architecture and engineering occupations
111,954Installation, maintenance, and repair occupations
98,619Arts, design, entertainment, sports, and media occupations
94,080Health diagnosing and treating practitioners and other technical occupations
91,476Fire fighting and prevention, and other protective service workers including supervisors
Top industries in this zip code by the number of employees in 2005:
Construction: Commercial and Institutional Building Construction (50-99 employees: 1 establishment)
Educational Services: Elementary and Secondary Schools (20-49: 1)
Construction: Poured Concrete Foundation and Structure Contractors (10-19: 1)
Health Care and Social Assistance: Offices of Physicians (except Mental Health Specialists) (10-19: 1)
Construction: Plumbing, Heating, and Air-Conditioning Contractors (5-9: 1, 1-4: 2)
Other Services (except Public Administration): Religious Organizations (5-9: 1, 1-4: 1)
Fatal accident statistics in 2014:
Fatal accident count: 1
Vehicles involved in fatal accidents: 1
Fatal accidents caused by drunken drivers: 1
Fatalities: 1
Persons involved in fatal accidents: 5
Pedestrians involved in fatal accidents: 0
Fatal accident statistics in 2013:
Fatal accident count: 1
Vehicles involved in fatal accidents: 2
Fatal accidents caused by drunken drivers: 0
Fatalities: 1
Persons involved in fatal accidents: 7
Pedestrians involved in fatal accidents: 0
2002 - 2018 National Fire Incident Reporting System (NFIRS) incidents
Based on the data from the years 2002 - 2018 the average number of fires per year is 29. The highest number of fire incidents - 57 took place in 2010, and the least - 2 in 2003. The data has a rising trend.
When looking into fire subcategories, the most incidents belonged to: Outside Fires (51.1%), and Structure Fires (37.5%).
Fire incident types reported to NFIRS in Zip Code 38066


 Nearest zip codes: 38076, 38017, 38060, 38057, 38028, 38661.


 Based on the data from the years 2002 - 2018 the average number of fires per year is 29. The highest number of fire incidents - 57 took place in 2010, and the least - 2 in 2003. The data has a rising trend.
 When looking into fire subcategories, the most incidents belonged to: Outside Fires (51.1%), and Structure Fires (37.5%).