Estimated zip code population in 2022: 21,506 Zip code population in 2010: 14,527 Zip code population in 2000: 11,136
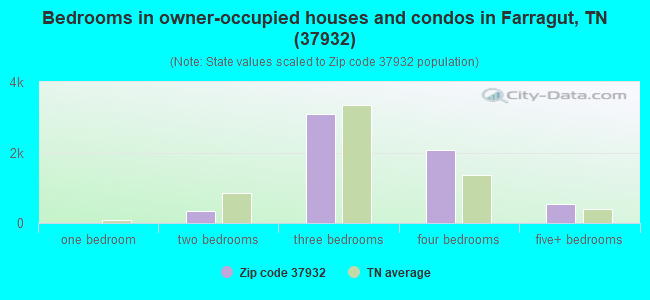
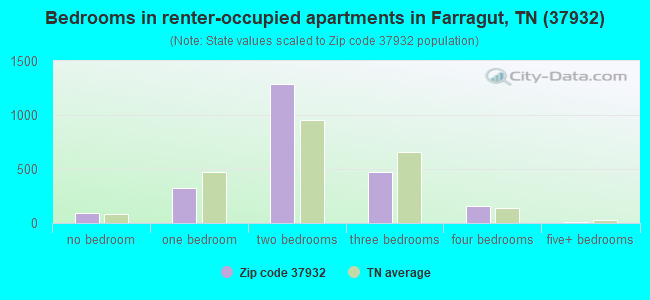
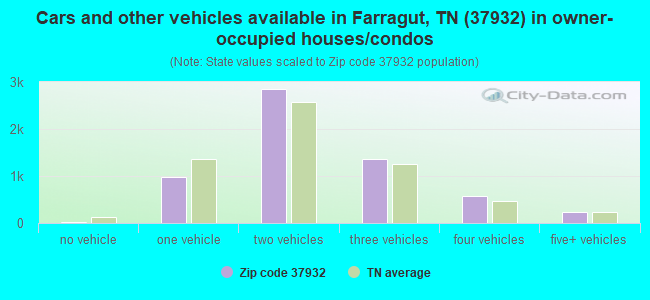
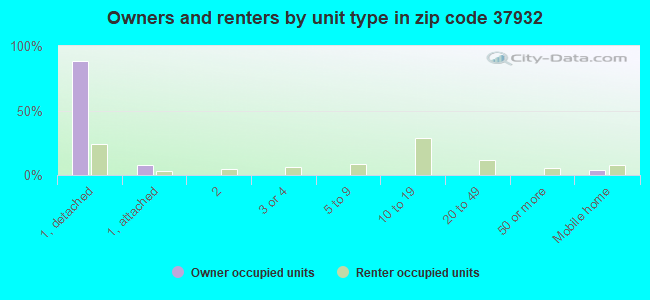
Houses and condos: 8,820 Renter-occupied apartments: 2,322
% of renters here:
28%
State:
33%
March 2022 cost of living index in zip code 37932: 87.9 (less than average, U.S. average is 100)
Land area: 28.8 sq. mi. Water area: 1.7 sq. mi.
Population density: 747 people per square mile
(low).
OSM Map
General Map
Google Map
MSN Map
OSM Map
General Map
Google Map
MSN Map
OSM Map
General Map
Google Map
MSN Map
OSM Map
General Map
Google Map
MSN Map
Please wait while loading the map...
Real estate property taxes paid for housing units in 2022:
This zip code:
0.4% ($1,568)
Tennessee:
0.5% ($1,376)
Median real estate property taxes paid for housing units with mortgages in 2022: $1,684 (0.4%) Median real estate property taxes paid for housing units with no mortgage in 2022: $1,347 (0.4%)
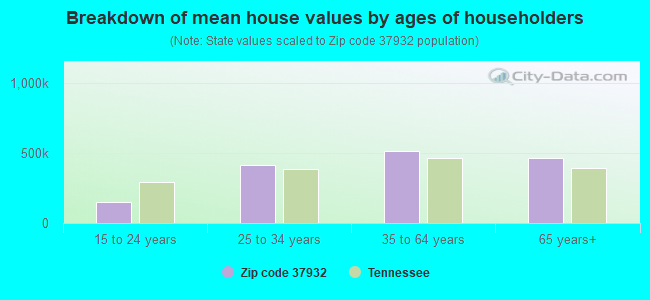
Estimated median house/condo value in 2022: $437,937
37932:
$437,937
Tennessee:
$284,800
According to our research of Tennessee and other state lists, there were 7 registered sex offenders living in 37932 zip code as of May 24, 2024. The ratio of all residents to sex offenders in zip code 37932 is 2,375 to 1. The ratio of registered sex offenders to all residents in this zip code is much lower than the state average.
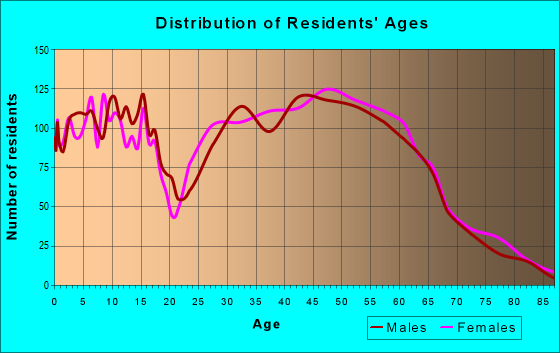
Median resident age:
This zip code:
38.0 years
Tennessee median age:
39.2 years
Average household size:
This zip code:
2.6 people
Tennessee:
2.4 people
Averages for the 2020 tax year for zip code 37932, filed in 2021:
Average Adjusted Gross Income (AGI) in 2020: $94,481 (Individual Income Tax Returns)
Here:
$94,481
State:
$69,014
Salary/wage: $82,480 (reported on 83.5% of returns)
Here:
$82,480
State:
$55,872
(% of AGI for various income ranges: 1121.9% for AGIs below $25k, 3521.5% for AGIs $25k-50k, 6259.0% for AGIs $50k-75k, 9426.3% for AGIs $75k-100k, 17987.3% for AGIs $100k-200k, 59724.1% for AGIs over 200k)
Taxable interest for individuals: $1,317 (reported on 40.3% of returns)
This zip code:
$1,317
Tennessee:
$1,945
(% of AGI for various income ranges: 19.0% for AGIs below $25k, 26.5% for AGIs $25k-50k, 50.8% for AGIs $50k-75k, 70.1% for AGIs $75k-100k, 114.8% for AGIs $100k-200k, 512.1% for AGIs over 200k)
Ordinary dividends: $5,280 (reported on 24.6% of returns)
Here:
$5,280
State:
$8,105
(% of AGI for various income ranges: 28.2% for AGIs below $25k, 41.5% for AGIs $25k-50k, 87.2% for AGIs $50k-75k, 119.3% for AGIs $75k-100k, 226.7% for AGIs $100k-200k, 1903.1% for AGIs over 200k)
Net capital gain/loss in AGI: +$18,946 (reported on 22.6% of returns)
Here:
+$18,946
State:
+$33,664
(% of AGI for various income ranges: 18.4% for AGIs below $25k, 45.3% for AGIs $25k-50k, 135.0% for AGIs $50k-75k, 194.5% for AGIs $75k-100k, 474.2% for AGIs $100k-200k, 9087.2% for AGIs over 200k)
Profit/loss from business: +$26,219 (reported on 17.3% of returns)
Here:
+$26,219
State:
+$18,991
(% of AGI for various income ranges: 136.8% for AGIs below $25k, 261.9% for AGIs $25k-50k, 360.6% for AGIs $50k-75k, 348.3% for AGIs $75k-100k, 738.8% for AGIs $100k-200k, 6143.6% for AGIs over 200k)
Taxable individual retirement arrangement distribution: $21,822 (reported on 9.9% of returns)
37932:
$21,822
Tennessee:
$20,036
(% of AGI for various income ranges: 55.8% for AGIs below $25k, 108.6% for AGIs $25k-50k, 268.0% for AGIs $50k-75k, 390.7% for AGIs $75k-100k, 534.4% for AGIs $100k-200k, 1503.1% for AGIs over 200k)
Self-employed (Keogh) retirement plans: $32,500 (reported on 0.9% of returns)
37932:
$32,500
Tennessee:
$28,955
(% of AGI for various income ranges: 41.3% for AGIs $100k-200k, 651.3% for AGIs over 200k)
Total itemized deductions: $37,368 (reported on 8.4% of returns)
Here:
$37,368
State:
$40,136
(% of AGI for various income ranges: 43.0% for AGIs below $25k, 97.3% for AGIs $25k-50k, 172.9% for AGIs $50k-75k, 226.6% for AGIs $75k-100k, 667.0% for AGIs $100k-200k, 4393.8% for AGIs over 200k)
Charity contributions: $19,725 (reported on 7.3% of returns)
Here:
$19,725
State:
$19,852
(% of AGI for various income ranges: 15.6% for AGIs $25k-50k, 50.0% for AGIs $50k-75k, 46.8% for AGIs $75k-100k, 258.5% for AGIs $100k-200k, 2654.9% for AGIs over 200k)
Taxes paid: $5,678 (reported on 8.1% of returns)
37932:
$5,678
State:
$6,038
(% of AGI for various income ranges: 3.0% for AGIs below $25k, 10.6% for AGIs $25k-50k, 26.7% for AGIs $50k-75k, 40.6% for AGIs $75k-100k, 114.4% for AGIs $100k-200k, 587.7% for AGIs over 200k)
Earned income credit: $2,078 (reported on 8.5% of returns)
Here:
$2,078
State:
$2,391
(% of AGI for various income ranges: 59.3% for AGIs below $25k, 49.1% for AGIs $25k-50k, 1.5% for AGIs $50k-75k)
Percentage of individuals using paid preparers for their 2020 taxes: 93.1%
Here:
93%
State:
93%
(% for various income ranges: 92.1% for AGIs below $25k, 93.2% for AGIs $25k-50k, 93.2% for AGIs $50k-75k, 93.2% for AGIs $75k-100k, 93.9% for AGIs $100k-200k, 93.0% for AGIs over 200k)
Averages for the 2012 tax year for zip code 37932, filed in 2013:
Average Adjusted Gross Income (AGI) in 2012: $75,848 (Individual Income Tax Returns)
Here:
$75,848
State:
$53,767
Salary/wage: $66,358 (reported on 87.0% of returns)
Here:
$66,358
State:
$45,421
(% of AGI for various income ranges: 76.8% for AGIs below $25k, 81.1% for AGIs $25k-50k, 80.9% for AGIs $50k-75k, 82.4% for AGIs $75k-100k, 83.5% for AGIs $100k-200k, 60.8% for AGIs over 200k)
Taxable interest for individuals: $1,226 (reported on 38.8% of returns)
This zip code:
$1,226
Tennessee:
$1,732
(% of AGI for various income ranges: 1.0% for AGIs below $25k, 0.7% for AGIs $25k-50k, 0.5% for AGIs $50k-75k, 0.4% for AGIs $75k-100k, 0.5% for AGIs $100k-200k, 0.9% for AGIs over 200k)
Ordinary dividends: $3,439 (reported on 21.9% of returns)
Here:
$3,439
State:
$6,739
(% of AGI for various income ranges: 1.3% for AGIs below $25k, 0.9% for AGIs $25k-50k, 0.8% for AGIs $50k-75k, 0.7% for AGIs $75k-100k, 0.7% for AGIs $100k-200k, 1.6% for AGIs over 200k)
Net capital gain/loss in AGI: +$19,138 (reported on 17.3% of returns)
Here:
+$19,138
State:
+$19,082
(% of AGI for various income ranges: 0.3% for AGIs below $25k, 0.3% for AGIs $25k-50k, 0.5% for AGIs $50k-75k, 0.2% for AGIs $75k-100k, 0.8% for AGIs $100k-200k, 14.0% for AGIs over 200k)
Profit/loss from business: +$19,429 (reported on 17.5% of returns)
Here:
+$19,429
State:
+$15,240
(% of AGI for various income ranges: 8.3% for AGIs below $25k, 4.7% for AGIs $25k-50k, 3.1% for AGIs $50k-75k, 2.5% for AGIs $75k-100k, 4.0% for AGIs $100k-200k, 5.9% for AGIs over 200k)
Taxable individual retirement arrangement distribution: $14,528 (reported on 9.3% of returns)
37932:
$14,528
Tennessee:
$15,505
(% of AGI for various income ranges: 2.6% for AGIs below $25k, 2.0% for AGIs $25k-50k, 2.2% for AGIs $50k-75k, 1.8% for AGIs $75k-100k, 1.9% for AGIs $100k-200k, 1.3% for AGIs over 200k)
Self-employment retirement plans: $27,800 (reported on 1.0% of returns)
37932:
$27,800
Tennessee:
$22,567
Total itemized deductions: $22,378 (17% of AGI, reported on 35.6% of returns)
Here:
$22,378
State:
$21,976
Here:
16.8% of AGI
State:
17.8% of AGI
(% of AGI for various income ranges: 8.9% for AGIs below $25k, 10.3% for AGIs $25k-50k, 10.8% for AGIs $50k-75k, 11.9% for AGIs $75k-100k, 11.7% for AGIs $100k-200k, 8.7% for AGIs over 200k)
Charity contributions: $6,787 (reported on 30.3% of returns)
Here:
$6,787
State:
$6,709
(% of AGI for various income ranges: 0.8% for AGIs below $25k, 1.4% for AGIs $25k-50k, 1.9% for AGIs $50k-75k, 2.6% for AGIs $75k-100k, 2.9% for AGIs $100k-200k, 3.6% for AGIs over 200k)
Taxes paid: $4,423 (reported on 35.1% of returns)
37932:
$4,423
State:
$4,829
(% of AGI for various income ranges: 1.1% for AGIs below $25k, 1.6% for AGIs $25k-50k, 2.0% for AGIs $50k-75k, 2.2% for AGIs $75k-100k, 2.5% for AGIs $100k-200k, 1.7% for AGIs over 200k)
Earned income credit: $2,005 (reported on 12.5% of returns)
Here:
$2,005
State:
$2,404
(% of AGI for various income ranges: 5.1% for AGIs below $25k, 0.9% for AGIs $25k-50k)
Percentage of individuals using paid preparers for their 2012 taxes: 41.4%
Here:
41%
State:
52%
(% for various income ranges: 37.9% for AGIs below $25k, 41.4% for AGIs $25k-50k, 40.2% for AGIs $50k-75k, 40.7% for AGIs $75k-100k, 41.5% for AGIs $100k-200k, 68.6% for AGIs over 200k)
Averages for the 2004 tax year for zip code 37932, filed in 2005:
Average Adjusted Gross Income (AGI) in 2004: $60,023 (Individual Income Tax Returns)
Here:
$60,023
State:
$44,088
Salary/wage: $54,938 (reported on 87.6% of returns)
Here:
$54,938
State:
$38,825
(% of AGI for various income ranges: 219.4% for AGIs below $10k, 77.1% for AGIs $10k-25k, 82.9% for AGIs $25k-50k, 85.0% for AGIs $50k-75k, 87.9% for AGIs $75k-100k, 73.4% for AGIs over 100k)
Taxable interest for individuals: $1,405 (reported on 50.0% of returns)
This zip code:
$1,405
Tennessee:
$1,802
(% of AGI for various income ranges: 9.0% for AGIs below $10k, 2.1% for AGIs $10k-25k, 1.0% for AGIs $25k-50k, 1.0% for AGIs $50k-75k, 0.9% for AGIs $75k-100k, 1.2% for AGIs over 100k)
Taxable dividends: $2,949 (reported on 25.0% of returns)
Here:
$2,949
State:
$3,727
(% of AGI for various income ranges: 5.3% for AGIs below $10k, 0.9% for AGIs $10k-25k, 0.8% for AGIs $25k-50k, 0.7% for AGIs $50k-75k, 0.5% for AGIs $75k-100k, 1.8% for AGIs over 100k)
Net capital gain/loss: +$11,100 (reported on 21.1% of returns)
Here:
+$11,100
State:
+$15,776
(% of AGI for various income ranges: -3.5% for AGIs below $10k, -0.4% for AGIs $10k-25k, 0.5% for AGIs $25k-50k, 0.5% for AGIs $50k-75k, 0.7% for AGIs $75k-100k, 7.9% for AGIs over 100k)
Profit/loss from business: +$15,267 (reported on 19.4% of returns)
Here:
+$15,267
State:
+$12,882
(% of AGI for various income ranges: 2.7% for AGIs below $10k, 8.2% for AGIs $10k-25k, 4.6% for AGIs $25k-50k, 3.1% for AGIs $50k-75k, 2.7% for AGIs $75k-100k, 6.2% for AGIs over 100k)
IRA payment deduction: $3,297 (reported on 2.6% of returns)
37932:
$3,297
Tennessee:
$2,934
(% of AGI for various income ranges: 0.3% for AGIs $10k-25k, 0.3% for AGIs $25k-50k, 0.2% for AGIs $50k-75k, 0.1% for AGIs $75k-100k, 0.1% for AGIs over 100k)
Self-employed pension: $15,227 (reported on 1.6% of returns)
Here:
$15,227
Tennessee:
$16,857
Total itemized deductions: $17,427 (18% of AGI, reported on 38.8% of returns)
Here:
$17,427
State:
$18,035
Here:
17.7% of AGI
State:
19.9% of AGI
(% of AGI for various income ranges: 23.5% for AGIs below $10k, 10.1% for AGIs $10k-25k, 11.2% for AGIs $25k-50k, 12.9% for AGIs $50k-75k, 13.6% for AGIs $75k-100k, 9.8% for AGIs over 100k)
Charity contributions deductions: $4,734 (5% of AGI, reported on 34.8% of returns)
Here:
$4,734
State:
$5,167
Here:
4.6% of AGI
State:
5.3% of AGI
(% of AGI for various income ranges: 1.4% for AGIs below $10k, 1.3% for AGIs $10k-25k, 1.7% for AGIs $25k-50k, 2.4% for AGIs $50k-75k, 3.2% for AGIs $75k-100k, 3.1% for AGIs over 100k)
Total tax: $10,188 (reported on 82.5% of returns)
37932:
$10,188
State:
$7,482
(% of AGI for various income ranges: 7.1% for AGIs below $10k, 4.9% for AGIs $10k-25k, 7.3% for AGIs $25k-50k, 9.4% for AGIs $50k-75k, 10.7% for AGIs $75k-100k, 19.9% for AGIs over 100k)
Earned income credit: $1,660 (reported on 9.6% of returns)
Here:
$1,660
State:
$1,826
Percentage of individuals using paid preparers for their 2004 taxes: 45.9%
Here:
46%
State:
60%
(% for various income ranges: 38.7% for AGIs below $10k, 49.3% for AGIs $10k-25k, 48.8% for AGIs $25k-50k, 45.8% for AGIs $50k-75k, 40.2% for AGIs $75k-100k, 50.8% for AGIs over 100k)
Likely homosexual households (counted as self-reported same-sex unmarried-partner households)
Lesbian couples: 0.3% of all households
Gay men: 0.0% of all households
Household received Food Stamps/SNAP in the past 12 months: 375 Household did not receive Food Stamps/SNAP in the past 12 months: 8,007
Women who had a birth in the past 12 months: 231 (217 now married, 18 unmarried) Women who did not have a birth in the past 12 months: 5,178 (2,521 now married, 2,656 unmarried)
Housing units in zip code 37932 with a mortgage: 4,119 (286 second mortgage, 211 both second mortgage and home equity loan) Houses without a mortgage: 60
Median monthly owner costs for units with a mortgage: $1,792 Median monthly owner costs for units without a mortgage: $492
Residents with income below the poverty level in 2022:
This zip code:
6.0%
Whole state:
13.3%
Residents with income below 50% of the poverty level in 2022:
This zip code:
2.3%
Whole state:
7.1%
Median number of rooms in houses and condos:
Here:
7.5
State:
6.5
Median number of rooms in apartments:
Here:
4.2
State:
4.4
Notable locations in this zip code not listed on our city pages
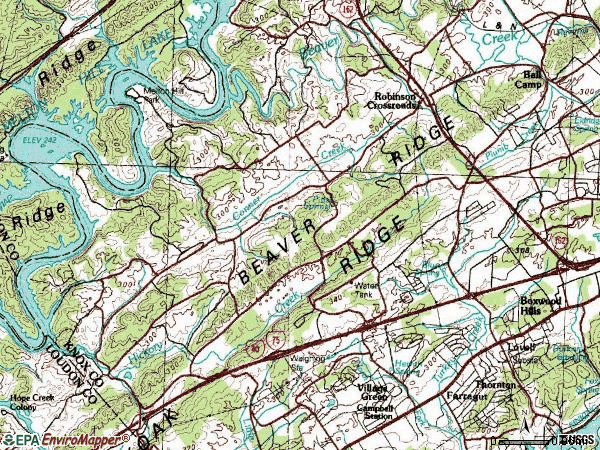
Notable locations in zip code 37932: Fiesta Farm (A), Dead Horse Lake Golf Course (B), Melton Hill Community Center (C), Karns Volunteer Fire Department Station 2 (D). Display/hide their locations on the map
Churches in zip code 37932 include: Stoney Point Church (A), Unity Church (B), Hudson Grove Church (C), Hines Valley Church (D), Smith Grove Church (E), Byrds Chapel Wesleyan Methodist Church (F), Marietta Church (G), Mount Pleasant Church (H), Concord Church (I). Display/hide their locations on the map
In group quarters: 8 (-1 institutionalized population)
Size of family households: 2,832 2-persons, 1,349 3-persons, 1,430 4-persons, 426 5-persons, 199 6-persons, 31 7-or-more-persons
Size of nonfamily households: 1,672 1-person, 389 2-persons, 13 4-persons
3,534 married couples with children.
923 single-parent households (187 men, 736 women).
91.4% of residents of 37932 zip code speak English at home.
4.7% of residents speak Spanish at home (58% very well, 25% well, 16% not well).
1.7% of residents speak other Indo-European language at home (62% very well, 29% well, 9% not well).
1.3% of residents speak Asian or Pacific Island language at home (61% very well, 23% well, 15% not well).
0.5% of residents speak other language at home (83% very well, 17% well).
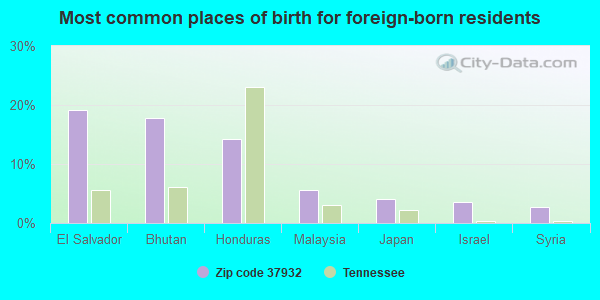
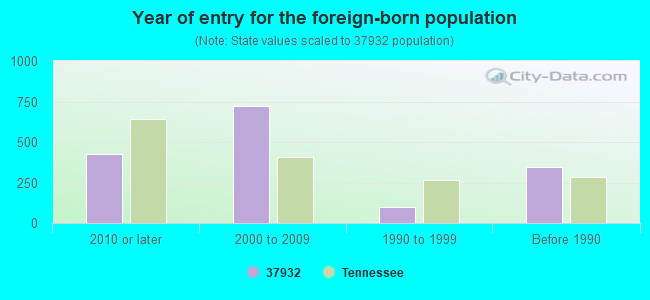
Foreign born population: 1,410 (6.6%) (40.7% of them are naturalized citizens)
Facilities with environmental interests located in this zip code:
APAC-TENNESSEE INCORPORATED (1716 EVERETT ROAD in KNOXVILLE, TN)
AIR SYNTHETIC MINOR (AIRS/AFS) COMPLIANCE ACTIVITY (Tracking inspections of insecticide, fungicide, and rodenticide, and toxic substances) (Resource Conservation and Recovery Act (tracking hazardous waste)) Business SIC classification: ASPHALT PAVING MIXTURES AND BLOCKS Alternative names: APAC-TENNESSEE, INC.: KNOXVILLE DIV.-400, APAC TENNESSEE KNOXVILLE WEST PLANT
AVERITT EXPRESS (10207 COGDILL ROAD in KNOXVILLE, TN)
(Resource Conservation and Recovery Act (tracking hazardous waste)) Business NAICS classification: GENERAL FREIGHT TRUCKING, LONG-DISTANCE, TRUCKLOAD. Organizations: STACY MENARD (CONTACT/OPERATOR)
AMERICAN ENVIRO-SERVICES (625 BARBROW LANE in KNOXVILLE, TN)
USED OIL PROGRAM (Resource Conservation and Recovery Act (tracking hazardous waste)) Organizations: MATT SKINNER (CONTACT/OPERATOR)
, JENNIFER E. LANHAM & JERRY W. MCCANDLESS (CONTACT/OWNER)
ATMOSPHERIC GLOW TECHNOLOGIES, INC. (924 CORRIDOR PARK BOULEVARD in KNOXVILLE, TN)
Conditionally Exempt Small Quantity Generators, less than 100 kg/month of hazardous waste (Resource Conservation and Recovery Act (tracking hazardous waste)) Organizations: ALAN WINTENBERG (CONTACT/OPERATOR)
, KIM KELLY-WINTENBERG (CONTACT/OWNER)
CIRCLE M SUPREME MFG. CO. INC. (1810 LOVELL RD in KNOXVILLE, TN)
(Resource Conservation and Recovery Act (tracking hazardous waste))
COMPUTATIONAL SYSTEMS, INC (835 INNOVATION DRIVE in KNOXVILLE, TN)
Small Quantity Generators, between 100 kg and 1000 kg of hazardous waste/month (Resource Conservation and Recovery Act (tracking hazardous waste)) - notification Business NAICS classification: SILVERWARE AND HOLLOWWARE MANUFACTURING. Organizations: JIM HUTSON (CONTACT/OPERATOR)
, EMERSON ELECTRIC CO (CONTACT/OWNER)
DALEN PRODUCTS, INC. (11110 GILBERT DR. in KNOXVILLE, TN)
National Pollutant Discharge Elimination System NON-MAJOR (Tracking pollutant discharge elimination systems) - permit
ADVANCED OFFICE SYSTEMS INC (10613 DUTCHTOWN RD in KNOXVILLE, TN)
Conditionally Exempt Small Quantity Generators, less than 100 kg/month of hazardous waste (Resource Conservation and Recovery Act (tracking hazardous waste)) - notification
CHEVRON PHILLIPS CHEMICAL CO PERFORMANCE PIPE DIV (10420 LEXINGTON DR in KNOXVILLE, TN)
TRI REPORTER (Tracking of toxic chemicals releasing facilities) Business SIC classification: PLASTICS PIPE Alternative names: CHEVRON CHEMICAL CO PLEXCO DIVISION
Housing units lacking complete plumbing facilities: 2.4% Housing units lacking complete kitchen facilities: 2.3%
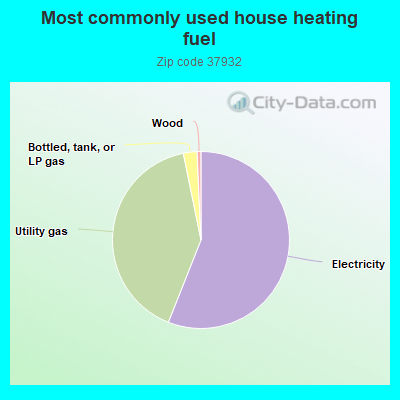
55.8%Electricity
40.6%Utility gas
2.5%Bottled, tank, or LP gas
0.7%Wood
Population in 1990: 7,975. Population change in the 1990s: +3,161 (+39.6%).
Place of birth for U.S.-born residents:
This state: 11,453
Northeast: 1,598
Midwest: 2,235
South: 3,711
West: 928
51% of the 37932 zip code residents lived in the same house 5 years ago. Out of people who lived in different houses, 53% lived in this county. Out of people who lived in different counties, 50% lived in Tennessee.
84% of the 37932 zip code residents lived in the same house 1 year ago. Out of people who lived in different houses, 43% moved from this county. Out of people who lived in different houses, 20% moved from different county within same state. Out of people who lived in different houses, 34% moved from different state. Out of people who lived in different houses, 2% moved from abroad.
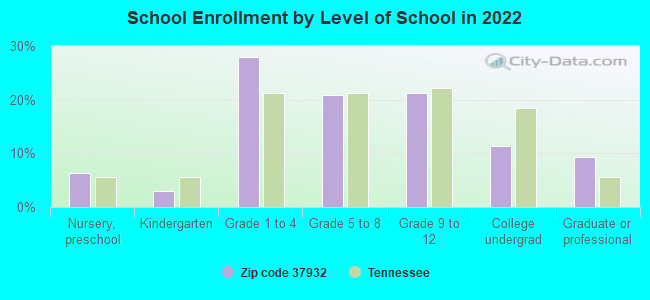
Private vs. public school enrollment:
Students in private schools in grades 1 to 8 (elementary and middle school): 592
Here:
21.1%
Tennessee:
15.0%
Students in private schools in grades 9 to 12 (high school): 226
Here:
18.5%
Tennessee:
16.2%
Students in private undergraduate colleges: 137
Here:
21.0%
Tennessee:
23.5%
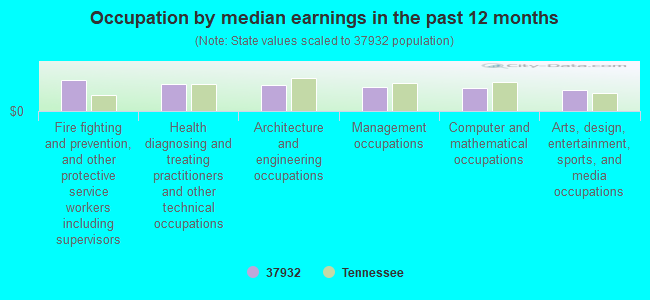
Occupation by median earnings in the past 12 months ($)
122,827Fire fighting and prevention, and other protective service workers including supervisors
103,738Health diagnosing and treating practitioners and other technical occupations
100,423Architecture and engineering occupations
94,292Management occupations
89,008Computer and mathematical occupations
80,943Arts, design, entertainment, sports, and media occupations
Companies with biggest federal contracts located in this zip code (KNOXVILLE, TN):
THE EC BALDONADO CORPORATION (10511 HARDIN VALLEY RD; small business) : $8,964,452 in 44 contractsfrom 1999 to 2005
Contracts for Operation of Government-Owned Facilities -- Other Educational Buildings, Maintenance, Repair or Alteration of Real Property -- Office Buildings, Airfield, Communication and Missile Facilities, Construction of Structures and Facilities -- Other Warehouse Buildings, and moreby Employment and Training Administration, Army Signed by year:2000: $5,664,276; 2001: $355,316; 2002: $0; 2003: $2,015,074; 2004: $277,707; 2005: $629,079; 2006: $0.
Biggest contracts:
$2,813,000 with Employment and Training Administration for Operation of Government-Owned Facilities -- Other Educational Buildings. Taking place in MA. Signed on 2000-04-15. Completion date: 2001-03-15.
$1,115,000 with Army for Maintenance, Repair or Alteration of Real Property -- Office Buildings. Signed on 2003-09-17. Completion date: 2004-07-09.
$916,000 with Employment and Training Administration for Operation of Government-Owned Facilities -- Other Educational Buildings. Taking place in MA. Signed on 2000-08-15. Completion date: 2001-03-15.
$818,000, same as above.Signed on 2000-06-15. Completion date: 2001-03-15.
TERRAINE, INC (10904 MCBRIDE LN; small business) : $4,157,567 in 68 contractsfrom 2000 to 2006
Contracts for Oil Spill Response including Cleanup, Removal, Disposal and Operational Support, Construction of Structures and Facilities -- Other Non-Building Facilities, Maintenance, Repair or Alteration of Real Property -- Water Supply Facilities, Maintenance, Repair or Alteration of Real Property -- Government-Owned Government-Operated (GOGO) R&D Facilities, and moreby Navy, National Park Service Signed by year:2000: $315,179; 2001: $331,824; 2002: $510,569; 2003: $931,989; 2004: $323,396; 2005: $1,155,965; 2006: $588,645.
Biggest contracts:
$449,214 with Navy for Oil Spill Response including Cleanup, Removal, Disposal and Operational Support. Taking place in FL. Signed on 2006-04-28. Completion date: 2007-04-30.
$444,939, same as above.Signed on 2005-04-18. Completion date: 2006-04-28.
$365,108 with Navy for Construction of Structures and Facilities -- Other Non-Building Facilities. Taking place in FL. Signed on 2002-09-26. Completion date: 2003-09-30.
$353,566, same as above.Signed on 2003-06-26. Completion date: 2004-09-30.
P E T NET PHARMACEUTICALS, INC (810 INNOVATION DR) : $3,131,582 in 76 contractsfrom 2001 to 2006
Contracts for Drugs and Biologicals, Chemical and Pharmaceutical Products Manufacturing Machinery, Nuclear Medicine, Medical and Surgical Instruments, Equipment, and Supplies by Army, Department of Veterans Affairs, Air Force, Navy, and others Signed by year:2000: $0; 2001: $397,000; 2002: $1,126,625; 2003: $1,007,950; 2004: $162,907; 2005: $402,000; 2006: $35,100.
Biggest contracts:
$750,000 with Army for Drugs and Biologicals. Taking place in TX. Signed on 2003-10-09. Completion date: 2004-09-30.
$500,000, same as above.Signed on 2005-10-11. Completion date: 2006-09-30.
$310,000 with Army for Drugs and Biologicals. Signed on 2002-11-15. Completion date: 2003-09-30.
$125,000 with Department of Veterans Affairs for Drugs and Biologicals. Taking place in GA. Signed on 2003-08-15. Completion date: 2003-10-15.
ATMOSPHERIC GLOW TECHNOLOGIES (924 CORRIDOR PARK BOULEVAR; small business) : $2,784,487 in 16 contractsfrom 2001 to 2005
Contracts for Other Research and Development -- Basic Research (R&D), Other Defense -- Basic Research (R&D), Pollution Control and Abatement -- Basic Research (R&D), Weapons -- Management and Support (R&D), and moreby Army, Air Force, EPA Signed by year:2000: $0; 2001: $551,724; 2002: $656,116; 2003: $99,735; 2004: $1,628,532; 2005: -$151,620; 2006: $0.
Biggest contracts:
$913,770 with Army for Other Research and Development -- Basic Research (R&D). Signed on 2004-03-26. Completion date: 2005-03-28.
$374,998 with Air Force for Other Defense -- Basic Research (R&D). Signed on 2004-06-28. Completion date: 2006-07-25.
$368,417 with Army for Other Research and Development -- Basic Research (R&D). Signed on 2001-11-30. Completion date: 2002-12-14.
$331,326, same as above.Signed on 2002-11-22. Completion date: 2002-12-14.
TECHNOLOGY FOR ENERGY CORP (10737 LEXINGTON DR; small business) : $2,178,714 in 33 contractsfrom 1999 to 2006
Contracts for Defense Aircraft -- Basic Research (R&D), Aircraft Ground Servicing Equipment, Engine Fuel System Components, Nonaircraft, X-Ray Equipment and Supplies: Medical, Dental, Veterinary, and moreby Air Force, Navy, Army, NASA, and others Signed by year:2000: $51,258; 2001: $370,579; 2002: $977,795; 2003: $367,909; 2004: $271,717; 2005: $66,986; 2006: $42,470.
Biggest contracts:
$748,054 with Air Force for Defense Aircraft -- Basic Research (R&D). Signed on 2002-08-14. Completion date: 2004-08-31.
$248,054, same as above.Signed on 2002-12-18. Completion date: 2004-08-31.
$201,538 with Navy for Aircraft Ground Servicing Equipment. Signed on 2002-07-22. Completion date: 2003-01-22.
$180,432 with Navy for Engine Fuel System Components, Nonaircraft. Signed on 2003-09-17. Completion date: 2003-10-16.
TERRAIN INC & ENSAFE INC (10904 MCBRIDE LN; small business) : $1,998,245 in 40 contractsfrom 2003 to 2006
Contracts for Architect - Engineer Services (including landscaping, interior layout, and designing), Other Architect and Engineering Services by Army, U.S. Army Corps of Engineers - civil program financing only Signed by year:2000: $0; 2001: $0; 2002: $0; 2003: $243,202; 2004: $387,288; 2005: $661,962; 2006: $705,793.
Biggest contracts:
$329,267 with Army for Architect - Engineer Services (including landscaping, interior layout, and designing). Taking place in KY. Signed on 2005-09-30. Completion date: 2006-01-31.
$291,978 with Army for Architect - Engineer Services (including landscaping, interior layout, and designing). Taking place in OH. Signed on 2006-06-30. Completion date: 2006-06-30.
$254,957 with Army for Architect - Engineer Services (including landscaping, interior layout, and designing). Taking place in IL. Signed on 2006-03-14. Completion date: 2007-07-31.
$218,942 with Army for Architect - Engineer Services (including landscaping, interior layout, and designing). Taking place in KY. Signed on 2005-09-30. Completion date: 2005-09-14.
ENVIRONMENTAL SAFETY & HEALTH (10732 DUTCHTOWN RD) : $1,866,972 in 34 contractsfrom 2004 to 2006
Contracts for Maintenance, Repair or Alteration of Real Property -- Canals, Maintenance, Repair or Alteration of Real Property -- Office Buildings, Maintenance, Repair or Alteration of Real Property -- Highways, Roads, Streets, Bridges, and Railways (includes resurfacing), Feasibility Studies (non-construction), and moreby Army, U.S. Army Corps of Engineers - civil program financing only, Public Buildings Service, National Park Service, and others Signed by year:2000: $0; 2001: $0; 2002: $0; 2003: $0; 2004: $355,672; 2005: $1,358,219; 2006: $153,081.
Biggest contracts:
$396,950 with Army for Maintenance, Repair or Alteration of Real Property -- Canals. Taking place in KY. Signed on 2005-07-27. Completion date: 2005-10-31.
$396,950 with U.S. Army Corps of Engineers - civil program financing only for Maintenance, Repair or Alteration of Real Property -- Canals. Taking place in KY. Signed on 2005-07-27. Completion date: 2005-10-31.
$99,128 with Public Buildings Service for Maintenance, Repair or Alteration of Real Property -- Office Buildings. Signed on 2005-06-13. Effective on 2005-06-08. Completion date: 2005-07-15.
$96,225 with National Park Service for Maintenance, Repair or Alteration of Real Property -- Highways, Roads, Streets, Bridges, and Railways (includes resurfacing). Signed on 2005-09-08. Completion date: 2005-12-31.
ATMOSPHERIC GLOW TECHNOLOGIES, (924 CORRIDOR PARK BLVD; small business) : $1,499,746 in 4 contractsin 2005
$375,000 with Air Force for Other Research and Development -- Management and Support (R&D). Signed on 2005-04-29. Completion date: 2007-04-30.
$374,995, same as above.Signed on 2005-09-12. Completion date: 2007-04-30.
$374,893 with Air Force for Weapons -- Management and Support (R&D). Signed on 2005-04-11. Completion date: 2007-04-04.
$374,858, same as above.Signed on 2005-06-29. Completion date: 2007-04-04.
PRSM CORPORATION (2210 AWARD WINNING WAY; small business) : $1,185,338 in 16 contractsfrom 2000 to 2006
Contracts for Other Architect and Engineering Services, Other Management Support Services, Defense Missile and Space Systems -- Advanced Development (R&D), Other Natural Resources and Conservation Services, and moreby Navy, Federal Technology Service, Army, ENERGY, Department of, and others Signed by year:2000: $380,788; 2001: $206,520; 2002: $74,969; 2003: $165,173; 2004: $109,875; 2005: $248,013; 2006: $0.
Biggest contracts:
$312,402 with Navy for Other Architect and Engineering Services. Taking place in DC. Signed on 2000-04-17. Completion date: 2000-12-16.
$206,520, same as above.Signed on 2001-03-07. Completion date: 2000-12-16.
$145,204 with Federal Technology Service for Other Management Support Services. Signed on 2005-11-21. Effective on 2005-11-18. Completion date: 2006-11-21.
$136,728, same as above.Signed on 2004-11-17. Completion date: 2005-11-21.
SWIFT INDUSTRIAL POWER, INC (10917 MCBRIDE LANE; small business) : $1,040,904 in 12 contractsfrom 1999 to 2004
Contracts for Batteries, Rechargeable, Converters, Electrical, Nonrotating, Maintenance, Repair and Rebuilding of Equipment -- Electric Wire, and Power and Distribution Equipment, Miscellaneous Electrical and Electronic Components by Tennessee Valley Authority, Army Signed by year:2000: $920,000; 2001: $0; 2002: $0; 2003: $0; 2004: $10,904; 2005: $0; 2006: $0.
Biggest contracts:
$237,000 with Tennessee Valley Authority for Batteries, Rechargeable. Signed on 2000-03-15. Completion date: 2000-07-15.
$142,000, same as above.Signed on 2000-04-15. Completion date: 2000-08-15.
$122,000, same as above.Signed on 2000-03-15. Completion date: 2000-08-15.
$118,000, same as above.Signed on 2000-03-15. Completion date: 2000-07-15.
Top industries in this zip code by the number of employees in 2005:
Information: Cellular and Other Wireless Telecommunications (500-999 employees: 1 establishment, 50-99 employees: 1 establishment)
Information: Cable and Other Subscription Programming (500-999: 1)
Wholesale Trade: Electrical Apparatus and Equipment, Wiring Supplies, and Related Equipment Merchant Wholesalers (250-499: 1, 100-249: 1)
Management of Companies and Enterprises: Corporate, Subsidiary, and Regional Managing Offices (50-99: 4, 20-49: 4, 5-9: 1)
Finance and Insurance: Direct Health and Medical Insurance Carriers (250-499: 1)
Professional, Scientific, and Technical Services: Research and Development in the Physical, Engineering, and Life Sciences (100-249: 1, 50-99: 1, 5-9: 1)
People in group quarters in 2010:
8 people in other noninstitutional facilities
People in group quarters in 2000:
12 people in other noninstitutional group quarters
Fatal accident statistics in 2014:
Fatal accident count: 3
Vehicles involved in fatal accidents: 5
Fatal accidents caused by drunken drivers: 0
Fatalities: 3
Persons involved in fatal accidents: 6
Pedestrians involved in fatal accidents: 1
Fatal accident statistics in 2013:
Fatal accident count: 2
Vehicles involved in fatal accidents: 3
Fatal accidents caused by drunken drivers: 0
Fatalities: 3
Persons involved in fatal accidents: 5
Pedestrians involved in fatal accidents: 0
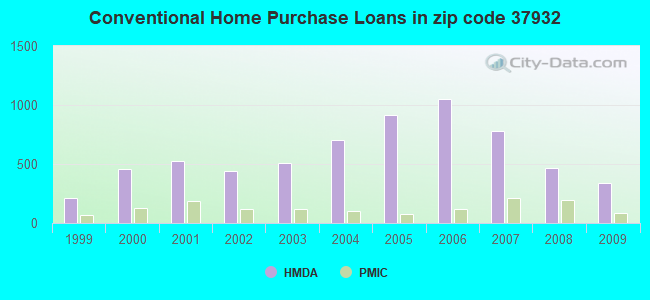
Home Mortgage Disclosure Act Aggregated Statistics For Year 2009 (Based on 2 full and 2 partial tracts)
A) FHA, FSA/RHS & VA Home Purchase Loans
B) Conventional Home Purchase Loans
C) Refinancings
D) Home Improvement Loans
F) Non-occupant Loans on < 5 Family Dwellings (A B C & D)
G) Loans On Manufactured Home Dwelling (A B C & D)
Number
Average Value
Number
Average Value
Number
Average Value
Number
Average Value
Number
Average Value
Number
Average Value
LOANS ORIGINATED
215
$184,960
339
$200,317
979
$187,137
42
$102,182
48
$141,995
5
$69,796
APPLICATIONS APPROVED, NOT ACCEPTED
8
$177,210
22
$245,525
97
$183,234
1
$163,580
6
$172,813
2
$31,810
APPLICATIONS DENIED
20
$166,956
32
$173,426
181
$201,256
15
$61,919
10
$116,906
5
$34,534
APPLICATIONS WITHDRAWN
9
$173,923
37
$198,450
163
$175,149
15
$68,186
6
$98,703
3
$36,223
FILES CLOSED FOR INCOMPLETENESS
4
$96,442
4
$81,255
40
$180,741
0
$0
2
$72,780
1
$10,000
Aggregated Statistics For Year 2008 (Based on 2 full and 2 partial tracts)
A) FHA, FSA/RHS & VA Home Purchase Loans
B) Conventional Home Purchase Loans
C) Refinancings
D) Home Improvement Loans
E) Loans on Dwellings For 5+ Families
F) Non-occupant Loans on < 5 Family Dwellings (A B C & D)
G) Loans On Manufactured Home Dwelling (A B C & D)
Number
Average Value
Number
Average Value
Number
Average Value
Number
Average Value
Number
Average Value
Number
Average Value
Number
Average Value
LOANS ORIGINATED
151
$182,987
464
$215,099
502
$170,160
66
$50,657
4
$1,373,368
43
$151,751
9
$40,059
APPLICATIONS APPROVED, NOT ACCEPTED
11
$146,238
33
$145,290
67
$153,435
13
$40,178
0
$0
4
$106,545
6
$28,335
APPLICATIONS DENIED
7
$153,339
46
$179,971
198
$150,123
50
$71,159
0
$0
10
$72,449
9
$93,864
APPLICATIONS WITHDRAWN
20
$195,541
31
$177,632
129
$188,177
27
$129,863
0
$0
9
$147,311
2
$44,865
FILES CLOSED FOR INCOMPLETENESS
2
$70,785
9
$171,598
30
$178,999
0
$0
0
$0
1
$112,690
2
$105,680
Aggregated Statistics For Year 2007 (Based on 2 full and 2 partial tracts)
A) FHA, FSA/RHS & VA Home Purchase Loans
B) Conventional Home Purchase Loans
C) Refinancings
D) Home Improvement Loans
F) Non-occupant Loans on < 5 Family Dwellings (A B C & D)
G) Loans On Manufactured Home Dwelling (A B C & D)
Number
Average Value
Number
Average Value
Number
Average Value
Number
Average Value
Number
Average Value
Number
Average Value
LOANS ORIGINATED
47
$177,511
777
$167,475
443
$157,547
66
$60,746
107
$140,817
15
$43,849
APPLICATIONS APPROVED, NOT ACCEPTED
0
$0
98
$152,670
67
$172,579
7
$76,637
12
$109,658
13
$47,669
APPLICATIONS DENIED
12
$140,577
71
$100,228
241
$150,622
56
$102,565
20
$81,380
20
$50,756
APPLICATIONS WITHDRAWN
4
$200,852
36
$193,517
131
$152,772
13
$229,746
6
$114,722
12
$85,148
FILES CLOSED FOR INCOMPLETENESS
3
$127,647
19
$168,704
44
$148,416
5
$176,584
5
$123,144
0
$0
Aggregated Statistics For Year 2006 (Based on 2 full and 2 partial tracts)
A) FHA, FSA/RHS & VA Home Purchase Loans
B) Conventional Home Purchase Loans
C) Refinancings
D) Home Improvement Loans
E) Loans on Dwellings For 5+ Families
F) Non-occupant Loans on < 5 Family Dwellings (A B C & D)
G) Loans On Manufactured Home Dwelling (A B C & D)
Number
Average Value
Number
Average Value
Number
Average Value
Number
Average Value
Number
Average Value
Number
Average Value
Number
Average Value
LOANS ORIGINATED
40
$171,404
1,048
$137,977
466
$135,118
88
$44,604
2
$3,210,340
180
$104,132
28
$43,549
APPLICATIONS APPROVED, NOT ACCEPTED
3
$98,283
90
$106,064
93
$156,399
19
$114,090
0
$0
21
$63,790
21
$49,216
APPLICATIONS DENIED
4
$99,740
121
$101,296
342
$128,992
63
$63,309
0
$0
31
$65,193
60
$57,903
APPLICATIONS WITHDRAWN
6
$224,990
76
$130,367
154
$142,028
30
$70,396
0
$0
5
$82,260
2
$40,875
FILES CLOSED FOR INCOMPLETENESS
0
$0
18
$132,953
49
$131,067
1
$123,600
0
$0
0
$0
0
$0
Aggregated Statistics For Year 2005 (Based on 2 full and 2 partial tracts)
A) FHA, FSA/RHS & VA Home Purchase Loans
B) Conventional Home Purchase Loans
C) Refinancings
D) Home Improvement Loans
F) Non-occupant Loans on < 5 Family Dwellings (A B C & D)
G) Loans On Manufactured Home Dwelling (A B C & D)
Number
Average Value
Number
Average Value
Number
Average Value
Number
Average Value
Number
Average Value
Number
Average Value
LOANS ORIGINATED
57
$142,898
913
$129,765
554
$119,107
68
$56,143
85
$110,420
45
$38,581
APPLICATIONS APPROVED, NOT ACCEPTED
0
$0
102
$100,902
93
$124,984
9
$25,409
2
$51,845
33
$36,093
APPLICATIONS DENIED
3
$114,033
180
$87,875
278
$114,305
26
$73,575
20
$112,534
78
$57,461
APPLICATIONS WITHDRAWN
12
$160,398
78
$164,286
278
$140,645
22
$135,766
11
$87,595
7
$89,534
FILES CLOSED FOR INCOMPLETENESS
0
$0
24
$78,313
26
$158,526
3
$17,837
6
$77,102
0
$0
Aggregated Statistics For Year 2004 (Based on 2 full and 2 partial tracts)
A) FHA, FSA/RHS & VA Home Purchase Loans
B) Conventional Home Purchase Loans
C) Refinancings
D) Home Improvement Loans
F) Non-occupant Loans on < 5 Family Dwellings (A B C & D)
G) Loans On Manufactured Home Dwelling (A B C & D)
Number
Average Value
Number
Average Value
Number
Average Value
Number
Average Value
Number
Average Value
Number
Average Value
LOANS ORIGINATED
69
$124,064
704
$120,695
631
$129,951
61
$47,877
68
$153,958
69
$44,598
APPLICATIONS APPROVED, NOT ACCEPTED
4
$129,083
81
$86,826
108
$107,048
6
$58,230
8
$57,328
37
$47,117
APPLICATIONS DENIED
3
$60,873
105
$67,472
273
$117,372
51
$55,146
12
$104,122
85
$51,214
APPLICATIONS WITHDRAWN
10
$124,608
59
$123,717
231
$116,601
8
$67,164
11
$91,458
20
$83,142
FILES CLOSED FOR INCOMPLETENESS
2
$86,740
16
$132,476
27
$125,769
3
$121,867
1
$110,870
0
$0
Aggregated Statistics For Year 2003 (Based on 2 full and 2 partial tracts)
A) FHA, FSA/RHS & VA Home Purchase Loans
B) Conventional Home Purchase Loans
C) Refinancings
D) Home Improvement Loans
F) Non-occupant Loans on < 5 Family Dwellings (A B C & D)
Number
Average Value
Number
Average Value
Number
Average Value
Number
Average Value
Number
Average Value
LOANS ORIGINATED
110
$117,815
506
$112,614
1,426
$125,967
76
$32,637
98
$86,811
APPLICATIONS APPROVED, NOT ACCEPTED
5
$98,658
28
$84,994
150
$103,355
7
$70,154
2
$85,740
APPLICATIONS DENIED
2
$207,375
42
$116,758
294
$110,701
28
$20,411
9
$85,972
APPLICATIONS WITHDRAWN
9
$112,737
48
$140,225
244
$120,305
3
$43,857
10
$113,813
FILES CLOSED FOR INCOMPLETENESS
0
$0
7
$117,833
29
$116,100
2
$2,990
0
$0
Aggregated Statistics For Year 2002 (Based on 2 full and 2 partial tracts)
A) FHA, FSA/RHS & VA Home Purchase Loans
B) Conventional Home Purchase Loans
C) Refinancings
D) Home Improvement Loans
F) Non-occupant Loans on < 5 Family Dwellings (A B C & D)
Number
Average Value
Number
Average Value
Number
Average Value
Number
Average Value
Number
Average Value
LOANS ORIGINATED
106
$108,188
443
$119,355
898
$119,984
55
$25,904
67
$73,272
APPLICATIONS APPROVED, NOT ACCEPTED
4
$93,220
38
$109,524
108
$116,188
7
$42,649
2
$79,760
APPLICATIONS DENIED
14
$102,673
70
$91,881
228
$98,108
31
$13,863
5
$104,668
APPLICATIONS WITHDRAWN
9
$90,773
38
$93,531
173
$109,884
4
$14,988
12
$81,099
FILES CLOSED FOR INCOMPLETENESS
0
$0
3
$96,637
30
$111,214
2
$14,955
2
$80,755
Aggregated Statistics For Year 2001 (Based on 2 full and 2 partial tracts)
A) FHA, FSA/RHS & VA Home Purchase Loans
B) Conventional Home Purchase Loans
C) Refinancings
D) Home Improvement Loans
F) Non-occupant Loans on < 5 Family Dwellings (A B C & D)
Number
Average Value
Number
Average Value
Number
Average Value
Number
Average Value
Number
Average Value
LOANS ORIGINATED
129
$102,925
522
$109,382
754
$118,642
73
$20,960
57
$81,861
APPLICATIONS APPROVED, NOT ACCEPTED
11
$110,396
64
$72,346
110
$97,970
20
$14,132
9
$106,321
APPLICATIONS DENIED
11
$101,217
110
$45,768
267
$92,303
44
$20,205
15
$84,317
APPLICATIONS WITHDRAWN
7
$98,734
42
$110,087
168
$110,519
12
$34,408
6
$85,603
FILES CLOSED FOR INCOMPLETENESS
0
$0
8
$77,766
27
$115,525
0
$0
0
$0
Aggregated Statistics For Year 2000 (Based on 2 full and 2 partial tracts)
A) FHA, FSA/RHS & VA Home Purchase Loans
B) Conventional Home Purchase Loans
C) Refinancings
D) Home Improvement Loans
F) Non-occupant Loans on < 5 Family Dwellings (A B C & D)
Number
Average Value
Number
Average Value
Number
Average Value
Number
Average Value
Number
Average Value
LOANS ORIGINATED
139
$92,141
457
$108,322
214
$94,640
69
$20,501
24
$77,969
APPLICATIONS APPROVED, NOT ACCEPTED
8
$53,425
66
$75,968
50
$72,505
18
$13,027
2
$56,345
APPLICATIONS DENIED
26
$76,015
181
$53,922
192
$80,576
29
$26,892
9
$56,478
APPLICATIONS WITHDRAWN
11
$112,849
24
$82,690
83
$86,017
10
$31,891
0
$0
FILES CLOSED FOR INCOMPLETENESS
2
$72,780
7
$125,077
16
$109,322
0
$0
0
$0
Aggregated Statistics For Year 1999 (Based on 1 full and 1 partial tracts)
A) FHA, FSA/RHS & VA Home Purchase Loans
B) Conventional Home Purchase Loans
C) Refinancings
D) Home Improvement Loans
F) Non-occupant Loans on < 5 Family Dwellings (A B C & D)
Detailed PMIC statistics for the following Tracts:0059.01
, 0059.02
2002 - 2018 National Fire Incident Reporting System (NFIRS) incidents
According to the data from the years 2002 - 2018 the average number of fires per year is 28. The highest number of reported fires - 51 took place in 2012, and the least - 13 in 2017. The data has a constant trend.
When looking into fire subcategories, the most reports belonged to: Outside Fires (40.1%), and Structure Fires (30.9%).
Fire incident types reported to NFIRS in Zip Code 37932
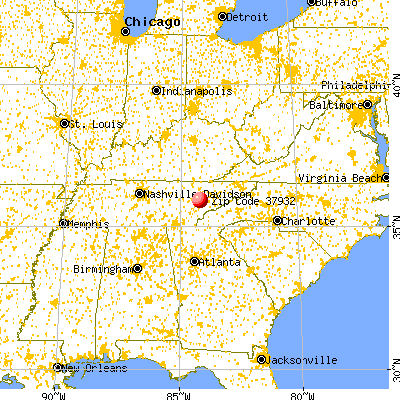


 Nearest zip codes: 37934, 37931, 37830, 37922, 37923, 37772.
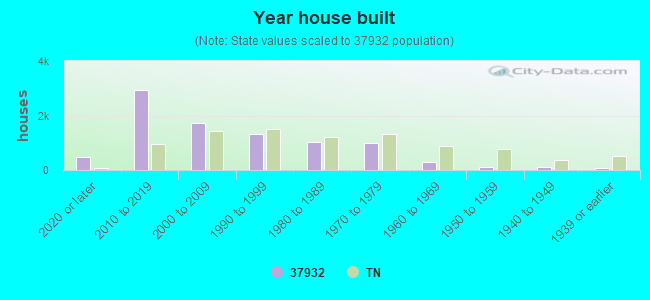


 According to the data from the years 2002 - 2018 the average number of fires per year is 28. The highest number of reported fires - 51 took place in 2012, and the least - 13 in 2017. The data has a constant trend.
 When looking into fire subcategories, the most reports belonged to: Outside Fires (40.1%), and Structure Fires (30.9%).