Estimated zip code population in 2022: 17,178 Zip code population in 2010: 15,168 Zip code population in 2000: 13,130
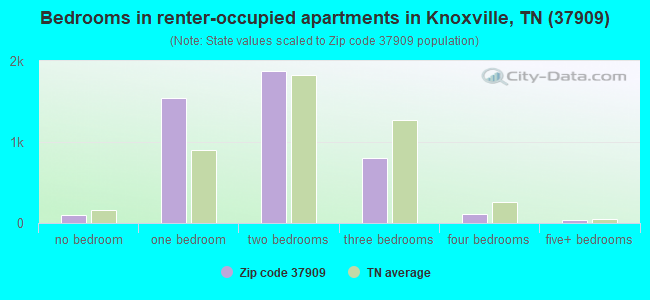
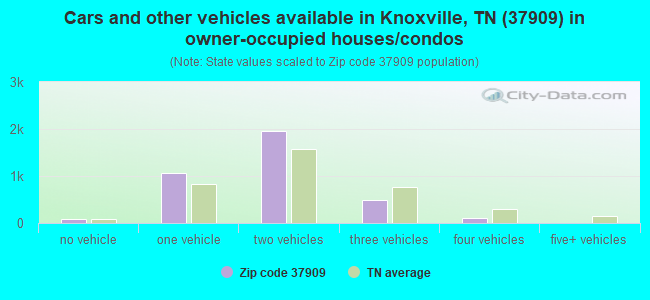
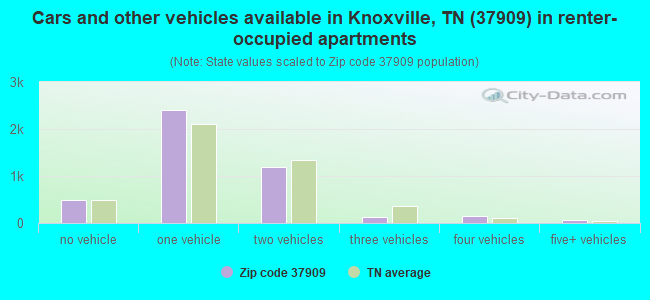
Houses and condos: 8,310 Renter-occupied apartments: 4,433
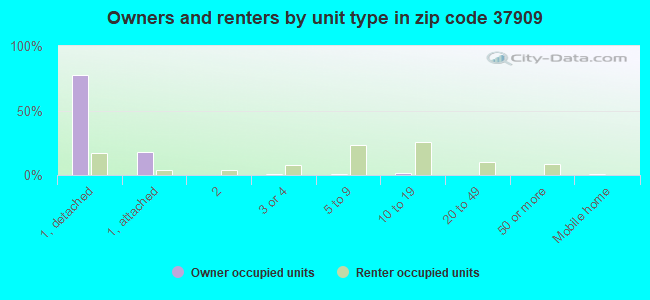
% of renters here:
55%
State:
33%
March 2022 cost of living index in zip code 37909: 87.5 (less than average, U.S. average is 100)
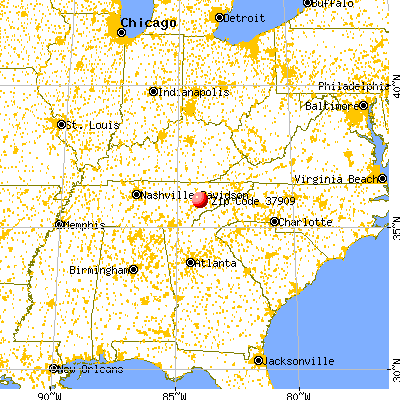
Land area: 7.0 sq. mi. Water area: 0.0 sq. mi.
Population density: 2,455 people per square mile
(low).
OSM Map
General Map
Google Map
MSN Map
OSM Map
General Map
Google Map
MSN Map
OSM Map
General Map
Google Map
MSN Map
OSM Map
General Map
Google Map
MSN Map
Please wait while loading the map...
Real estate property taxes paid for housing units in 2022:
This zip code:
0.7% ($2,110)
Tennessee:
0.5% ($1,376)
Median real estate property taxes paid for housing units with mortgages in 2022: $2,094 (0.7%) Median real estate property taxes paid for housing units with no mortgage in 2022: $2,159 (0.8%)
Estimated median house/condo value in 2022: $300,016
37909:
$300,016
Tennessee:
$284,800
According to our research of Tennessee and other state lists, there were 7 registered sex offenders living in 37909 zip code as of May 11, 2024. The ratio of all residents to sex offenders in zip code 37909 is 2,228 to 1. The ratio of registered sex offenders to all residents in this zip code is much lower than the state average.
Median resident age:
This zip code:
36.0 years
Tennessee median age:
39.2 years
Average household size:
This zip code:
2.1 people
Tennessee:
2.4 people
Averages for the 2020 tax year for zip code 37909, filed in 2021:
Average Adjusted Gross Income (AGI) in 2020: $61,699 (Individual Income Tax Returns)
Here:
$61,699
State:
$69,014
Salary/wage: $50,477 (reported on 82.2% of returns)
Here:
$50,477
State:
$55,872
(% of AGI for various income ranges: 1266.2% for AGIs below $25k, 3733.1% for AGIs $25k-50k, 6300.3% for AGIs $50k-75k, 9669.2% for AGIs $75k-100k, 16685.9% for AGIs $100k-200k, 70683.8% for AGIs over 200k)
Taxable interest for individuals: $1,649 (reported on 28.3% of returns)
This zip code:
$1,649
Tennessee:
$1,945
(% of AGI for various income ranges: 12.0% for AGIs below $25k, 17.5% for AGIs $25k-50k, 59.6% for AGIs $50k-75k, 94.2% for AGIs $75k-100k, 140.2% for AGIs $100k-200k, 1916.3% for AGIs over 200k)
Ordinary dividends: $7,353 (reported on 18.9% of returns)
Here:
$7,353
State:
$8,105
(% of AGI for various income ranges: 21.6% for AGIs below $25k, 32.9% for AGIs $25k-50k, 133.6% for AGIs $50k-75k, 263.5% for AGIs $75k-100k, 470.2% for AGIs $100k-200k, 6702.5% for AGIs over 200k)
Net capital gain/loss in AGI: +$18,372 (reported on 17.3% of returns)
Here:
+$18,372
State:
+$33,664
(% of AGI for various income ranges: 14.8% for AGIs below $25k, 23.3% for AGIs $25k-50k, 87.2% for AGIs $50k-75k, 341.8% for AGIs $75k-100k, 693.1% for AGIs $100k-200k, 23321.2% for AGIs over 200k)
Profit/loss from business: +$18,246 (reported on 15.5% of returns)
Here:
+$18,246
State:
+$18,991
(% of AGI for various income ranges: 132.4% for AGIs below $25k, 145.6% for AGIs $25k-50k, 342.4% for AGIs $50k-75k, 455.0% for AGIs $75k-100k, 794.4% for AGIs $100k-200k, 10355.0% for AGIs over 200k)
Taxable individual retirement arrangement distribution: $19,176 (reported on 8.6% of returns)
37909:
$19,176
Tennessee:
$20,036
(% of AGI for various income ranges: 47.9% for AGIs below $25k, 71.9% for AGIs $25k-50k, 228.6% for AGIs $50k-75k, 383.8% for AGIs $75k-100k, 790.4% for AGIs $100k-200k, 3965.0% for AGIs over 200k)
Self-employed (Keogh) retirement plans: $23,925 (reported on 0.5% of returns)
37909:
$23,925
Tennessee:
$28,955
(% of AGI for various income ranges: 1196.2% for AGIs over 200k)
Total itemized deductions: $47,574 (reported on 4.4% of returns)
Here:
$47,574
State:
$40,136
(% of AGI for various income ranges: 35.5% for AGIs below $25k, 57.9% for AGIs $25k-50k, 151.1% for AGIs $50k-75k, 307.8% for AGIs $75k-100k, 672.6% for AGIs $100k-200k, 11037.5% for AGIs over 200k)
Charity contributions: $20,614 (reported on 3.7% of returns)
Here:
$20,614
State:
$19,852
(% of AGI for various income ranges: 8.7% for AGIs $25k-50k, 25.4% for AGIs $50k-75k, 93.0% for AGIs $75k-100k, 283.9% for AGIs $100k-200k, 4648.8% for AGIs over 200k)
Taxes paid: $5,112 (reported on 4.3% of returns)
37909:
$5,112
State:
$6,038
(% of AGI for various income ranges: 2.5% for AGIs below $25k, 7.2% for AGIs $25k-50k, 17.4% for AGIs $50k-75k, 34.5% for AGIs $75k-100k, 97.6% for AGIs $100k-200k, 946.2% for AGIs over 200k)
Earned income credit: $2,157 (reported on 14.4% of returns)
Here:
$2,157
State:
$2,391
(% of AGI for various income ranges: 75.0% for AGIs below $25k, 48.5% for AGIs $25k-50k)
Percentage of individuals using paid preparers for their 2020 taxes: 92.2%
Here:
92%
State:
93%
(% for various income ranges: 91.8% for AGIs below $25k, 93.5% for AGIs $25k-50k, 91.5% for AGIs $50k-75k, 91.9% for AGIs $75k-100k, 90.3% for AGIs $100k-200k, 93.8% for AGIs over 200k)
Averages for the 2012 tax year for zip code 37909, filed in 2013:
Average Adjusted Gross Income (AGI) in 2012: $49,771 (Individual Income Tax Returns)
Here:
$49,771
State:
$53,767
Salary/wage: $42,584 (reported on 83.7% of returns)
Here:
$42,584
State:
$45,421
(% of AGI for various income ranges: 83.3% for AGIs below $25k, 82.1% for AGIs $25k-50k, 74.2% for AGIs $50k-75k, 75.7% for AGIs $75k-100k, 68.6% for AGIs $100k-200k, 51.1% for AGIs over 200k)
Taxable interest for individuals: $1,600 (reported on 29.8% of returns)
This zip code:
$1,600
Tennessee:
$1,732
(% of AGI for various income ranges: 0.9% for AGIs below $25k, 0.6% for AGIs $25k-50k, 1.1% for AGIs $50k-75k, 0.7% for AGIs $75k-100k, 0.9% for AGIs $100k-200k, 1.4% for AGIs over 200k)
Ordinary dividends: $5,628 (reported on 19.5% of returns)
Here:
$5,628
State:
$6,739
(% of AGI for various income ranges: 1.7% for AGIs below $25k, 1.2% for AGIs $25k-50k, 1.8% for AGIs $50k-75k, 1.7% for AGIs $75k-100k, 2.7% for AGIs $100k-200k, 3.5% for AGIs over 200k)
Net capital gain/loss in AGI: +$6,542 (reported on 15.3% of returns)
Here:
+$6,542
State:
+$19,082
(% of AGI for various income ranges: 0.5% for AGIs $25k-50k, 0.5% for AGIs $50k-75k, 1.0% for AGIs $75k-100k, 2.2% for AGIs $100k-200k, 7.1% for AGIs over 200k)
Profit/loss from business: +$16,506 (reported on 13.9% of returns)
Here:
+$16,506
State:
+$15,240
(% of AGI for various income ranges: 7.0% for AGIs below $25k, 2.9% for AGIs $25k-50k, 3.8% for AGIs $50k-75k, 2.7% for AGIs $75k-100k, 4.3% for AGIs $100k-200k, 7.6% for AGIs over 200k)
Taxable individual retirement arrangement distribution: $13,708 (reported on 10.1% of returns)
37909:
$13,708
Tennessee:
$15,505
(% of AGI for various income ranges: 1.9% for AGIs below $25k, 2.1% for AGIs $25k-50k, 3.4% for AGIs $50k-75k, 2.5% for AGIs $75k-100k, 3.2% for AGIs $100k-200k, 3.1% for AGIs over 200k)
Self-employment retirement plans: $16,520 (reported on 0.7% of returns)
37909:
$16,520
Tennessee:
$22,567
Total itemized deductions: $19,235 (20% of AGI, reported on 24.1% of returns)
Here:
$19,235
State:
$21,976
Here:
19.6% of AGI
State:
17.8% of AGI
(% of AGI for various income ranges: 7.5% for AGIs below $25k, 7.7% for AGIs $25k-50k, 10.8% for AGIs $50k-75k, 9.9% for AGIs $75k-100k, 10.2% for AGIs $100k-200k, 9.3% for AGIs over 200k)
Charity contributions: $5,802 (reported on 19.6% of returns)
Here:
$5,802
State:
$6,709
(% of AGI for various income ranges: 0.6% for AGIs below $25k, 1.1% for AGIs $25k-50k, 2.0% for AGIs $50k-75k, 2.4% for AGIs $75k-100k, 2.9% for AGIs $100k-200k, 4.0% for AGIs over 200k)
Taxes paid: $4,310 (reported on 23.7% of returns)
37909:
$4,310
State:
$4,829
(% of AGI for various income ranges: 1.2% for AGIs below $25k, 1.4% for AGIs $25k-50k, 2.3% for AGIs $50k-75k, 2.3% for AGIs $75k-100k, 2.5% for AGIs $100k-200k, 2.2% for AGIs over 200k)
Earned income credit: $2,073 (reported on 16.9% of returns)
Here:
$2,073
State:
$2,404
(% of AGI for various income ranges: 5.2% for AGIs below $25k, 0.7% for AGIs $25k-50k)
Percentage of individuals using paid preparers for their 2012 taxes: 41.3%
Here:
41%
State:
52%
(% for various income ranges: 38.3% for AGIs below $25k, 38.5% for AGIs $25k-50k, 43.7% for AGIs $50k-75k, 43.6% for AGIs $75k-100k, 50.0% for AGIs $100k-200k, 75.0% for AGIs over 200k)
Averages for the 2004 tax year for zip code 37909, filed in 2005:
Average Adjusted Gross Income (AGI) in 2004: $42,872 (Individual Income Tax Returns)
Here:
$42,872
State:
$44,088
Salary/wage: $36,410 (reported on 83.7% of returns)
Here:
$36,410
State:
$38,825
(% of AGI for various income ranges: 109.0% for AGIs below $10k, 81.8% for AGIs $10k-25k, 83.2% for AGIs $25k-50k, 72.7% for AGIs $50k-75k, 71.1% for AGIs $75k-100k, 57.3% for AGIs over 100k)
Taxable interest for individuals: $1,970 (reported on 40.5% of returns)
This zip code:
$1,970
Tennessee:
$1,802
(% of AGI for various income ranges: 6.6% for AGIs below $10k, 1.9% for AGIs $10k-25k, 1.6% for AGIs $25k-50k, 2.1% for AGIs $50k-75k, 1.5% for AGIs $75k-100k, 1.8% for AGIs over 100k)
Taxable dividends: $4,040 (reported on 24.8% of returns)
Here:
$4,040
State:
$3,727
(% of AGI for various income ranges: 5.0% for AGIs below $10k, 1.8% for AGIs $10k-25k, 1.5% for AGIs $25k-50k, 2.2% for AGIs $50k-75k, 2.0% for AGIs $75k-100k, 3.1% for AGIs over 100k)
Net capital gain/loss: +$7,749 (reported on 20.3% of returns)
Here:
+$7,749
State:
+$15,776
(% of AGI for various income ranges: -3.6% for AGIs below $10k, 0.2% for AGIs $10k-25k, 0.4% for AGIs $25k-50k, 1.3% for AGIs $50k-75k, 2.0% for AGIs $75k-100k, 9.1% for AGIs over 100k)
Profit/loss from business: +$16,992 (reported on 12.2% of returns)
Here:
+$16,992
State:
+$12,882
(% of AGI for various income ranges: -12.2% for AGIs below $10k, 4.1% for AGIs $10k-25k, 2.5% for AGIs $25k-50k, 3.0% for AGIs $50k-75k, 4.0% for AGIs $75k-100k, 8.7% for AGIs over 100k)
IRA payment deduction: $2,714 (reported on 1.8% of returns)
37909:
$2,714
Tennessee:
$2,934
(% of AGI for various income ranges: 0.2% for AGIs $10k-25k, 0.1% for AGIs $25k-50k, 0.1% for AGIs $50k-75k, 0.2% for AGIs $75k-100k, 0.1% for AGIs over 100k)
Self-employed pension: $16,460 (reported on 1.0% of returns)
Here:
$16,460
Tennessee:
$16,857
Total itemized deductions: $16,821 (21% of AGI, reported on 28.8% of returns)
Here:
$16,821
State:
$18,035
Here:
21.1% of AGI
State:
19.9% of AGI
(% of AGI for various income ranges: 13.9% for AGIs below $10k, 8.4% for AGIs $10k-25k, 10.6% for AGIs $25k-50k, 13.6% for AGIs $50k-75k, 13.8% for AGIs $75k-100k, 10.4% for AGIs over 100k)
Charity contributions deductions: $4,863 (6% of AGI, reported on 25.3% of returns)
Here:
$4,863
State:
$5,167
Here:
5.8% of AGI
State:
5.3% of AGI
(% of AGI for various income ranges: 0.8% for AGIs below $10k, 1.2% for AGIs $10k-25k, 1.6% for AGIs $25k-50k, 3.1% for AGIs $50k-75k, 3.4% for AGIs $75k-100k, 4.0% for AGIs over 100k)
Total tax: $6,709 (reported on 78.0% of returns)
37909:
$6,709
State:
$7,482
(% of AGI for various income ranges: 2.9% for AGIs below $10k, 4.6% for AGIs $10k-25k, 7.9% for AGIs $25k-50k, 10.0% for AGIs $50k-75k, 11.7% for AGIs $75k-100k, 19.1% for AGIs over 100k)
Earned income credit: $1,649 (reported on 13.0% of returns)
Here:
$1,649
State:
$1,826
Percentage of individuals using paid preparers for their 2004 taxes: 48.8%
Here:
49%
State:
60%
(% for various income ranges: 46.5% for AGIs below $10k, 49.0% for AGIs $10k-25k, 45.9% for AGIs $25k-50k, 50.5% for AGIs $50k-75k, 52.9% for AGIs $75k-100k, 56.6% for AGIs over 100k)
Likely homosexual households (counted as self-reported same-sex unmarried-partner households)
Lesbian couples: 0.0% of all households
Gay men: 0.1% of all households
Household received Food Stamps/SNAP in the past 12 months: 525 Household did not receive Food Stamps/SNAP in the past 12 months: 7,632
Women who had a birth in the past 12 months: 268 (218 now married, 52 unmarried) Women who did not have a birth in the past 12 months: 4,448 (1,661 now married, 2,786 unmarried)
Housing units in zip code 37909 with a mortgage: 2,343 (190 second mortgage, 70 home equity loan, 135 both second mortgage and home equity loan) Median monthly owner costs for units with a mortgage: $1,565 Median monthly owner costs for units without a mortgage: $545
Residents with income below the poverty level in 2022:
This zip code:
10.3%
Whole state:
13.3%
Residents with income below 50% of the poverty level in 2022:
This zip code:
5.0%
Whole state:
7.1%
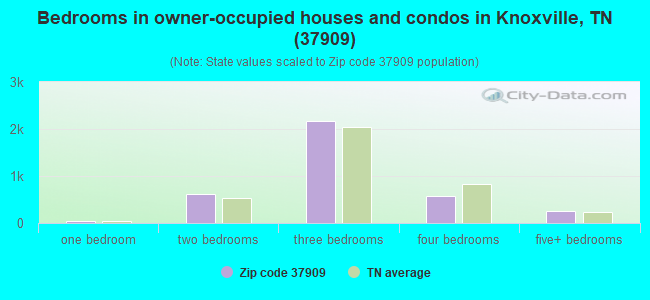
Median number of rooms in houses and condos:
Here:
6.5
State:
6.5
Median number of rooms in apartments:
Here:
4.1
State:
4.4
Notable locations in this zip code not listed on our city pages
Notable locations in zip code 37909: Middlebrook Industrial Park (A), West Side YMCA (B), Knoxville Fire Department Station 20 (C). Display/hide their locations on the map
Churches in zip code 37909 include: Faith Church (A), Central Church of God (B), Churhc of the Savior (C), First Church of the Nazarene (D), West Hills Presbyterian Church (E), West Hills Church (F), West End Church (G), Calvary Church (H), Middlebrook Pike Church (I). Display/hide their locations on the map
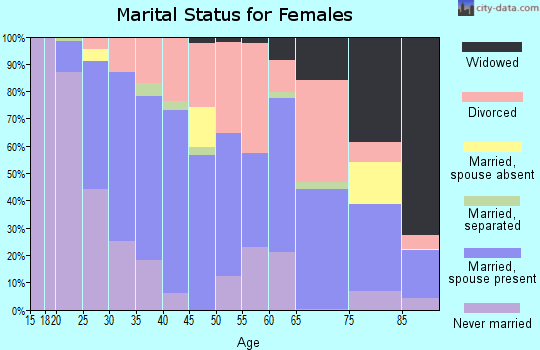
1,614 married couples with children.
1,031 single-parent households (119 men, 912 women).
91.9% of residents of 37909 zip code speak English at home.
2.6% of residents speak Spanish at home (53% very well, 29% well, 19% not well).
1.1% of residents speak other Indo-European language at home (90% very well, 2% well, 3% not well, 5% not at all).
2.6% of residents speak Asian or Pacific Island language at home (34% very well, 51% well, 15% not well).
2.0% of residents speak other language at home (73% very well, 3% well, 21% not well, 3% not at all).
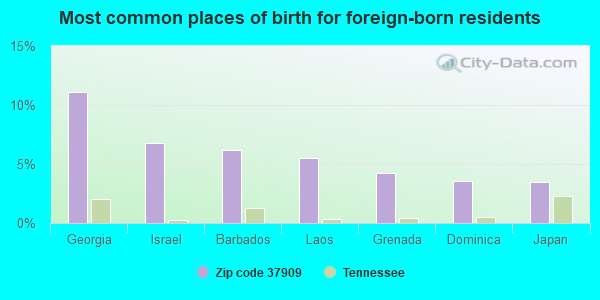
Foreign born population: 1,389 (8.1%) (43.2% of them are naturalized citizens)
Facilities with environmental interests located in this zip code:
BLUE RIDGE PRINTING COMPANY INC (1485 AMHERST ROAD in KNOXVILLE, TN)
Conditionally Exempt Small Quantity Generators, less than 100 kg/month of hazardous waste (Resource Conservation and Recovery Act (tracking hazardous waste)) - notification Business NAICS classification: QUICK PRINTING. Organizations: STEPHEN L SIMPSON (CONTACT/OPERATOR)
, CHAMPION INDUSTRIES INC (CONTACT/OWNER)
Housing units lacking complete kitchen facilities: 3.3%
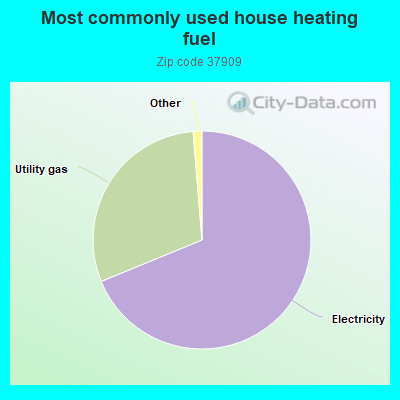
68.8%Electricity
29.9%Utility gas
Population in 1990: 13,265.
Place of birth for U.S.-born residents:
This state: 8,421
Northeast: 726
Midwest: 1,532
South: 3,899
West: 1,132
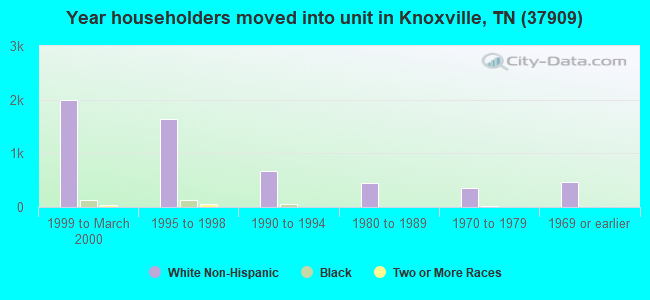
37% of the 37909 zip code residents lived in the same house 5 years ago. Out of people who lived in different houses, 52% lived in this county. Out of people who lived in different counties, 50% lived in Tennessee.
85% of the 37909 zip code residents lived in the same house 1 year ago. Out of people who lived in different houses, 61% moved from this county. Out of people who lived in different houses, 18% moved from different county within same state. Out of people who lived in different houses, 14% moved from different state. Out of people who lived in different houses, 2% moved from abroad.
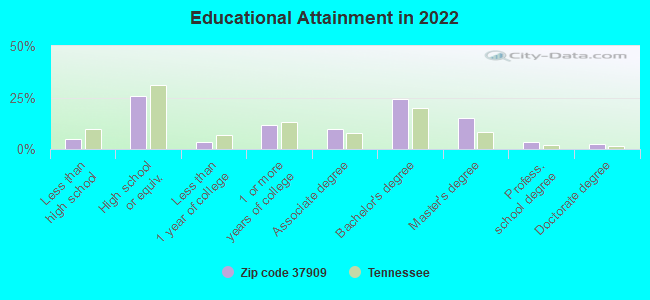
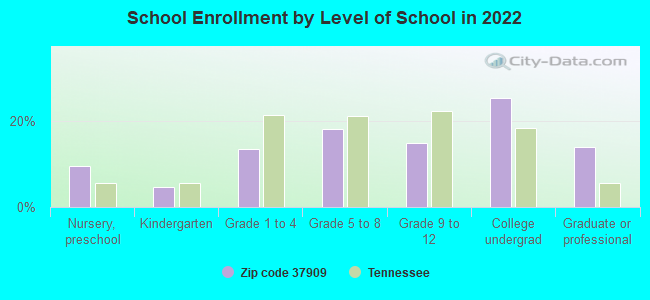
Private vs. public school enrollment:
Students in private schools in grades 1 to 8 (elementary and middle school): 266
Here:
25.1%
Tennessee:
15.0%
Students in private schools in grades 9 to 12 (high school): 107
Here:
21.8%
Tennessee:
16.2%
Students in private undergraduate colleges: 92
Here:
11.0%
Tennessee:
23.5%
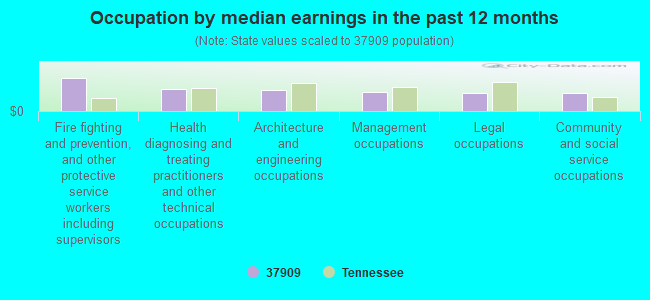
Occupation by median earnings in the past 12 months ($)
127,680Fire fighting and prevention, and other protective service workers including supervisors
83,854Health diagnosing and treating practitioners and other technical occupations
79,686Architecture and engineering occupations
72,363Management occupations
69,128Legal occupations
68,705Community and social service occupations
Companies with federal contracts located in this zip code (KNOXVILLE, TN):
INTERCONTINENTAL HOTELS GROUP (1315 KIRBY RD; small business) : $38,114 in 9 contractsfrom 2004 to 2006
Contracts for Lodging - Hotel/Motel, Purchase of Structures and Facilities -- Troop Housing Facilities, Condiments and Related Products by Army, Navy Signed by year:2000: $0; 2001: $0; 2002: $0; 2003: $0; 2004: $31,090; 2005: $3,850; 2006: $3,174.
Biggest contracts:
$15,405 with Army for Lodging - Hotel/Motel. Signed on 2004-10-28. Completion date: 2004-10-22.
$6,580, same as above.Signed on 2004-08-26. Completion date: 2004-08-25.
$3,850 with Navy for Purchase of Structures and Facilities -- Troop Housing Facilities. Signed on 2005-04-01. Completion date: 2005-04-14.
$3,755 with Army for Lodging - Hotel/Motel. Signed on 2004-03-31. Completion date: 2004-05-25.
RIS CORP (5905 WEISBROOK LANE, SUITE; small business) : $28,253 in 4 contractsfrom 2002 to 2004
$11,008 with Army for Engineering and Technical Services. Signed on 2002-09-30. Completion date: 2002-12-31.
$7,800 with Army for Other Environmental Services, Studies, and Analytical Support. Taking place in NC. Signed on 2004-05-24. Completion date: 2005-05-24.
$4,960 with Army for Road Clearing, Cleaning and Marking Equipment. Signed on 2003-06-19. Completion date: 2003-07-15.
$4,485 with Army for Communication Training Devices. Taking place in IL. Signed on 2004-09-22. Completion date: 2004-09-24.
M A JONES INC (3939 PAPERMILL RD; small business)
$26,000 with Tennessee Valley Authority for Air Conditioning Equipment. Signed on 2000-07-15. Completion date: 2000-07-15.
RAY, DARYLL (6621 NIGHTINGALE LANE; small business)
$12,000 with U.S. Army Corps of Engineers - civil program financing only for Economic Studies. Signed on 2002-09-23. Completion date: 2002-10-15.
ROYAL BRASS INC (1470 AMHERST; small business)
$6,379 with Air Force for Maintenance, Repair and Rebuilding of Equipment -- Ground Effect Vehicles, Motor Vehicles, Trailers, and Cycles. Taking place in AR. Signed on 2005-08-31. Completion date: 2005-09-13.
BRISTOL HOTEL COMPANY (1315 KIRBY ROAD) : $6,050 in 2 contractsfrom 2004 to 2005
$3,250 with Navy for Lease or Rental of Facilities -- Troop Housing Facilities. Signed on 2004-10-01. Completion date: 2004-10-03.
$2,800, same as above.Signed on 2005-01-07. Completion date: 2005-01-10.
CARRIER SALES AND DISTRIBUTION (5900 WEISBROOK LANE; small business)
$5,995 with Army for Compressors and Vacuum Pumps. Signed on 2006-05-17. Completion date: 2006-05-31.
Top industries in this zip code by the number of employees in 2005:
Health Care and Social Assistance: Offices of Physicians (except Mental Health Specialists) (100-249 employees: 1 establishment, 50-99 employees: 4 establishments, 20-49 employees: 5 establishments, 10-19 employees: 8 establishments, 5-9 employees: 3 establishments, 1-4 employees: 8 establishments)
Management of Companies and Enterprises: Corporate, Subsidiary, and Regional Managing Offices (100-249: 2, 50-99: 1, 5-9: 1, 1-4: 2)
Health Care and Social Assistance: Continuing Care Retirement Communities (250-499: 1)
Health Care and Social Assistance: Home Health Care Services (100-249: 1, 50-99: 2)
Other Services (except Public Administration): Religious Organizations (50-99: 2, 20-49: 2, 5-9: 3, 1-4: 5)
Administrative and Support and Waste Management and Remediation Services: Temporary Help Services (100-249: 1, 20-49: 1, 5-9: 1, 1-4: 1)
Information: Directory and Mailing List Publishers (50-99: 2)
People in group quarters in 2010:
275 people in nursing facilities/skilled-nursing facilities
52 people in group homes for juveniles (non-correctional)
33 people in group homes intended for adults
27 people in emergency and transitional shelters (with sleeping facilities) for people experiencing homelessness
People in group quarters in 2000:
612 people in nursing homes
129 people in residential treatment centers for emotionally disturbed children
24 people in other noninstitutional group quarters
21 people in homes for the mentally retarded
8 people in homes for abused, dependent, and neglected children
Fatal accident statistics in 2014:
Fatal accident count: 2
Vehicles involved in fatal accidents: 2
Fatal accidents caused by drunken drivers: 0
Fatalities: 2
Persons involved in fatal accidents: 2
Pedestrians involved in fatal accidents: 0
Fatal accident statistics in 2013:
Fatal accident count: 1
Vehicles involved in fatal accidents: 1
Fatal accidents caused by drunken drivers: 0
Fatalities: 1
Persons involved in fatal accidents: 2
Pedestrians involved in fatal accidents: 0
Home Mortgage Disclosure Act Aggregated Statistics For Year 2009 (Based on 8 partial tracts)
A) FHA, FSA/RHS & VA Home Purchase Loans
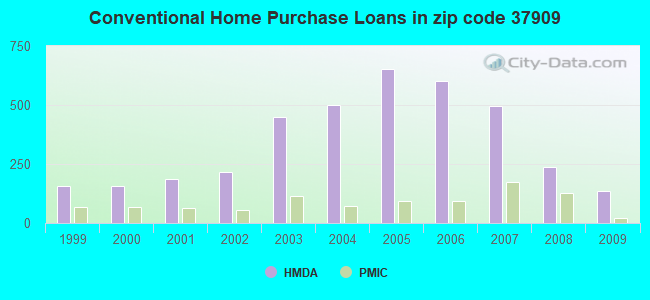
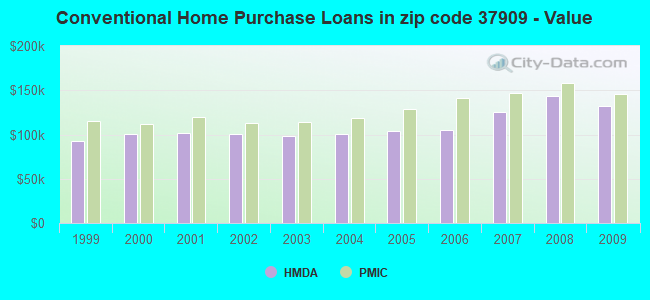
B) Conventional Home Purchase Loans
C) Refinancings
D) Home Improvement Loans
E) Loans on Dwellings For 5+ Families
F) Non-occupant Loans on < 5 Family Dwellings (A B C & D)
G) Loans On Manufactured Home Dwelling (A B C & D)
Number
Average Value
Number
Average Value
Number
Average Value
Number
Average Value
Number
Average Value
Number
Average Value
Number
Average Value
LOANS ORIGINATED
147
$141,004
135
$132,206
558
$140,168
28
$47,189
1
$2,726,400
52
$114,611
4
$56,552
APPLICATIONS APPROVED, NOT ACCEPTED
11
$143,377
11
$117,094
41
$137,601
2
$69,730
0
$0
7
$103,911
0
$0
APPLICATIONS DENIED
10
$133,385
19
$100,637
128
$141,283
20
$30,141
0
$0
4
$125,288
1
$51,120
APPLICATIONS WITHDRAWN
15
$156,493
12
$136,229
119
$145,444
2
$21,600
0
$0
4
$78,352
0
$0
FILES CLOSED FOR INCOMPLETENESS
3
$149,920
3
$129,327
41
$158,589
3
$109,437
0
$0
1
$114,170
0
$0
Aggregated Statistics For Year 2008 (Based on 8 partial tracts)
A) FHA, FSA/RHS & VA Home Purchase Loans
B) Conventional Home Purchase Loans
C) Refinancings
D) Home Improvement Loans
E) Loans on Dwellings For 5+ Families
F) Non-occupant Loans on < 5 Family Dwellings (A B C & D)
G) Loans On Manufactured Home Dwelling (A B C & D)
Number
Average Value
Number
Average Value
Number
Average Value
Number
Average Value
Number
Average Value
Number
Average Value
Number
Average Value
LOANS ORIGINATED
125
$142,915
238
$143,329
304
$132,866
40
$45,962
5
$7,289,630
73
$124,253
3
$48,507
APPLICATIONS APPROVED, NOT ACCEPTED
5
$123,458
16
$161,232
45
$142,121
12
$60,194
0
$0
4
$100,102
1
$5,600
APPLICATIONS DENIED
13
$108,628
26
$124,783
178
$131,691
26
$69,907
1
$639,000
8
$91,855
3
$63,757
APPLICATIONS WITHDRAWN
14
$129,911
30
$162,373
78
$141,251
5
$69,684
0
$0
5
$114,458
0
$0
FILES CLOSED FOR INCOMPLETENESS
3
$101,003
5
$149,890
26
$125,534
0
$0
0
$0
2
$91,590
0
$0
Aggregated Statistics For Year 2007 (Based on 8 partial tracts)
A) FHA, FSA/RHS & VA Home Purchase Loans
B) Conventional Home Purchase Loans
C) Refinancings
D) Home Improvement Loans
E) Loans on Dwellings For 5+ Families
F) Non-occupant Loans on < 5 Family Dwellings (A B C & D)
G) Loans On Manufactured Home Dwelling (A B C & D)
Number
Average Value
Number
Average Value
Number
Average Value
Number
Average Value
Number
Average Value
Number
Average Value
Number
Average Value
LOANS ORIGINATED
46
$140,751
494
$125,535
332
$130,465
57
$42,256
3
$4,323,920
82
$124,660
4
$42,465
APPLICATIONS APPROVED, NOT ACCEPTED
0
$0
38
$122,118
50
$109,015
7
$38,316
0
$0
4
$82,045
1
$26,410
APPLICATIONS DENIED
5
$128,908
72
$117,679
197
$116,056
54
$72,564
0
$0
10
$91,826
6
$37,420
APPLICATIONS WITHDRAWN
3
$129,880
37
$138,560
101
$118,320
10
$73,809
0
$0
6
$97,457
0
$0
FILES CLOSED FOR INCOMPLETENESS
0
$0
17
$140,247
40
$135,586
3
$22,640
0
$0
1
$135,840
0
$0
Aggregated Statistics For Year 2006 (Based on 8 partial tracts)
A) FHA, FSA/RHS & VA Home Purchase Loans
B) Conventional Home Purchase Loans
C) Refinancings
D) Home Improvement Loans
E) Loans on Dwellings For 5+ Families
F) Non-occupant Loans on < 5 Family Dwellings (A B C & D)
G) Loans On Manufactured Home Dwelling (A B C & D)
Number
Average Value
Number
Average Value
Number
Average Value
Number
Average Value
Number
Average Value
Number
Average Value
Number
Average Value
LOANS ORIGINATED
66
$137,929
600
$105,507
334
$108,690
40
$44,908
3
$9,327,903
111
$101,023
13
$66,128
APPLICATIONS APPROVED, NOT ACCEPTED
6
$119,285
83
$80,338
63
$92,382
11
$40,779
0
$0
14
$80,319
13
$33,718
APPLICATIONS DENIED
7
$72,936
130
$86,115
222
$130,060
44
$50,243
0
$0
48
$53,715
43
$46,406
APPLICATIONS WITHDRAWN
3
$146,117
43
$110,529
136
$120,535
15
$62,629
0
$0
11
$107,021
0
$0
FILES CLOSED FOR INCOMPLETENESS
1
$47,570
19
$122,858
46
$102,840
3
$32,537
0
$0
1
$133,390
0
$0
Aggregated Statistics For Year 2005 (Based on 8 partial tracts)
A) FHA, FSA/RHS & VA Home Purchase Loans
B) Conventional Home Purchase Loans
C) Refinancings
D) Home Improvement Loans
E) Loans on Dwellings For 5+ Families
F) Non-occupant Loans on < 5 Family Dwellings (A B C & D)
G) Loans On Manufactured Home Dwelling (A B C & D)
Number
Average Value
Number
Average Value
Number
Average Value
Number
Average Value
Number
Average Value
Number
Average Value
Number
Average Value
LOANS ORIGINATED
61
$117,806
654
$103,732
414
$103,191
69
$49,932
2
$7,077,595
102
$94,662
6
$83,548
APPLICATIONS APPROVED, NOT ACCEPTED
7
$103,449
86
$72,920
80
$107,464
8
$28,488
0
$0
8
$78,154
20
$33,362
APPLICATIONS DENIED
4
$120,750
132
$81,307
233
$111,467
49
$31,603
1
$1,870
13
$73,890
31
$45,428
APPLICATIONS WITHDRAWN
3
$124,953
71
$95,574
212
$117,188
20
$79,956
0
$0
9
$92,641
1
$55,040
FILES CLOSED FOR INCOMPLETENESS
0
$0
17
$95,478
32
$135,097
2
$81,620
0
$0
1
$92,180
0
$0
Aggregated Statistics For Year 2004 (Based on 8 partial tracts)
A) FHA, FSA/RHS & VA Home Purchase Loans
B) Conventional Home Purchase Loans
C) Refinancings
D) Home Improvement Loans
E) Loans on Dwellings For 5+ Families
F) Non-occupant Loans on < 5 Family Dwellings (A B C & D)
G) Loans On Manufactured Home Dwelling (A B C & D)
Number
Average Value
Number
Average Value
Number
Average Value
Number
Average Value
Number
Average Value
Number
Average Value
Number
Average Value
LOANS ORIGINATED
70
$106,246
501
$100,068
481
$103,873
57
$41,031
2
$43,808,020
83
$121,473
10
$30,029
APPLICATIONS APPROVED, NOT ACCEPTED
3
$92,237
73
$84,763
79
$86,339
10
$84,356
0
$0
8
$84,882
19
$53,082
APPLICATIONS DENIED
9
$86,869
132
$72,481
240
$102,312
39
$63,254
0
$0
16
$78,874
62
$47,254
APPLICATIONS WITHDRAWN
11
$91,576
42
$104,310
212
$105,001
10
$65,807
0
$0
5
$88,458
5
$80,760
FILES CLOSED FOR INCOMPLETENESS
0
$0
5
$86,372
18
$129,363
2
$20,990
0
$0
1
$93,280
0
$0
Aggregated Statistics For Year 2003 (Based on 8 partial tracts)
A) FHA, FSA/RHS & VA Home Purchase Loans
B) Conventional Home Purchase Loans
C) Refinancings
D) Home Improvement Loans
E) Loans on Dwellings For 5+ Families
F) Non-occupant Loans on < 5 Family Dwellings (A B C & D)
Number
Average Value
Number
Average Value
Number
Average Value
Number
Average Value
Number
Average Value
Number
Average Value
LOANS ORIGINATED
121
$107,641
448
$97,959
989
$99,918
46
$24,423
2
$1,305,110
113
$72,730
APPLICATIONS APPROVED, NOT ACCEPTED
3
$89,770
62
$93,325
138
$97,700
5
$20,452
0
$0
19
$85,035
APPLICATIONS DENIED
5
$119,162
76
$74,871
244
$100,689
28
$26,354
0
$0
15
$87,297
APPLICATIONS WITHDRAWN
14
$101,591
47
$93,709
188
$101,610
3
$150,807
1
$2,726,400
12
$77,982
FILES CLOSED FOR INCOMPLETENESS
1
$118,470
8
$99,911
37
$107,150
3
$67,643
0
$0
4
$60,478
Aggregated Statistics For Year 2002 (Based on 6 partial tracts)
A) FHA, FSA/RHS & VA Home Purchase Loans
B) Conventional Home Purchase Loans
C) Refinancings
D) Home Improvement Loans
F) Non-occupant Loans on < 5 Family Dwellings (A B C & D)
Number
Average Value
Number
Average Value
Number
Average Value
Number
Average Value
Number
Average Value
LOANS ORIGINATED
50
$94,339
215
$100,137
326
$107,481
27
$34,139
38
$74,307
APPLICATIONS APPROVED, NOT ACCEPTED
3
$56,800
31
$62,355
50
$107,671
4
$16,140
2
$21,520
APPLICATIONS DENIED
6
$61,827
70
$53,182
131
$95,207
6
$17,600
7
$53,014
APPLICATIONS WITHDRAWN
5
$88,908
14
$98,600
59
$88,141
5
$162,722
3
$84,153
FILES CLOSED FOR INCOMPLETENESS
0
$0
5
$92,564
13
$82,756
0
$0
0
$0
Aggregated Statistics For Year 2001 (Based on 6 partial tracts)
A) FHA, FSA/RHS & VA Home Purchase Loans
B) Conventional Home Purchase Loans
C) Refinancings
D) Home Improvement Loans
E) Loans on Dwellings For 5+ Families
F) Non-occupant Loans on < 5 Family Dwellings (A B C & D)
Number
Average Value
Number
Average Value
Number
Average Value
Number
Average Value
Number
Average Value
Number
Average Value
LOANS ORIGINATED
84
$94,413
186
$101,384
271
$97,712
35
$24,691
2
$298,065
26
$63,874
APPLICATIONS APPROVED, NOT ACCEPTED
1
$63,900
29
$57,630
30
$75,307
4
$21,775
0
$0
0
$0
APPLICATIONS DENIED
1
$32,380
59
$49,432
99
$78,870
24
$12,659
0
$0
2
$58,655
APPLICATIONS WITHDRAWN
8
$91,332
20
$74,480
55
$79,269
3
$15,137
0
$0
0
$0
FILES CLOSED FOR INCOMPLETENESS
0
$0
3
$67,593
19
$117,207
0
$0
0
$0
1
$31,520
Aggregated Statistics For Year 2000 (Based on 6 partial tracts)
A) FHA, FSA/RHS & VA Home Purchase Loans
B) Conventional Home Purchase Loans
C) Refinancings
D) Home Improvement Loans
E) Loans on Dwellings For 5+ Families
F) Non-occupant Loans on < 5 Family Dwellings (A B C & D)
Number
Average Value
Number
Average Value
Number
Average Value
Number
Average Value
Number
Average Value
Number
Average Value
LOANS ORIGINATED
52
$85,578
157
$100,342
76
$83,169
28
$21,948
1
$42,600
17
$59,741
APPLICATIONS APPROVED, NOT ACCEPTED
5
$53,622
21
$54,011
23
$79,490
9
$35,111
0
$0
0
$0
APPLICATIONS DENIED
4
$103,728
57
$52,083
92
$72,249
24
$17,794
0
$0
6
$54,718
APPLICATIONS WITHDRAWN
11
$87,079
23
$98,898
36
$59,799
2
$15,865
0
$0
1
$67,750
FILES CLOSED FOR INCOMPLETENESS
2
$89,160
9
$110,014
7
$90,046
0
$0
0
$0
0
$0
Aggregated Statistics For Year 1999 (Based on 4 partial tracts)
A) FHA, FSA/RHS & VA Home Purchase Loans
B) Conventional Home Purchase Loans
C) Refinancings
D) Home Improvement Loans
F) Non-occupant Loans on < 5 Family Dwellings (A B C & D)
2002 - 2018 National Fire Incident Reporting System (NFIRS) incidents
According to the data from the years 2002 - 2018 the average number of fire incidents per year is 38. The highest number of reported fires - 67 took place in 2007, and the least - 14 in 2009. The data has a decreasing trend.
When looking into fire subcategories, the most incidents belonged to: Outside Fires (41.1%), and Structure Fires (35.9%).
Fire incident types reported to NFIRS in Zip Code 37909


 Nearest zip codes: 37921, 37919, 37923, 37912, 37916, 37902.


 According to the data from the years 2002 - 2018 the average number of fire incidents per year is 38. The highest number of reported fires - 67 took place in 2007, and the least - 14 in 2009. The data has a decreasing trend.
 When looking into fire subcategories, the most incidents belonged to: Outside Fires (41.1%), and Structure Fires (35.9%).