Estimated zip code population in 2022: 3,785 Zip code population in 2010: 3,477 Zip code population in 2000: 3,218
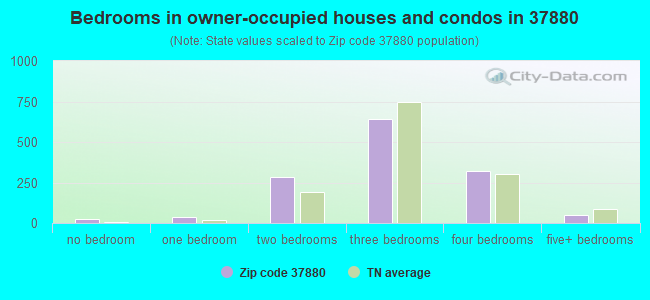
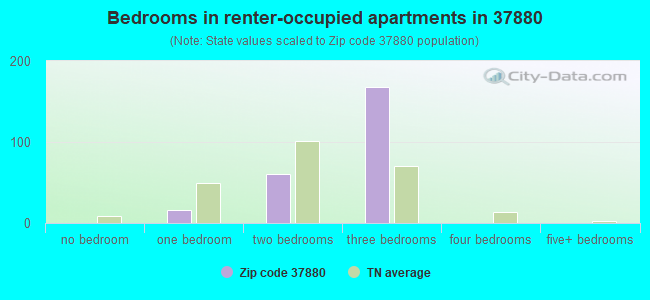
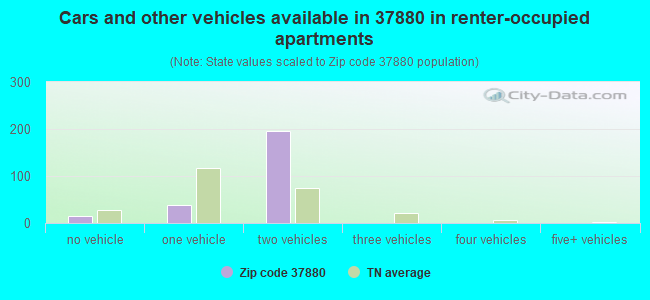
Houses and condos: 2,394 Renter-occupied apartments: 251
% of renters here:
16%
State:
33%
March 2022 cost of living index in zip code 37880: 79.9 (low, U.S. average is 100)
Land area: 71.0 sq. mi. Water area: 14.5 sq. mi.
Population density: 53 people per square mile
(very low).
OSM Map
General Map
Google Map
MSN Map
OSM Map
General Map
Google Map
MSN Map
OSM Map
General Map
Google Map
MSN Map
OSM Map
General Map
Google Map
MSN Map
Please wait while loading the map...
Real estate property taxes paid for housing units in 2022:
This zip code:
0.3% ($750)
Tennessee:
0.5% ($1,376)
Median real estate property taxes paid for housing units with mortgages in 2022: $998 (0.4%) Median real estate property taxes paid for housing units with no mortgage in 2022: $593 (0.2%)
Business Search- 14 Million verified businesses
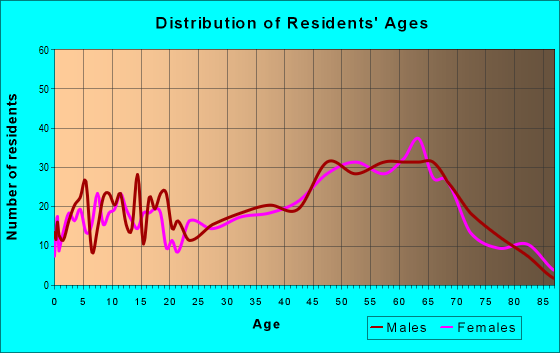
Males: 1,813
(47.9%)
Females: 1,972
(52.1%)
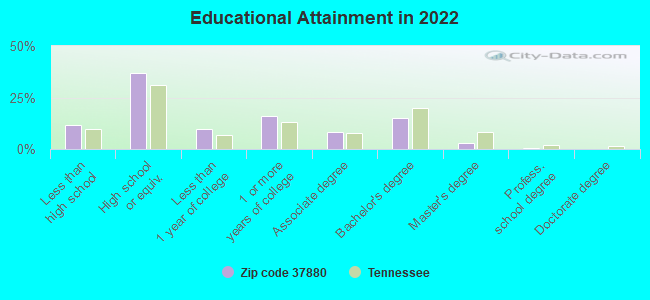
For population 25 years and over in 37880:
High school or higher: 88.1%
Bachelor's degree or higher: 18.0%
Graduate or professional degree: 3.3%
Unemployed: 1.2%
Mean travel time to work (commute): 42.7 minutes
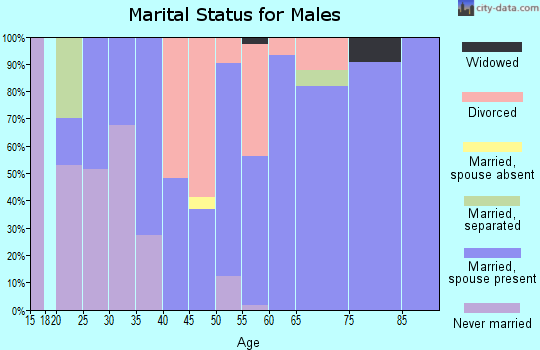
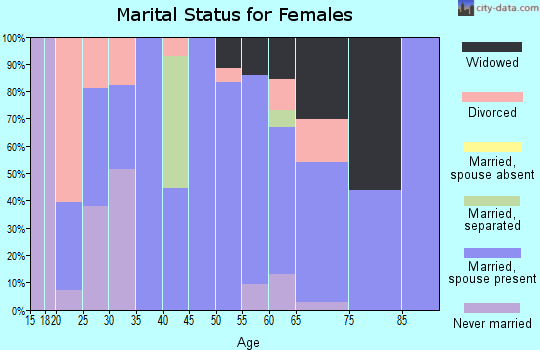
For population 15 years and over in 37880:
Never married: 18.3%
Now married: 58.2%
Separated: 1.1%
Widowed: 8.1%
Divorced: 14.2%
Zip code 37880 compared to state average:
Unemployed percentage significantly below state average.
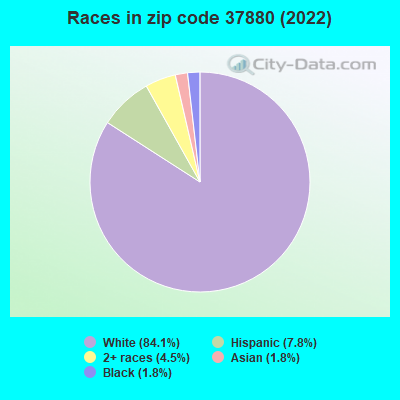
Black race population percentage significantly below state average.
Median age significantly above state average.
Foreign-born population percentage below state average.
Renting percentage below state average.
Length of stay since moving in significantly above state average.
Percentage of population with a bachelor's degree or higher below state average.
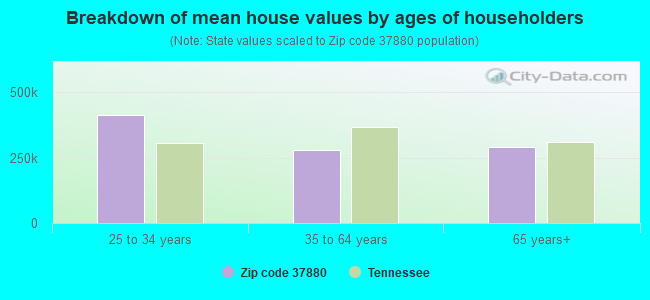
Estimated median house/condo value in 2022: $265,167
37880:
$265,167
Tennessee:
$284,800
According to our research of Tennessee and other state lists, there were 10 registered sex offenders living in 37880 zip code as of May 20, 2024. The ratio of all residents to sex offenders in zip code 37880 is 319 to 1. The ratio of registered sex offenders to all residents in this zip code is near the state average.
Median resident age:
This zip code:
52.0 years
Tennessee median age:
39.2 years
Average household size:
This zip code:
2.4 people
Tennessee:
2.4 people
Averages for the 2020 tax year for zip code 37880, filed in 2021:
Average Adjusted Gross Income (AGI) in 2020: $64,775 (Individual Income Tax Returns)
Here:
$64,775
State:
$69,014
Salary/wage: $54,117 (reported on 76.3% of returns)
Here:
$54,117
State:
$55,872
(% of AGI for various income ranges: 1038.2% for AGIs below $25k, 3343.4% for AGIs $25k-50k, 5587.2% for AGIs $50k-75k, 7576.4% for AGIs $75k-100k, 12858.2% for AGIs $100k-200k, 62180.0% for AGIs over 200k)
Taxable interest for individuals: $1,093 (reported on 34.3% of returns)
This zip code:
$1,093
Tennessee:
$1,945
(% of AGI for various income ranges: 15.0% for AGIs below $25k, 27.2% for AGIs $25k-50k, 72.2% for AGIs $50k-75k, 75.7% for AGIs $75k-100k, 95.9% for AGIs $100k-200k, 440.0% for AGIs over 200k)
Ordinary dividends: $4,758 (reported on 15.4% of returns)
Here:
$4,758
State:
$8,105
(% of AGI for various income ranges: 23.2% for AGIs below $25k, 23.8% for AGIs $25k-50k, 32.2% for AGIs $50k-75k, 195.7% for AGIs $75k-100k, 252.4% for AGIs $100k-200k, 1535.0% for AGIs over 200k)
Net capital gain/loss in AGI: +$8,256 (reported on 14.8% of returns)
Here:
+$8,256
State:
+$33,664
(% of AGI for various income ranges: 4.2% for AGIs below $25k, 41.1% for AGIs $50k-75k, 62.9% for AGIs $75k-100k, 763.5% for AGIs $100k-200k, 3060.0% for AGIs over 200k)
Profit/loss from business: +$12,496 (reported on 14.2% of returns)
Here:
+$12,496
State:
+$18,991
(% of AGI for various income ranges: 138.8% for AGIs below $25k, 105.9% for AGIs $25k-50k, 190.0% for AGIs $50k-75k, 475.7% for AGIs $75k-100k, 645.3% for AGIs $100k-200k)
Taxable individual retirement arrangement distribution: $30,800 (reported on 11.8% of returns)
37880:
$30,800
Tennessee:
$20,036
(% of AGI for various income ranges: 62.5% for AGIs below $25k, 142.5% for AGIs $25k-50k, 253.3% for AGIs $50k-75k, 825.0% for AGIs $75k-100k, 811.2% for AGIs $100k-200k, 12320.0% for AGIs over 200k)
Total itemized deductions: $37,333 (reported on 3.6% of returns)
Here:
$37,333
State:
$40,136
(% of AGI for various income ranges: 1317.6% for AGIs $100k-200k)
Charity contributions: $13,240 (reported on 3.0% of returns)
Here:
$13,240
State:
$19,852
(% of AGI for various income ranges: 389.4% for AGIs $100k-200k)
Taxes paid: $5,117 (reported on 3.6% of returns)
37880:
$5,117
State:
$6,038
(% of AGI for various income ranges: 180.6% for AGIs $100k-200k)
Earned income credit: $2,064 (reported on 16.6% of returns)
Here:
$2,064
State:
$2,391
(% of AGI for various income ranges: 89.5% for AGIs below $25k, 68.8% for AGIs $25k-50k)
Percentage of individuals using paid preparers for their 2020 taxes: 93.5%
Here:
93%
State:
93%
(% for various income ranges: 90.7% for AGIs below $25k, 95.0% for AGIs $25k-50k, 91.7% for AGIs $50k-75k, 94.7% for AGIs $75k-100k, 96.0% for AGIs $100k-200k, 100.0% for AGIs over 200k)
Averages for the 2012 tax year for zip code 37880, filed in 2013:
Average Adjusted Gross Income (AGI) in 2012: $55,506 (Individual Income Tax Returns)
Here:
$55,506
State:
$53,767
Salary/wage: $47,352 (reported on 78.2% of returns)
Here:
$47,352
State:
$45,421
(% of AGI for various income ranges: 67.4% for AGIs below $25k, 72.3% for AGIs $25k-50k, 69.5% for AGIs $50k-75k, 70.7% for AGIs $75k-100k, 72.2% for AGIs $100k-200k, 50.1% for AGIs over 200k)
Taxable interest for individuals: $1,439 (reported on 33.3% of returns)
This zip code:
$1,439
Tennessee:
$1,732
(% of AGI for various income ranges: 1.3% for AGIs below $25k, 1.1% for AGIs $25k-50k, 1.0% for AGIs $50k-75k, 0.7% for AGIs $75k-100k, 0.5% for AGIs $100k-200k, 1.0% for AGIs over 200k)
Ordinary dividends: $5,512 (reported on 16.3% of returns)
Here:
$5,512
State:
$6,739
(% of AGI for various income ranges: 1.1% for AGIs below $25k, 1.3% for AGIs $25k-50k, 0.2% for AGIs $50k-75k, 1.8% for AGIs $75k-100k, 1.0% for AGIs $100k-200k, 3.8% for AGIs over 200k)
Net capital gain/loss in AGI: +$4,774 (reported on 15.6% of returns)
Here:
+$4,774
State:
+$19,082
(% of AGI for various income ranges: 0.5% for AGIs $25k-50k, 0.6% for AGIs $50k-75k, 1.2% for AGIs $75k-100k, 1.2% for AGIs $100k-200k, 3.3% for AGIs over 200k)
Profit/loss from business: +$5,395 (reported on 13.6% of returns)
Here:
+$5,395
State:
+$15,240
(% of AGI for various income ranges: 8.2% for AGIs below $25k, 2.0% for AGIs $25k-50k, 1.8% for AGIs $50k-75k, 0.1% for AGIs $100k-200k)
Taxable individual retirement arrangement distribution: $18,350 (reported on 10.9% of returns)
37880:
$18,350
Tennessee:
$15,505
(% of AGI for various income ranges: 3.4% for AGIs below $25k, 3.1% for AGIs $25k-50k, 2.6% for AGIs $50k-75k, 5.5% for AGIs $75k-100k, 6.4% for AGIs $100k-200k)
Total itemized deductions: $21,014 (18% of AGI, reported on 19.7% of returns)
Here:
$21,014
State:
$21,976
Here:
17.6% of AGI
State:
17.8% of AGI
(% of AGI for various income ranges: 5.6% for AGIs below $25k, 6.3% for AGIs $25k-50k, 7.9% for AGIs $50k-75k, 6.7% for AGIs $75k-100k, 8.7% for AGIs $100k-200k, 7.9% for AGIs over 200k)
Charity contributions: $5,659 (reported on 15.0% of returns)
Here:
$5,659
State:
$6,709
(% of AGI for various income ranges: 0.9% for AGIs $25k-50k, 1.5% for AGIs $50k-75k, 1.1% for AGIs $75k-100k, 2.0% for AGIs $100k-200k, 2.4% for AGIs over 200k)
Taxes paid: $4,744 (reported on 18.4% of returns)
37880:
$4,744
State:
$4,829
(% of AGI for various income ranges: 0.9% for AGIs below $25k, 1.1% for AGIs $25k-50k, 1.1% for AGIs $50k-75k, 1.4% for AGIs $75k-100k, 2.0% for AGIs $100k-200k, 2.1% for AGIs over 200k)
Earned income credit: $2,160 (reported on 20.4% of returns)
Here:
$2,160
State:
$2,404
(% of AGI for various income ranges: 6.9% for AGIs below $25k, 1.3% for AGIs $25k-50k)
Percentage of individuals using paid preparers for their 2012 taxes: 57.8%
Here:
58%
State:
52%
(% for various income ranges: 50.0% for AGIs below $25k, 60.5% for AGIs $25k-50k, 60.0% for AGIs $50k-75k, 61.5% for AGIs $75k-100k, 68.8% for AGIs $100k-200k, 75.0% for AGIs over 200k)
Averages for the 2004 tax year for zip code 37880, filed in 2005:
Average Adjusted Gross Income (AGI) in 2004: $38,360 (Individual Income Tax Returns)
Here:
$38,360
State:
$44,088
Salary/wage: $35,086 (reported on 81.5% of returns)
Here:
$35,086
State:
$38,825
(% of AGI for various income ranges: 97.5% for AGIs below $10k, 77.0% for AGIs $10k-25k, 73.9% for AGIs $25k-50k, 80.0% for AGIs $50k-75k, 78.6% for AGIs $75k-100k, 65.7% for AGIs over 100k)
Taxable interest for individuals: $1,487 (reported on 39.5% of returns)
This zip code:
$1,487
Tennessee:
$1,802
(% of AGI for various income ranges: 7.5% for AGIs below $10k, 2.0% for AGIs $10k-25k, 1.6% for AGIs $25k-50k, 1.4% for AGIs $50k-75k, 0.7% for AGIs $75k-100k, 1.3% for AGIs over 100k)
Taxable dividends: $2,085 (reported on 14.4% of returns)
Here:
$2,085
State:
$3,727
(% of AGI for various income ranges: 2.6% for AGIs below $10k, 0.6% for AGIs $10k-25k, 0.5% for AGIs $25k-50k, 0.7% for AGIs $50k-75k, 0.7% for AGIs $75k-100k, 1.1% for AGIs over 100k)
Net capital gain/loss: +$5,238 (reported on 13.0% of returns)
Here:
+$5,238
State:
+$15,776
(% of AGI for various income ranges: -0.8% for AGIs below $10k, 1.2% for AGIs $10k-25k, 1.5% for AGIs $25k-50k, 1.3% for AGIs $50k-75k, 5.2% for AGIs $75k-100k, 1.5% for AGIs over 100k)
Profit/loss from business: +$8,551 (reported on 16.6% of returns)
Here:
+$8,551
State:
+$12,882
(% of AGI for various income ranges: 22.2% for AGIs below $10k, 3.2% for AGIs $10k-25k, 4.4% for AGIs $25k-50k, 2.5% for AGIs $50k-75k, 2.2% for AGIs $75k-100k, 3.4% for AGIs over 100k)
IRA payment deduction: $3,000 (reported on 1.6% of returns)
37880:
$3,000
Tennessee:
$2,934
Total itemized deductions: $17,792 (24% of AGI, reported on 17.2% of returns)
Here:
$17,792
State:
$18,035
Here:
23.9% of AGI
State:
19.9% of AGI
(% of AGI for various income ranges: 6.2% for AGIs $10k-25k, 7.2% for AGIs $25k-50k, 8.8% for AGIs $50k-75k, 10.0% for AGIs $75k-100k, 8.6% for AGIs over 100k)
Charity contributions deductions: $3,536 (5% of AGI, reported on 14.3% of returns)
Here:
$3,536
State:
$5,167
Here:
4.6% of AGI
State:
5.3% of AGI
(% of AGI for various income ranges: 0.7% for AGIs $10k-25k, 1.2% for AGIs $25k-50k, 1.1% for AGIs $50k-75k, 1.8% for AGIs $75k-100k, 1.7% for AGIs over 100k)
Total tax: $5,783 (reported on 71.9% of returns)
37880:
$5,783
State:
$7,482
(% of AGI for various income ranges: 4.8% for AGIs below $10k, 3.5% for AGIs $10k-25k, 6.1% for AGIs $25k-50k, 9.4% for AGIs $50k-75k, 11.3% for AGIs $75k-100k, 19.9% for AGIs over 100k)
Earned income credit: $1,717 (reported on 21.7% of returns)
Here:
$1,717
State:
$1,826
Percentage of individuals using paid preparers for their 2004 taxes: 59.5%
Here:
59%
State:
60%
(% for various income ranges: 52.2% for AGIs below $10k, 61.4% for AGIs $10k-25k, 62.8% for AGIs $25k-50k, 61.7% for AGIs $50k-75k, 54.8% for AGIs $75k-100k, 60.0% for AGIs over 100k)
Household received Food Stamps/SNAP in the past 12 months: 90 Household did not receive Food Stamps/SNAP in the past 12 months: 1,522
Women who did not have a birth in the past 12 months: 655 (245 now married, 410 unmarried)
Housing units in zip code 37880 with a mortgage: 546 (105 second mortgage, 10 home equity loan, 64 both second mortgage and home equity loan) Houses without a mortgage: 30
Median monthly owner costs for units with a mortgage: $1,350 Median monthly owner costs for units without a mortgage: $379
Residents with income below the poverty level in 2022:
This zip code:
12.1%
Whole state:
13.3%
Residents with income below 50% of the poverty level in 2022:
This zip code:
11.2%
Whole state:
7.1%
Median number of rooms in houses and condos:
Here:
5.9
State:
6.5
Median number of rooms in apartments:
Here:
5.2
State:
4.4
Notable locations in this zip code not listed on our city pages
Notable locations in zip code 37880: Center Point (A), Sams Dock (B), Camp John Knox (C), Camp Oo-tah-nee-noh-chee (D), Euchee Dock (E), Blue Springs Dock (F), Bayside Dock (G), Meigs County Emergency Services Fire Rescue Station 5 (H), South Roane County Volunteer Fire Department Station 4 (I), South Roane County Volunteer Fire Department Station 3 (J), South Roane County Volunteer Fire Department Station 5 (K). Display/hide their locations on the map
Churches in zip code 37880 include: Ten Mile Methodist Church (A), Ponder Church (B), Pleasant Hill Methodist Church (C), Maple Grove Church (D), Salem Church (E), Concord Church (F), Mount Zion Church (G), Midway Church (H), Luminary Church (I). Display/hide their locations on the map
Cemeteries: Hornsby Cemetery (1), Hornsby Chapel (2), Huff Cemetery (3), Jackson Cemetery (4), Sharp Cemetery (5), Johnson Cemetery (6), Union Star Cemetery (7). Display/hide their locations on the map
Streams, rivers, and creeks: Jackson Branch (A), Hurricane Creek (B), Wann Branch (C), Greenbrier Branch (D), Gordon Branch (E), Evans Branch (F), Dry Fork (G), Cane Creek (H), Blue Spring Branch (I). Display/hide their locations on the map
Parks in zip code 37880 include: Meigs County Park (1), Big Springs Access Area (2), Campground on the Lakeshore (3), Foshee Pass Recreation Area (4), Hornsby Hollow Recreation Area (5). Display/hide their locations on the map
Size of family households: 497 2-persons, 243 3-persons, 182 4-persons, 135 5-persons, 10 6-persons
Size of nonfamily households: 461 1-person, 68 2-persons, 8 3-persons
402 married couples with children.
226 single-parent households (226 women).
98.6% of residents of 37880 zip code speak English at home.
1.3% of residents speak Spanish at home (46% very well, 54% well).
0.4% of residents speak Asian or Pacific Island language at home (100% very well).
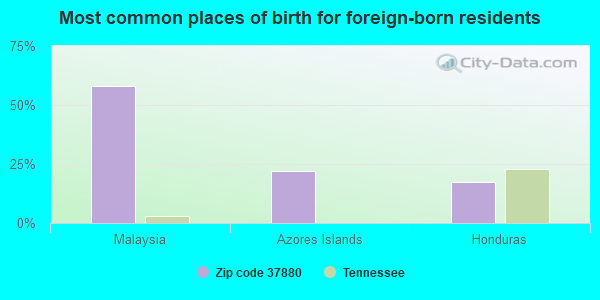
Foreign born population: 114 (3.0%) (73.3% of them are naturalized citizens)
This zip code:
3.0%
Whole state:
5.6%
58%Malaysia
22%Azores Islands
18%Honduras
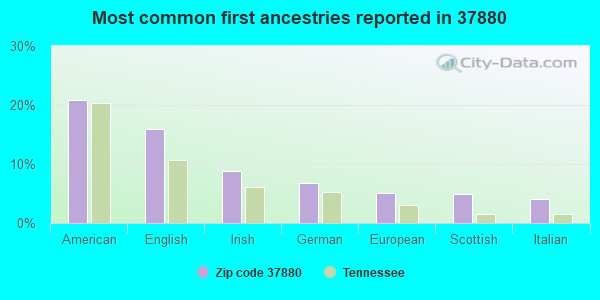
21%American
16%English
9%Irish
7%German
5%European
5%Scottish
4%Italian
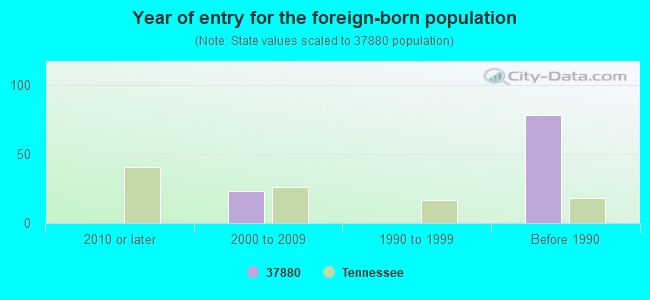
Year of entry for the foreign-born population
02010 or later
232000 to 2009
01990 to 1999
78Before 1990
Housing units lacking complete plumbing facilities: 5.9% Housing units lacking complete kitchen facilities: 6.5%
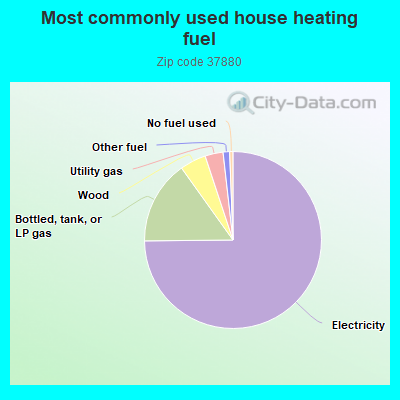
75.0%Electricity
15.3%Bottled, tank, or LP gas
4.8%Wood
3.3%Utility gas
1.2%Other fuel
0.6%No fuel used
Population in 1990: 4,355.
Place of birth for U.S.-born residents:
This state: 2,247
Northeast: 84
Midwest: 590
South: 598
West: 131
63% of the 37880 zip code residents lived in the same house 5 years ago. Out of people who lived in different houses, 31% lived in this county. Out of people who lived in different counties, 50% lived in Tennessee.
92% of the 37880 zip code residents lived in the same house 1 year ago. Out of people who lived in different houses, 13% moved from this county. Out of people who lived in different houses, 89% moved from different county within same state. Out of people who lived in different houses, 5% moved from different state.
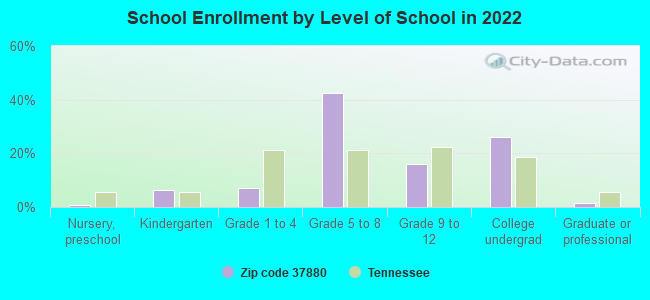
Private vs. public school enrollment:
Students in private schools in grades 1 to 8 (elementary and middle school): 310
Here:
71.4%
Tennessee:
15.0%
Students in private schools in grades 9 to 12 (high school):
Here:
0.0%
Tennessee:
16.2%
Students in private undergraduate colleges: 13
Here:
6.0%
Tennessee:
23.5%
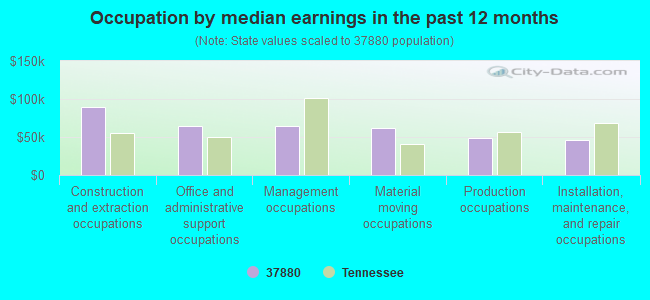
Occupation by median earnings in the past 12 months ($)
89,590Construction and extraction occupations
64,824Office and administrative support occupations
64,333Management occupations
61,451Material moving occupations
48,471Production occupations
45,493Installation, maintenance, and repair occupations
Top industries in this zip code by the number of employees in 2005:
Real Estate and Rental and Leasing: Lessors of Nonresidential Buildings (except Miniwarehouses) (10-19: 1)
Other Services (except Public Administration): Religious Organizations (5-9: 1, 1-4: 3)
Accommodation and Food Services: Full-Service Restaurants (5-9: 1)
Construction: Other Building Equipment Contractors (1-4: 1)
Real Estate and Rental and Leasing: Other Activities Related to Real Estate (1-4: 1)
Real Estate and Rental and Leasing: Video Tape and Disc Rental (1-4: 1)
Health Care and Social Assistance: Other Residential Care Facilities (1-4: 1)
Fatal accident statistics in 2014:
Fatal accident count: 1
Vehicles involved in fatal accidents: 1
Fatal accidents caused by drunken drivers: 1
Fatalities: 1
Persons involved in fatal accidents: 1
Pedestrians involved in fatal accidents: 0
Fatal accident statistics in 2013:
Fatal accident count: 1
Vehicles involved in fatal accidents: 1
Fatal accidents caused by drunken drivers: 0
Fatalities: 1
Persons involved in fatal accidents: 1
Pedestrians involved in fatal accidents: 0
2002 - 2018 National Fire Incident Reporting System (NFIRS) incidents
According to the data from the years 2002 - 2018 the average number of fire incidents per year is 26. The highest number of reported fire incidents - 42 took place in 2013, and the least - 7 in 2003. The data has an increasing trend.
When looking into fire subcategories, the most reports belonged to: Outside Fires (43.9%), and Structure Fires (35.2%).
Fire incident types reported to NFIRS in Zip Code 37880
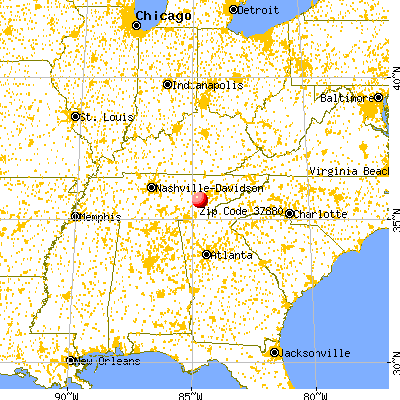


 Nearest zip codes: 37826, 37846, 37381, 37337, 37854, 37763.


 According to the data from the years 2002 - 2018 the average number of fire incidents per year is 26. The highest number of reported fire incidents - 42 took place in 2013, and the least - 7 in 2003. The data has an increasing trend.
 When looking into fire subcategories, the most reports belonged to: Outside Fires (43.9%), and Structure Fires (35.2%).