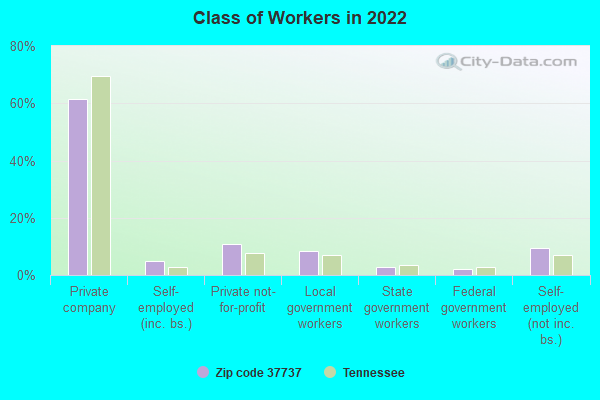
Estimated zip code population in 2022: 6,576 Zip code population in 2010: 5,785 Zip code population in 2000: 4,881
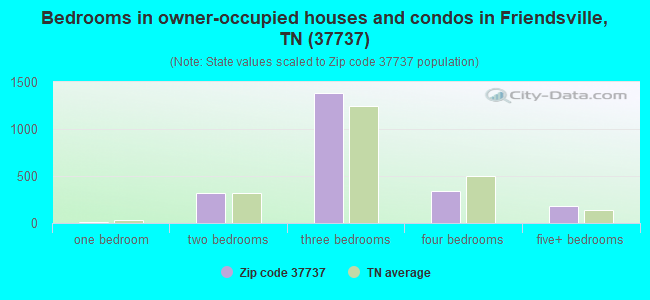
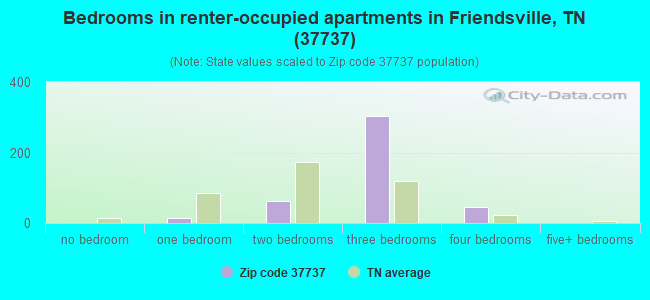
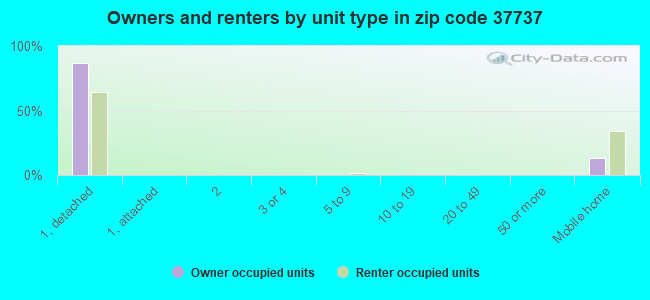
Houses and condos: 3,157 Renter-occupied apartments: 430
% of renters here:
16%
State:
33%
March 2022 cost of living index in zip code 37737: 80.8 (low, U.S. average is 100)
Land area: 26.3 sq. mi. Water area: 1.3 sq. mi.
Population density: 250 people per square mile
(very low).
OSM Map
General Map
Google Map
MSN Map
OSM Map
General Map
Google Map
MSN Map
OSM Map
General Map
Google Map
MSN Map
OSM Map
General Map
Google Map
MSN Map
Please wait while loading the map...
Real estate property taxes paid for housing units in 2022:
This zip code:
0.4% ($1,222)
Tennessee:
0.5% ($1,376)
Median real estate property taxes paid for housing units with mortgages in 2022: $1,341 (0.3%) Median real estate property taxes paid for housing units with no mortgage in 2022: $1,028 (0.4%)
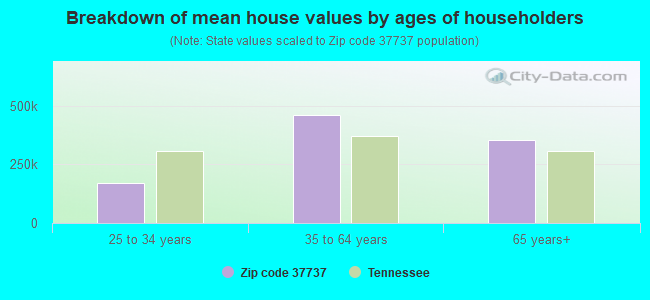
Estimated median house/condo value in 2022: $313,145
37737:
$313,145
Tennessee:
$284,800
According to our research of Tennessee and other state lists, there were 11 registered sex offenders living in 37737 zip code as of May 10, 2024. The ratio of all residents to sex offenders in zip code 37737 is 522 to 1. The ratio of registered sex offenders to all residents in this zip code is lower than the state average.
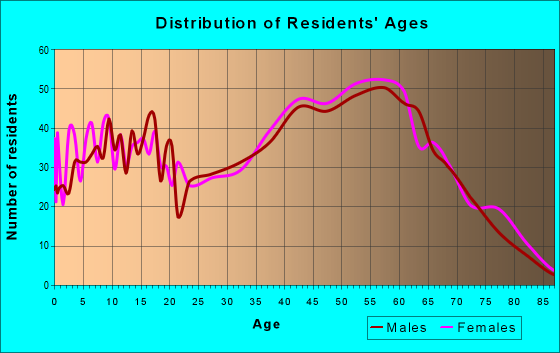
Median resident age:
This zip code:
48.2 years
Tennessee median age:
39.2 years
Average household size:
This zip code:
2.5 people
Tennessee:
2.4 people
Averages for the 2020 tax year for zip code 37737, filed in 2021:
Average Adjusted Gross Income (AGI) in 2020: $67,564 (Individual Income Tax Returns)
Here:
$67,564
State:
$69,014
Salary/wage: $55,883 (reported on 77.8% of returns)
Here:
$55,883
State:
$55,872
(% of AGI for various income ranges: 1060.0% for AGIs below $25k, 3396.1% for AGIs $25k-50k, 5823.3% for AGIs $50k-75k, 8620.5% for AGIs $75k-100k, 15765.4% for AGIs $100k-200k, 60700.0% for AGIs over 200k)
Taxable interest for individuals: $1,262 (reported on 31.2% of returns)
This zip code:
$1,262
Tennessee:
$1,945
(% of AGI for various income ranges: 20.3% for AGIs below $25k, 28.8% for AGIs $25k-50k, 34.4% for AGIs $50k-75k, 38.2% for AGIs $75k-100k, 132.5% for AGIs $100k-200k, 842.5% for AGIs over 200k)
Ordinary dividends: $5,555 (reported on 17.0% of returns)
Here:
$5,555
State:
$8,105
(% of AGI for various income ranges: 27.6% for AGIs below $25k, 32.5% for AGIs $25k-50k, 61.9% for AGIs $50k-75k, 79.1% for AGIs $75k-100k, 352.1% for AGIs $100k-200k, 2950.0% for AGIs over 200k)
Net capital gain/loss in AGI: +$26,635 (reported on 15.4% of returns)
Here:
+$26,635
State:
+$33,664
(% of AGI for various income ranges: 16.7% for AGIs $25k-50k, 74.4% for AGIs $50k-75k, 236.8% for AGIs $75k-100k, 505.7% for AGIs $100k-200k, 26225.0% for AGIs over 200k)
Profit/loss from business: +$17,761 (reported on 15.8% of returns)
Here:
+$17,761
State:
+$18,991
(% of AGI for various income ranges: 161.0% for AGIs below $25k, 253.5% for AGIs $25k-50k, 231.7% for AGIs $50k-75k, 468.6% for AGIs $75k-100k, 1174.3% for AGIs $100k-200k, 2405.0% for AGIs over 200k)
Taxable individual retirement arrangement distribution: $20,686 (reported on 9.3% of returns)
37737:
$20,686
Tennessee:
$20,036
(% of AGI for various income ranges: 42.8% for AGIs below $25k, 115.1% for AGIs $25k-50k, 236.9% for AGIs $50k-75k, 310.0% for AGIs $75k-100k, 1251.4% for AGIs $100k-200k)
Total itemized deductions: $39,447 (reported on 5.5% of returns)
Here:
$39,447
State:
$40,136
(% of AGI for various income ranges: 98.5% for AGIs below $25k, 159.2% for AGIs $50k-75k, 309.1% for AGIs $75k-100k, 846.1% for AGIs $100k-200k, 5962.5% for AGIs over 200k)
Charity contributions: $14,900 (reported on 4.5% of returns)
Here:
$14,900
State:
$19,852
(% of AGI for various income ranges: 31.9% for AGIs $25k-50k, 138.6% for AGIs $75k-100k, 311.8% for AGIs $100k-200k, 1815.0% for AGIs over 200k)
Taxes paid: $5,819 (reported on 5.1% of returns)
37737:
$5,819
State:
$6,038
(% of AGI for various income ranges: 25.4% for AGIs $25k-50k, 48.2% for AGIs $75k-100k, 125.7% for AGIs $100k-200k, 820.0% for AGIs over 200k)
Earned income credit: $2,104 (reported on 15.8% of returns)
Here:
$2,104
State:
$2,391
(% of AGI for various income ranges: 93.0% for AGIs below $25k, 65.1% for AGIs $25k-50k)
Percentage of individuals using paid preparers for their 2020 taxes: 92.9%
Here:
93%
State:
93%
(% for various income ranges: 92.7% for AGIs below $25k, 91.8% for AGIs $25k-50k, 93.6% for AGIs $50k-75k, 93.5% for AGIs $75k-100k, 94.1% for AGIs $100k-200k, 92.3% for AGIs over 200k)
Averages for the 2012 tax year for zip code 37737, filed in 2013:
Average Adjusted Gross Income (AGI) in 2012: $52,939 (Individual Income Tax Returns)
Here:
$52,939
State:
$53,767
Salary/wage: $44,852 (reported on 81.5% of returns)
Here:
$44,852
State:
$45,421
(% of AGI for various income ranges: 68.7% for AGIs below $25k, 73.6% for AGIs $25k-50k, 77.7% for AGIs $50k-75k, 77.3% for AGIs $75k-100k, 68.8% for AGIs $100k-200k, 47.6% for AGIs over 200k)
Taxable interest for individuals: $1,116 (reported on 33.5% of returns)
This zip code:
$1,116
Tennessee:
$1,732
(% of AGI for various income ranges: 1.2% for AGIs below $25k, 0.8% for AGIs $25k-50k, 0.6% for AGIs $50k-75k, 0.6% for AGIs $75k-100k, 0.7% for AGIs $100k-200k, 0.6% for AGIs over 200k)
Ordinary dividends: $2,768 (reported on 16.9% of returns)
Here:
$2,768
State:
$6,739
(% of AGI for various income ranges: 1.0% for AGIs below $25k, 0.5% for AGIs $25k-50k, 0.7% for AGIs $50k-75k, 1.0% for AGIs $75k-100k, 0.7% for AGIs $100k-200k, 1.5% for AGIs over 200k)
Net capital gain/loss in AGI: +$3,907 (reported on 11.2% of returns)
Here:
+$3,907
State:
+$19,082
(% of AGI for various income ranges: 0.4% for AGIs $50k-75k, 0.8% for AGIs $75k-100k, 0.5% for AGIs $100k-200k, 3.0% for AGIs over 200k)
Profit/loss from business: +$13,920 (reported on 17.7% of returns)
Here:
+$13,920
State:
+$15,240
(% of AGI for various income ranges: 9.8% for AGIs below $25k, 6.2% for AGIs $25k-50k, 3.6% for AGIs $50k-75k, 1.8% for AGIs $75k-100k, 7.6% for AGIs $100k-200k)
Taxable individual retirement arrangement distribution: $12,150 (reported on 10.8% of returns)
37737:
$12,150
Tennessee:
$15,505
(% of AGI for various income ranges: 2.6% for AGIs below $25k, 2.0% for AGIs $25k-50k, 2.3% for AGIs $50k-75k, 1.9% for AGIs $75k-100k, 5.0% for AGIs $100k-200k)
Total itemized deductions: $22,255 (22% of AGI, reported on 24.6% of returns)
Here:
$22,255
State:
$21,976
Here:
22.0% of AGI
State:
17.8% of AGI
(% of AGI for various income ranges: 11.7% for AGIs below $25k, 7.9% for AGIs $25k-50k, 9.5% for AGIs $50k-75k, 12.6% for AGIs $75k-100k, 10.9% for AGIs $100k-200k, 9.9% for AGIs over 200k)
Charity contributions: $6,204 (reported on 19.2% of returns)
Here:
$6,204
State:
$6,709
(% of AGI for various income ranges: 0.9% for AGIs below $25k, 0.8% for AGIs $25k-50k, 1.7% for AGIs $50k-75k, 2.6% for AGIs $75k-100k, 2.4% for AGIs $100k-200k, 4.5% for AGIs over 200k)
Taxes paid: $3,863 (reported on 24.2% of returns)
37737:
$3,863
State:
$4,829
(% of AGI for various income ranges: 1.0% for AGIs below $25k, 1.3% for AGIs $25k-50k, 1.6% for AGIs $50k-75k, 1.9% for AGIs $75k-100k, 2.4% for AGIs $100k-200k, 1.8% for AGIs over 200k)
Earned income credit: $2,162 (reported on 17.3% of returns)
Here:
$2,162
State:
$2,404
(% of AGI for various income ranges: 5.7% for AGIs below $25k, 1.1% for AGIs $25k-50k)
Percentage of individuals using paid preparers for their 2012 taxes: 51.5%
Here:
52%
State:
52%
(% for various income ranges: 47.1% for AGIs below $25k, 50.9% for AGIs $25k-50k, 52.3% for AGIs $50k-75k, 56.0% for AGIs $75k-100k, 60.0% for AGIs $100k-200k, 80.0% for AGIs over 200k)
Averages for the 2004 tax year for zip code 37737, filed in 2005:
Average Adjusted Gross Income (AGI) in 2004: $42,455 (Individual Income Tax Returns)
Here:
$42,455
State:
$44,088
Salary/wage: $39,518 (reported on 85.0% of returns)
Here:
$39,518
State:
$38,825
(% of AGI for various income ranges: 94.0% for AGIs below $10k, 75.7% for AGIs $10k-25k, 80.9% for AGIs $25k-50k, 81.9% for AGIs $50k-75k, 84.0% for AGIs $75k-100k, 71.3% for AGIs over 100k)
Taxable interest for individuals: $1,319 (reported on 41.0% of returns)
This zip code:
$1,319
Tennessee:
$1,802
(% of AGI for various income ranges: 3.6% for AGIs below $10k, 1.3% for AGIs $10k-25k, 0.9% for AGIs $25k-50k, 0.9% for AGIs $50k-75k, 1.1% for AGIs $75k-100k, 1.9% for AGIs over 100k)
Taxable dividends: $1,936 (reported on 16.6% of returns)
Here:
$1,936
State:
$3,727
(% of AGI for various income ranges: 1.6% for AGIs below $10k, 0.7% for AGIs $10k-25k, 0.3% for AGIs $25k-50k, 0.4% for AGIs $50k-75k, 0.6% for AGIs $75k-100k, 1.6% for AGIs over 100k)
Net capital gain/loss: +$6,460 (reported on 13.3% of returns)
Here:
+$6,460
State:
+$15,776
(% of AGI for various income ranges: -2.4% for AGIs below $10k, -0.2% for AGIs $10k-25k, 0.3% for AGIs $25k-50k, 0.7% for AGIs $50k-75k, 1.9% for AGIs $75k-100k, 6.3% for AGIs over 100k)
Profit/loss from business: +$10,530 (reported on 18.4% of returns)
Here:
+$10,530
State:
+$12,882
(% of AGI for various income ranges: 9.8% for AGIs below $10k, 8.7% for AGIs $10k-25k, 5.5% for AGIs $25k-50k, 3.0% for AGIs $50k-75k, 4.1% for AGIs $75k-100k, 3.6% for AGIs over 100k)
IRA payment deduction: $2,877 (reported on 2.6% of returns)
37737:
$2,877
Tennessee:
$2,934
(% of AGI for various income ranges: 0.2% for AGIs $10k-25k, 0.2% for AGIs $25k-50k, 0.3% for AGIs $50k-75k, 0.2% for AGIs over 100k)
Self-employed pension: $10,100 (reported on 0.4% of returns)
Here:
$10,100
Tennessee:
$16,857
Total itemized deductions: $16,510 (23% of AGI, reported on 26.7% of returns)
Here:
$16,510
State:
$18,035
Here:
22.6% of AGI
State:
19.9% of AGI
(% of AGI for various income ranges: 9.2% for AGIs below $10k, 7.6% for AGIs $10k-25k, 9.3% for AGIs $25k-50k, 11.0% for AGIs $50k-75k, 10.6% for AGIs $75k-100k, 11.7% for AGIs over 100k)
Charity contributions deductions: $4,014 (5% of AGI, reported on 22.0% of returns)
Here:
$4,014
State:
$5,167
Here:
5.2% of AGI
State:
5.3% of AGI
(% of AGI for various income ranges: 1.2% for AGIs $10k-25k, 1.4% for AGIs $25k-50k, 2.3% for AGIs $50k-75k, 2.1% for AGIs $75k-100k, 3.0% for AGIs over 100k)
Total tax: $5,921 (reported on 76.9% of returns)
37737:
$5,921
State:
$7,482
(% of AGI for various income ranges: 3.8% for AGIs below $10k, 4.5% for AGIs $10k-25k, 7.1% for AGIs $25k-50k, 9.1% for AGIs $50k-75k, 10.8% for AGIs $75k-100k, 18.4% for AGIs over 100k)
Earned income credit: $1,620 (reported on 16.1% of returns)
Here:
$1,620
State:
$1,826
Percentage of individuals using paid preparers for their 2004 taxes: 57.1%
Here:
57%
State:
60%
(% for various income ranges: 53.4% for AGIs below $10k, 57.5% for AGIs $10k-25k, 56.6% for AGIs $25k-50k, 55.1% for AGIs $50k-75k, 61.4% for AGIs $75k-100k, 69.1% for AGIs over 100k)
Household received Food Stamps/SNAP in the past 12 months: 163 Household did not receive Food Stamps/SNAP in the past 12 months: 2,519
Women who had a birth in the past 12 months: 1 (2 now married, 0 unmarried) Women who did not have a birth in the past 12 months: 1,355 (624 now married, 731 unmarried)
Housing units in zip code 37737 with a mortgage: 1,251 (57 second mortgage, 58 both second mortgage and home equity loan) Houses without a mortgage: 20
Median monthly owner costs for units with a mortgage: $1,523 Median monthly owner costs for units without a mortgage: $454
Residents with income below the poverty level in 2022:
This zip code:
8.4%
Whole state:
13.3%
Residents with income below 50% of the poverty level in 2022:
This zip code:
5.4%
Whole state:
7.1%
Median number of rooms in houses and condos:
Here:
6.2
State:
6.5
Median number of rooms in apartments:
Here:
5.2
State:
4.4
Notable locations in this zip code not listed on our city pages
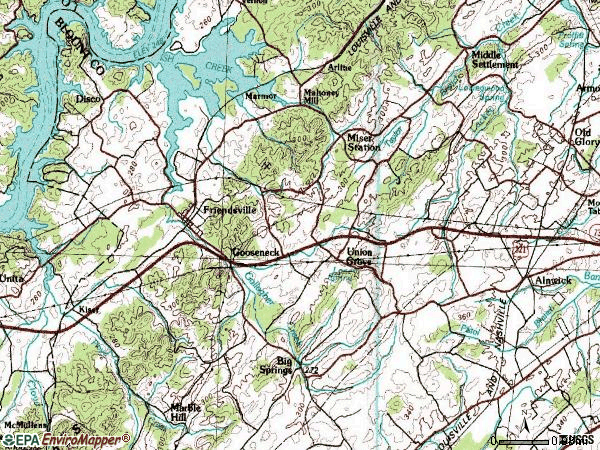
Notable locations in zip code 37737: Macs Dock (A), Smoky Landing Dock (B), Middle Settlement Community Center (C), Friendsville Volunteer Fire Department (D). Display/hide their locations on the map
Churches in zip code 37737 include: Big Springs Presbyterian Church (A), Friends Church (B), Friendsville Church (C), Emanuel Church (D). Display/hide their locations on the map
Cemeteries: Ish Cemetery (1), Leeper Cemetery (2), Union Grove Cemetery (3), Friendsville Cemetery (4), Big Springs Cemetery (5). Display/hide their locations on the map
Size of family households: 1,056 2-persons, 458 3-persons, 290 4-persons, 130 5-persons, 3 6-persons, 42 7-or-more-persons
Size of nonfamily households: 591 1-person, 56 2-persons, 43 3-persons
827 married couples with children.
275 single-parent households (105 men, 170 women).
97.7% of residents of 37737 zip code speak English at home.
1.7% of residents speak Spanish at home (100% very well).
0.3% of residents speak other Indo-European language at home (100% very well).
0.1% of residents speak Asian or Pacific Island language at home (100% very well).
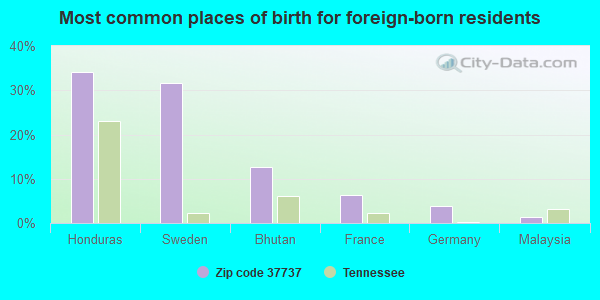
Foreign born population: 79 (1.2%) (52.2% of them are naturalized citizens)
This zip code:
1.2%
Whole state:
5.6%
34%Honduras
32%Sweden
13%Bhutan
6%France
4%Germany
1%Malaysia
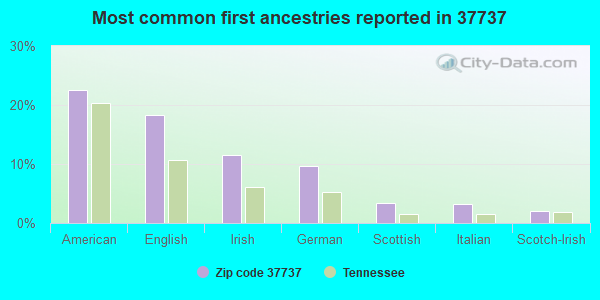
23%American
18%English
12%Irish
10%German
3%Scottish
3%Italian
2%Scotch-Irish
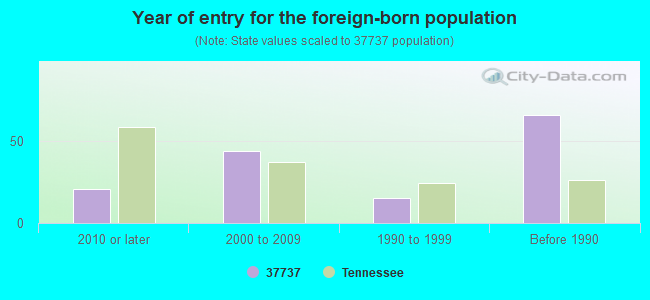
Year of entry for the foreign-born population
212010 or later
442000 to 2009
151990 to 1999
66Before 1990
Facilities with environmental interests located in this zip code:
ALLISON CRAFT BOATS (RURAL RT 1 in FRIENDSVILLE, TN)
(Resource Conservation and Recovery Act (tracking hazardous waste)) Business NAICS classification: BOAT BUILDING.
CUSTOM QUARRY (566 S. UNION GROVE RD. in FRIENDSVILLE, TN)
AIR MAJOR (AIRS/AFS) CRITERIA AND HAZARDOUS AIR POLLUTANT INVENTORY (Inventory of air pollution sources) TRI REPORTER (Tracking of toxic chemicals releasing facilities) Business SIC classification: PLASTICS PLUMBING FIXTURES; PLASTICS PRODUCTS Business NAICS classification: PLASTICS PLUMBING FIXTURE MANUFACTURING.
Housing units lacking complete plumbing facilities: 7.8% Housing units lacking complete kitchen facilities: 8.0%
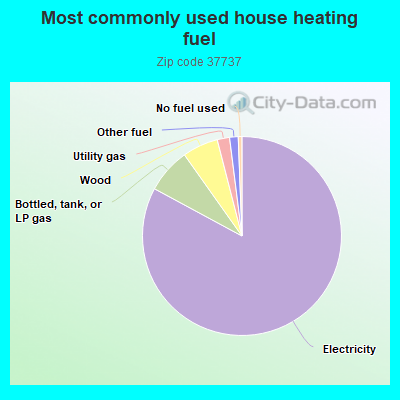
82.8%Electricity
7.3%Bottled, tank, or LP gas
5.8%Wood
2.0%Utility gas
1.4%Other fuel
0.6%No fuel used
Population in 1990: 4,186. Population change in the 1990s: +695 (+16.6%).
Place of birth for U.S.-born residents:
This state: 4,114
Northeast: 379
Midwest: 816
South: 663
West: 440
58% of the 37737 zip code residents lived in the same house 5 years ago. Out of people who lived in different houses, 64% lived in this county. Out of people who lived in different counties, 50% lived in Tennessee.
93% of the 37737 zip code residents lived in the same house 1 year ago. Out of people who lived in different houses, 35% moved from this county. Out of people who lived in different houses, 41% moved from different county within same state. Out of people who lived in different houses, 19% moved from different state. Out of people who lived in different houses, 11% moved from abroad.
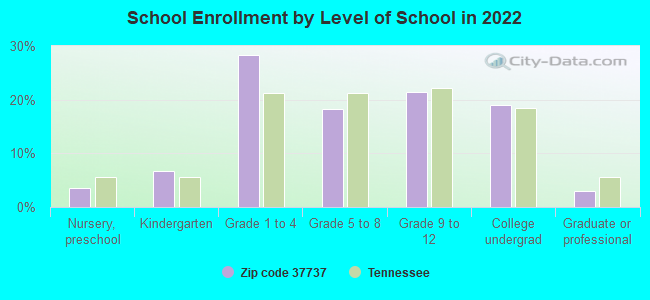
Private vs. public school enrollment:
Students in private schools in grades 1 to 8 (elementary and middle school): 17
Here:
3.6%
Tennessee:
15.0%
Students in private schools in grades 9 to 12 (high school): 59
Here:
25.0%
Tennessee:
16.2%
Students in private undergraduate colleges: 35
Here:
17.2%
Tennessee:
23.5%
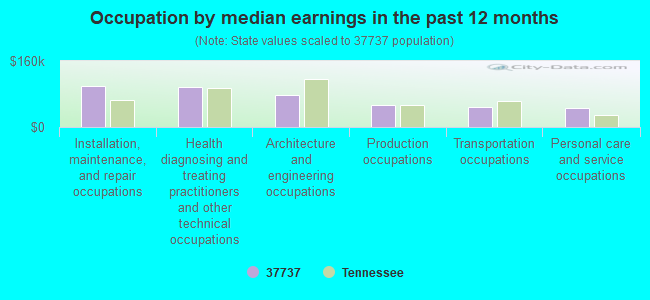
Occupation by median earnings in the past 12 months ($)
100,347Installation, maintenance, and repair occupations
96,655Health diagnosing and treating practitioners and other technical occupations
77,590Architecture and engineering occupations
52,137Production occupations
47,833Transportation occupations
45,488Personal care and service occupations
Top industries in this zip code by the number of employees in 2005:
Accommodation and Food Services: Hotels (except Casino Hotels) and Motels (20-49 employees: 1 establishment)
Other Services (except Public Administration): Religious Organizations (5-9: 3, 1-4: 2)
Construction: Site Preparation Contractors (10-19: 1, 1-4: 2)
Accommodation and Food Services: Full-Service Restaurants (10-19: 1, 1-4: 1)
Administrative and Support and Waste Management and Remediation Services: Landscaping Services (5-9: 1, 1-4: 5)
Construction: Electrical Contractors (10-19: 1)
Health Care and Social Assistance: Child Day Care Services (10-19: 1)
Construction: New Single-Family Housing Construction (except Operative Builders) (1-4: 5)
Administrative and Support and Waste Management and Remediation Services: Janitorial Services (5-9: 1, 1-4: 1)
Fatal accident statistics in 2014:
Fatal accident count: 1
Vehicles involved in fatal accidents: 2
Fatal accidents caused by drunken drivers: 1
Fatalities: 1
Persons involved in fatal accidents: 3
Pedestrians involved in fatal accidents: 1
Fatal accident statistics in 2013:
Fatal accident count: 2
Vehicles involved in fatal accidents: 4
Fatal accidents caused by drunken drivers: 0
Fatalities: 2
Persons involved in fatal accidents: 10
Pedestrians involved in fatal accidents: 0
Home Mortgage Disclosure Act Aggregated Statistics For Year 2009 (Based on 2 partial tracts)
A) FHA, FSA/RHS & VA Home Purchase Loans
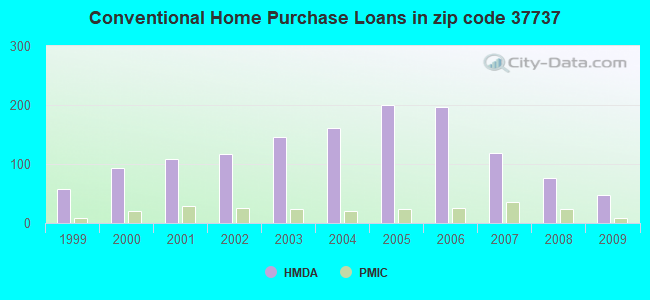
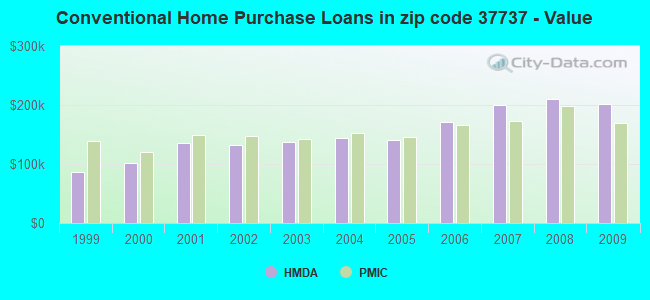
B) Conventional Home Purchase Loans
C) Refinancings
D) Home Improvement Loans
F) Non-occupant Loans on < 5 Family Dwellings (A B C & D)
G) Loans On Manufactured Home Dwelling (A B C & D)
Number
Average Value
Number
Average Value
Number
Average Value
Number
Average Value
Number
Average Value
Number
Average Value
LOANS ORIGINATED
43
$136,559
47
$202,477
276
$194,199
10
$59,184
15
$182,281
11
$89,828
APPLICATIONS APPROVED, NOT ACCEPTED
2
$161,375
1
$189,680
21
$191,117
1
$97,780
0
$0
1
$113,220
APPLICATIONS DENIED
5
$154,540
12
$240,349
71
$188,366
7
$34,870
8
$201,169
4
$100,905
APPLICATIONS WITHDRAWN
5
$142,776
5
$252,026
49
$185,420
1
$10,290
2
$335,250
3
$78,910
FILES CLOSED FOR INCOMPLETENESS
1
$99,250
0
$0
12
$204,447
1
$154,390
1
$121,310
1
$68,370
Aggregated Statistics For Year 2008 (Based on 2 partial tracts)
A) FHA, FSA/RHS & VA Home Purchase Loans
B) Conventional Home Purchase Loans
C) Refinancings
D) Home Improvement Loans
F) Non-occupant Loans on < 5 Family Dwellings (A B C & D)
G) Loans On Manufactured Home Dwelling (A B C & D)
Number
Average Value
Number
Average Value
Number
Average Value
Number
Average Value
Number
Average Value
Number
Average Value
LOANS ORIGINATED
29
$155,051
76
$209,900
151
$167,694
22
$67,137
16
$183,432
16
$85,972
APPLICATIONS APPROVED, NOT ACCEPTED
1
$213,940
8
$179,940
15
$304,667
3
$41,417
1
$119,840
7
$74,780
APPLICATIONS DENIED
2
$128,660
15
$155,176
99
$185,486
24
$130,988
1
$213,210
20
$102,928
APPLICATIONS WITHDRAWN
2
$202,550
6
$179,267
51
$185,040
3
$88,713
1
$58,820
4
$70,028
FILES CLOSED FOR INCOMPLETENESS
1
$102,930
5
$164,832
5
$177,330
1
$313,930
0
$0
1
$72,050
Aggregated Statistics For Year 2007 (Based on 2 partial tracts)
A) FHA, FSA/RHS & VA Home Purchase Loans
B) Conventional Home Purchase Loans
C) Refinancings
D) Home Improvement Loans
F) Non-occupant Loans on < 5 Family Dwellings (A B C & D)
G) Loans On Manufactured Home Dwelling (A B C & D)
Number
Average Value
Number
Average Value
Number
Average Value
Number
Average Value
Number
Average Value
Number
Average Value
LOANS ORIGINATED
12
$146,121
118
$200,199
179
$164,097
35
$65,370
27
$245,366
25
$81,990
APPLICATIONS APPROVED, NOT ACCEPTED
1
$176,450
17
$168,101
21
$294,290
4
$70,212
0
$0
8
$96,128
APPLICATIONS DENIED
1
$194,830
22
$240,410
118
$191,856
17
$104,052
7
$191,361
12
$88,652
APPLICATIONS WITHDRAWN
3
$112,487
10
$256,291
43
$170,669
6
$111,383
1
$35,290
9
$76,216
FILES CLOSED FOR INCOMPLETENESS
0
$0
4
$135,278
18
$177,306
1
$25,730
1
$52,200
1
$83,080
Aggregated Statistics For Year 2006 (Based on 2 partial tracts)
A) FHA, FSA/RHS & VA Home Purchase Loans
B) Conventional Home Purchase Loans
C) Refinancings
D) Home Improvement Loans
F) Non-occupant Loans on < 5 Family Dwellings (A B C & D)
G) Loans On Manufactured Home Dwelling (A B C & D)
Number
Average Value
Number
Average Value
Number
Average Value
Number
Average Value
Number
Average Value
Number
Average Value
LOANS ORIGINATED
15
$134,199
196
$171,789
187
$148,322
28
$37,548
41
$165,169
37
$71,454
APPLICATIONS APPROVED, NOT ACCEPTED
1
$85,280
33
$110,414
36
$124,249
3
$54,893
13
$92,070
18
$64,902
APPLICATIONS DENIED
4
$98,518
65
$134,666
103
$137,311
22
$59,651
21
$70,930
44
$60,102
APPLICATIONS WITHDRAWN
0
$0
19
$193,435
73
$146,496
3
$71,803
3
$74,257
1
$117,630
FILES CLOSED FOR INCOMPLETENESS
0
$0
9
$273,658
25
$139,512
1
$13,230
1
$180,120
0
$0
Aggregated Statistics For Year 2005 (Based on 2 partial tracts)
A) FHA, FSA/RHS & VA Home Purchase Loans
B) Conventional Home Purchase Loans
C) Refinancings
D) Home Improvement Loans
F) Non-occupant Loans on < 5 Family Dwellings (A B C & D)
G) Loans On Manufactured Home Dwelling (A B C & D)
Number
Average Value
Number
Average Value
Number
Average Value
Number
Average Value
Number
Average Value
Number
Average Value
LOANS ORIGINATED
22
$119,303
200
$140,544
232
$133,040
22
$54,839
36
$148,960
35
$54,636
APPLICATIONS APPROVED, NOT ACCEPTED
1
$140,420
38
$98,052
32
$144,949
2
$32,715
4
$48,890
18
$56,447
APPLICATIONS DENIED
5
$81,608
57
$84,122
134
$127,118
15
$89,155
7
$113,431
58
$65,483
APPLICATIONS WITHDRAWN
2
$148,145
18
$157,251
103
$132,757
5
$24,114
1
$76,460
10
$68,668
FILES CLOSED FOR INCOMPLETENESS
0
$0
6
$103,908
16
$189,130
0
$0
0
$0
0
$0
Aggregated Statistics For Year 2004 (Based on 2 partial tracts)
A) FHA, FSA/RHS & VA Home Purchase Loans
B) Conventional Home Purchase Loans
C) Refinancings
D) Home Improvement Loans
F) Non-occupant Loans on < 5 Family Dwellings (A B C & D)
G) Loans On Manufactured Home Dwelling (A B C & D)
Number
Average Value
Number
Average Value
Number
Average Value
Number
Average Value
Number
Average Value
Number
Average Value
LOANS ORIGINATED
26
$125,125
161
$143,912
214
$138,571
27
$50,810
35
$143,301
33
$60,977
APPLICATIONS APPROVED, NOT ACCEPTED
3
$85,037
28
$78,299
37
$130,528
4
$38,598
1
$197,770
20
$52,898
APPLICATIONS DENIED
1
$52,930
70
$72,680
105
$106,744
12
$46,502
7
$77,931
67
$49,368
APPLICATIONS WITHDRAWN
1
$208,800
15
$169,978
100
$121,477
7
$118,367
5
$214,384
9
$88,551
FILES CLOSED FOR INCOMPLETENESS
0
$0
4
$126,822
10
$129,836
0
$0
0
$0
1
$116,900
Aggregated Statistics For Year 2003 (Based on 2 partial tracts)
A) FHA, FSA/RHS & VA Home Purchase Loans
B) Conventional Home Purchase Loans
C) Refinancings
D) Home Improvement Loans
E) Loans on Dwellings For 5+ Families
F) Non-occupant Loans on < 5 Family Dwellings (A B C & D)
Number
Average Value
Number
Average Value
Number
Average Value
Number
Average Value
Number
Average Value
Number
Average Value
LOANS ORIGINATED
24
$112,087
146
$137,754
399
$128,286
18
$29,244
1
$51,460
34
$118,173
APPLICATIONS APPROVED, NOT ACCEPTED
1
$25,730
17
$132,422
51
$130,995
4
$13,785
0
$0
2
$72,415
APPLICATIONS DENIED
5
$88,960
40
$101,642
117
$90,411
7
$24,787
0
$0
4
$112,302
APPLICATIONS WITHDRAWN
1
$161,740
14
$118,315
90
$116,472
0
$0
0
$0
4
$76,092
FILES CLOSED FOR INCOMPLETENESS
0
$0
4
$84,548
7
$188,211
1
$13,230
0
$0
0
$0
Aggregated Statistics For Year 2002 (Based on 2 partial tracts)
A) FHA, FSA/RHS & VA Home Purchase Loans
B) Conventional Home Purchase Loans
C) Refinancings
D) Home Improvement Loans
F) Non-occupant Loans on < 5 Family Dwellings (A B C & D)
Number
Average Value
Number
Average Value
Number
Average Value
Number
Average Value
Number
Average Value
LOANS ORIGINATED
26
$101,571
117
$132,575
247
$131,610
15
$13,871
18
$101,988
APPLICATIONS APPROVED, NOT ACCEPTED
1
$45,580
19
$76,964
35
$80,368
4
$6,432
1
$159,540
APPLICATIONS DENIED
3
$91,163
46
$67,319
93
$84,058
7
$21,741
2
$45,950
APPLICATIONS WITHDRAWN
5
$95,576
10
$187,402
57
$112,576
4
$30,695
3
$87,000
FILES CLOSED FOR INCOMPLETENESS
1
$103,660
4
$106,052
15
$105,869
0
$0
0
$0
Aggregated Statistics For Year 2001 (Based on 2 partial tracts)
A) FHA, FSA/RHS & VA Home Purchase Loans
B) Conventional Home Purchase Loans
C) Refinancings
D) Home Improvement Loans
F) Non-occupant Loans on < 5 Family Dwellings (A B C & D)
Number
Average Value
Number
Average Value
Number
Average Value
Number
Average Value
Number
Average Value
LOANS ORIGINATED
40
$105,409
108
$135,781
263
$112,265
27
$30,770
18
$81,239
APPLICATIONS APPROVED, NOT ACCEPTED
1
$47,050
24
$57,621
27
$114,664
1
$50,730
0
$0
APPLICATIONS DENIED
1
$146,300
68
$57,681
88
$78,341
9
$13,969
2
$114,325
APPLICATIONS WITHDRAWN
1
$50,730
12
$112,241
49
$106,484
1
$16,170
2
$78,300
FILES CLOSED FOR INCOMPLETENESS
1
$63,230
2
$140,790
12
$124,984
1
$38,970
0
$0
Aggregated Statistics For Year 2000 (Based on 2 partial tracts)
A) FHA, FSA/RHS & VA Home Purchase Loans
B) Conventional Home Purchase Loans
C) Refinancings
D) Home Improvement Loans
E) Loans on Dwellings For 5+ Families
F) Non-occupant Loans on < 5 Family Dwellings (A B C & D)
Number
Average Value
Number
Average Value
Number
Average Value
Number
Average Value
Number
Average Value
Number
Average Value
LOANS ORIGINATED
35
$90,829
93
$100,967
96
$79,593
21
$28,463
1
$89,690
4
$84,548
APPLICATIONS APPROVED, NOT ACCEPTED
6
$40,558
36
$46,195
23
$89,311
8
$23,710
0
$0
3
$33,820
APPLICATIONS DENIED
12
$64,452
94
$39,497
76
$69,186
10
$30,290
0
$0
4
$31,430
APPLICATIONS WITHDRAWN
3
$76,950
7
$90,534
24
$82,036
3
$60,777
0
$0
1
$84,550
FILES CLOSED FOR INCOMPLETENESS
0
$0
1
$49,990
5
$167,920
0
$0
0
$0
0
$0
Aggregated Statistics For Year 1999 (Based on 1 partial tract)
A) FHA, FSA/RHS & VA Home Purchase Loans
B) Conventional Home Purchase Loans
C) Refinancings
D) Home Improvement Loans
F) Non-occupant Loans on < 5 Family Dwellings (A B C & D)
Detailed PMIC statistics for the following Tracts:0116.01
2002 - 2018 National Fire Incident Reporting System (NFIRS) incidents
According to the data from the years 2002 - 2018 the average number of fire incidents per year is 22. The highest number of reported fires - 41 took place in 2016, and the least - 8 in 2003. The data has a rising trend.
When looking into fire subcategories, the most reports belonged to: Outside Fires (49.7%), and Structure Fires (34.4%).
Fire incident types reported to NFIRS in Zip Code 37737
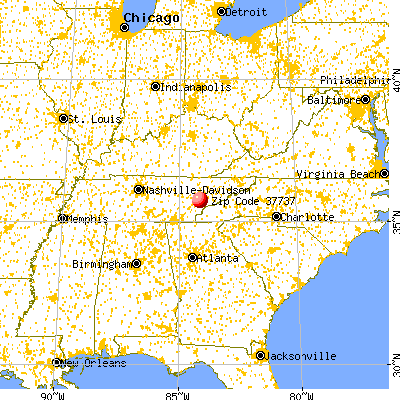


 Nearest zip codes: 37777, 37801, 37922, 37772, 37742, 37934.


 According to the data from the years 2002 - 2018 the average number of fire incidents per year is 22. The highest number of reported fires - 41 took place in 2016, and the least - 8 in 2003. The data has a rising trend.
 When looking into fire subcategories, the most reports belonged to: Outside Fires (49.7%), and Structure Fires (34.4%).