Estimated zip code population in 2022: 29,334
Zip code population in 2010: 26,880
Zip code population in 2000: 25,980
Houses and condos: 14,525
Renter-occupied apartments: 3,874
% of renters here:
29%State:
33%
March 2022 cost of living index in zip code 37664: 81.3
(low, U.S. average is 100)
Land area: 32.6
sq. mi.
Water area: 0.4
sq. mi.
Population density: 899 people per square mile (low).
OSM Map
General Map
Google Map
MSN Map
OSM Map
General Map
Google Map
MSN Map
OSM Map
General Map
Google Map
MSN Map
OSM Map
General Map
Google Map
MSN Map
Please wait while loading the map...
Real estate property taxes paid for housing units in 2022:
This zip code:
0.6% ($1,361)Tennessee:
0.5% ($1,376)
Median real estate property taxes paid for housing units with mortgages in 2022: $1,394 (0.6%)
Median real estate property taxes paid for housing units with no mortgage in 2022: $1,336 (0.7%)
Profiles of local businesses
Business Search - 14 Million verified businesses
Males: 14,262 Females: 15,071
For population 25 years and over in 37664:
High school or higher: 92.2%Bachelor's degree or higher: 34.0%Graduate or professional degree: 10.5%Unemployed: 2.9%Mean travel time to work (commute): 19.8 minutes
For population 15 years and over in 37664:
Never married: 23.0%Now married: 52.4%Separated: 2.0%Widowed: 8.5%Divorced: 14.2%
Zip code 37664 compared to state average:
Black race population percentage significantly below state average. Hispanic race population percentage significantly below state average. Median age above state average. Foreign-born population percentage significantly below state average. Length of stay since moving in significantly above state average. 27,443 93.6% White 692 2.4% Two or more races 523 1.8% Hispanic or Latino 471 1.6% Black 187 0.6% Asian 16 0.05% American Indian
Data:
Median household income ($)
Median household income (% change since 2000)
Household income diversity
Ratio of average income to average house value (%)
Ratio of average income to average rent
Median household income ($) - White
Median household income ($) - Black or African American
Median household income ($) - Asian
Median household income ($) - Hispanic or Latino
Median household income ($) - American Indian and Alaska Native
Median household income ($) - Multirace
Median household income ($) - Other Race
Median household income for houses/condos with a mortgage ($)
Median household income for apartments without a mortgage ($)
Races - White alone (%)
Races - White alone (% change since 2000)
Races - Black alone (%)
Races - Black alone (% change since 2000)
Races - American Indian alone (%)
Races - American Indian alone (% change since 2000)
Races - Asian alone (%)
Races - Asian alone (% change since 2000)
Races - Hispanic (%)
Races - Hispanic (% change since 2000)
Races - Native Hawaiian and Other Pacific Islander alone (%)
Races - Native Hawaiian and Other Pacific Islander alone (% change since 2000)
Races - Two or more races (%)
Races - Two or more races (% change since 2000)
Races - Other race alone (%)
Races - Other race alone (% change since 2000)
Racial diversity
Unemployment (%)
Unemployment (% change since 2000)
Unemployment (%) - White
Unemployment (%) - Black or African American
Unemployment (%) - Asian
Unemployment (%) - Hispanic or Latino
Unemployment (%) - American Indian and Alaska Native
Unemployment (%) - Multirace
Unemployment (%) - Other Race
Population density (people per square mile)
Population - Males (%)
Population - Females (%)
Population - Males (%) - White
Population - Males (%) - Black or African American
Population - Males (%) - Asian
Population - Males (%) - Hispanic or Latino
Population - Males (%) - American Indian and Alaska Native
Population - Males (%) - Multirace
Population - Males (%) - Other Race
Population - Females (%) - White
Population - Females (%) - Black or African American
Population - Females (%) - Asian
Population - Females (%) - Hispanic or Latino
Population - Females (%) - American Indian and Alaska Native
Population - Females (%) - Multirace
Population - Females (%) - Other Race
Coronavirus confirmed cases (May 17, 2024)
Deaths caused by coronavirus (May 17, 2024)
Coronavirus confirmed cases (per 100k population) (May 17, 2024)
Deaths caused by coronavirus (per 100k population) (May 17, 2024)
Daily increase in number of cases (May 17, 2024)
Weekly increase in number of cases (May 17, 2024)
Cases doubled (in days) (May 17, 2024)
Hospitalized patients (Apr 18, 2022)
Negative test results (Apr 18, 2022)
Total test results (Apr 18, 2022)
COVID Vaccine doses distributed (per 100k population) (Sep 19, 2023)
COVID Vaccine doses administered (per 100k population) (Sep 19, 2023)
COVID Vaccine doses distributed (Sep 19, 2023)
COVID Vaccine doses administered (Sep 19, 2023)
Likely homosexual households (%)
Likely homosexual households (% change since 2000)
Likely homosexual households - Lesbian couples (%)
Likely homosexual households - Lesbian couples (% change since 2000)
Likely homosexual households - Gay men (%)
Likely homosexual households - Gay men (% change since 2000)
Cost of living index
Median gross rent ($)
Median contract rent ($)
Median monthly housing costs ($)
Median house or condo value ($)
Median house or condo value ($ change since 2000)
Mean house or condo value by units in structure - 1, detached ($)
Mean house or condo value by units in structure - 1, attached ($)
Mean house or condo value by units in structure - 2 ($)
Mean house or condo value by units in structure by units in structure - 3 or 4 ($)
Mean house or condo value by units in structure - 5 or more ($)
Mean house or condo value by units in structure - Boat, RV, van, etc. ($)
Mean house or condo value by units in structure - Mobile home ($)
Median house or condo value ($) - White
Median house or condo value ($) - Black or African American
Median house or condo value ($) - Asian
Median house or condo value ($) - Hispanic or Latino
Median house or condo value ($) - American Indian and Alaska Native
Median house or condo value ($) - Multirace
Median house or condo value ($) - Other Race
Median resident age
Resident age diversity
Median resident age - Males
Median resident age - Females
Median resident age - White
Median resident age - Black or African American
Median resident age - Asian
Median resident age - Hispanic or Latino
Median resident age - American Indian and Alaska Native
Median resident age - Multirace
Median resident age - Other Race
Median resident age - Males - White
Median resident age - Males - Black or African American
Median resident age - Males - Asian
Median resident age - Males - Hispanic or Latino
Median resident age - Males - American Indian and Alaska Native
Median resident age - Males - Multirace
Median resident age - Males - Other Race
Median resident age - Females - White
Median resident age - Females - Black or African American
Median resident age - Females - Asian
Median resident age - Females - Hispanic or Latino
Median resident age - Females - American Indian and Alaska Native
Median resident age - Females - Multirace
Median resident age - Females - Other Race
Commute - mean travel time to work (minutes)
Travel time to work - Less than 5 minutes (%)
Travel time to work - Less than 5 minutes (% change since 2000)
Travel time to work - 5 to 9 minutes (%)
Travel time to work - 5 to 9 minutes (% change since 2000)
Travel time to work - 10 to 19 minutes (%)
Travel time to work - 10 to 19 minutes (% change since 2000)
Travel time to work - 20 to 29 minutes (%)
Travel time to work - 20 to 29 minutes (% change since 2000)
Travel time to work - 30 to 39 minutes (%)
Travel time to work - 30 to 39 minutes (% change since 2000)
Travel time to work - 40 to 59 minutes (%)
Travel time to work - 40 to 59 minutes (% change since 2000)
Travel time to work - 60 to 89 minutes (%)
Travel time to work - 60 to 89 minutes (% change since 2000)
Travel time to work - 90 or more minutes (%)
Travel time to work - 90 or more minutes (% change since 2000)
Marital status - Never married (%)
Marital status - Now married (%)
Marital status - Separated (%)
Marital status - Widowed (%)
Marital status - Divorced (%)
Median family income ($)
Median family income (% change since 2000)
Median non-family income ($)
Median non-family income (% change since 2000)
Median per capita income ($)
Median per capita income (% change since 2000)
Median family income ($) - White
Median family income ($) - Black or African American
Median family income ($) - Asian
Median family income ($) - Hispanic or Latino
Median family income ($) - American Indian and Alaska Native
Median family income ($) - Multirace
Median family income ($) - Other Race
Median year house/condo built
Median year apartment built
Year house built - Built 2005 or later (%)
Year house built - Built 2000 to 2004 (%)
Year house built - Built 1990 to 1999 (%)
Year house built - Built 1980 to 1989 (%)
Year house built - Built 1970 to 1979 (%)
Year house built - Built 1960 to 1969 (%)
Year house built - Built 1950 to 1959 (%)
Year house built - Built 1940 to 1949 (%)
Year house built - Built 1939 or earlier (%)
Average household size
Household density (households per square mile)
Average household size - White
Average household size - Black or African American
Average household size - Asian
Average household size - Hispanic or Latino
Average household size - American Indian and Alaska Native
Average household size - Multirace
Average household size - Other Race
Occupied housing units (%)
Vacant housing units (%)
Owner occupied housing units (%)
Renter occupied housing units (%)
Vacancy status - For rent (%)
Vacancy status - For sale only (%)
Vacancy status - Rented or sold, not occupied (%)
Vacancy status - For seasonal, recreational, or occasional use (%)
Vacancy status - For migrant workers (%)
Vacancy status - Other vacant (%)
Residents with income below the poverty level (%)
Residents with income below 50% of the poverty level (%)
Children below poverty level (%)
Poor families by family type - Married-couple family (%)
Poor families by family type - Male, no wife present (%)
Poor families by family type - Female, no husband present (%)
Poverty status for native-born residents (%)
Poverty status for foreign-born residents (%)
Poverty among high school graduates not in families (%)
Poverty among people who did not graduate high school not in families (%)
Residents with income below the poverty level (%) - White
Residents with income below the poverty level (%) - Black or African American
Residents with income below the poverty level (%) - Asian
Residents with income below the poverty level (%) - Hispanic or Latino
Residents with income below the poverty level (%) - American Indian and Alaska Native
Residents with income below the poverty level (%) - Multirace
Residents with income below the poverty level (%) - Other Race
Air pollution - Air Quality Index (AQI)
Air pollution - CO
Air pollution - NO2
Air pollution - SO2
Air pollution - Ozone
Air pollution - PM10
Air pollution - PM25
Air pollution - Pb
Crime - Murders per 100,000 population
Crime - Rapes per 100,000 population
Crime - Robberies per 100,000 population
Crime - Assaults per 100,000 population
Crime - Burglaries per 100,000 population
Crime - Thefts per 100,000 population
Crime - Auto thefts per 100,000 population
Crime - Arson per 100,000 population
Crime - City-data.com crime index
Crime - Violent crime index
Crime - Property crime index
Crime - Murders per 100,000 population (5 year average)
Crime - Rapes per 100,000 population (5 year average)
Crime - Robberies per 100,000 population (5 year average)
Crime - Assaults per 100,000 population (5 year average)
Crime - Burglaries per 100,000 population (5 year average)
Crime - Thefts per 100,000 population (5 year average)
Crime - Auto thefts per 100,000 population (5 year average)
Crime - Arson per 100,000 population (5 year average)
Crime - City-data.com crime index (5 year average)
Crime - Violent crime index (5 year average)
Crime - Property crime index (5 year average)
1996 Presidential Elections Results (%) - Democratic Party (Clinton)
1996 Presidential Elections Results (%) - Republican Party (Dole)
1996 Presidential Elections Results (%) - Other
2000 Presidential Elections Results (%) - Democratic Party (Gore)
2000 Presidential Elections Results (%) - Republican Party (Bush)
2000 Presidential Elections Results (%) - Other
2004 Presidential Elections Results (%) - Democratic Party (Kerry)
2004 Presidential Elections Results (%) - Republican Party (Bush)
2004 Presidential Elections Results (%) - Other
2008 Presidential Elections Results (%) - Democratic Party (Obama)
2008 Presidential Elections Results (%) - Republican Party (McCain)
2008 Presidential Elections Results (%) - Other
2012 Presidential Elections Results (%) - Democratic Party (Obama)
2012 Presidential Elections Results (%) - Republican Party (Romney)
2012 Presidential Elections Results (%) - Other
2016 Presidential Elections Results (%) - Democratic Party (Clinton)
2016 Presidential Elections Results (%) - Republican Party (Trump)
2016 Presidential Elections Results (%) - Other
2020 Presidential Elections Results (%) - Democratic Party (Biden)
2020 Presidential Elections Results (%) - Republican Party (Trump)
2020 Presidential Elections Results (%) - Other
Ancestries Reported - Arab (%)
Ancestries Reported - Czech (%)
Ancestries Reported - Danish (%)
Ancestries Reported - Dutch (%)
Ancestries Reported - English (%)
Ancestries Reported - French (%)
Ancestries Reported - French Canadian (%)
Ancestries Reported - German (%)
Ancestries Reported - Greek (%)
Ancestries Reported - Hungarian (%)
Ancestries Reported - Irish (%)
Ancestries Reported - Italian (%)
Ancestries Reported - Lithuanian (%)
Ancestries Reported - Norwegian (%)
Ancestries Reported - Polish (%)
Ancestries Reported - Portuguese (%)
Ancestries Reported - Russian (%)
Ancestries Reported - Scotch-Irish (%)
Ancestries Reported - Scottish (%)
Ancestries Reported - Slovak (%)
Ancestries Reported - Subsaharan African (%)
Ancestries Reported - Swedish (%)
Ancestries Reported - Swiss (%)
Ancestries Reported - Ukrainian (%)
Ancestries Reported - United States (%)
Ancestries Reported - Welsh (%)
Ancestries Reported - West Indian (%)
Ancestries Reported - Other (%)
Educational Attainment - No schooling completed (%)
Educational Attainment - Less than high school (%)
Educational Attainment - High school or equivalent (%)
Educational Attainment - Less than 1 year of college (%)
Educational Attainment - 1 or more years of college (%)
Educational Attainment - Associate degree (%)
Educational Attainment - Bachelor's degree (%)
Educational Attainment - Master's degree (%)
Educational Attainment - Professional school degree (%)
Educational Attainment - Doctorate degree (%)
School Enrollment - Nursery, preschool (%)
School Enrollment - Kindergarten (%)
School Enrollment - Grade 1 to 4 (%)
School Enrollment - Grade 5 to 8 (%)
School Enrollment - Grade 9 to 12 (%)
School Enrollment - College undergrad (%)
School Enrollment - Graduate or professional (%)
School Enrollment - Not enrolled in school (%)
School enrollment - Public schools (%)
School enrollment - Private schools (%)
School enrollment - Not enrolled (%)
Median number of rooms in houses and condos
Median number of rooms in apartments
Housing units lacking complete plumbing facilities (%)
Housing units lacking complete kitchen facilities (%)
Density of houses
Urban houses (%)
Rural houses (%)
Households with people 60 years and over (%)
Households with people 65 years and over (%)
Households with people 75 years and over (%)
Households with one or more nonrelatives (%)
Households with no nonrelatives (%)
Population in households (%)
Family households (%)
Nonfamily households (%)
Population in families (%)
Family households with own children (%)
Median number of bedrooms in owner occupied houses
Mean number of bedrooms in owner occupied houses
Median number of bedrooms in renter occupied houses
Mean number of bedrooms in renter occupied houses
Median number of vehichles in owner occupied houses
Mean number of vehichles in owner occupied houses
Median number of vehichles in renter occupied houses
Mean number of vehichles in renter occupied houses
Mortgage status - with mortgage (%)
Mortgage status - with second mortgage (%)
Mortgage status - with home equity loan (%)
Mortgage status - with both second mortgage and home equity loan (%)
Mortgage status - without a mortgage (%)
Average family size
Average family size - White
Average family size - Black or African American
Average family size - Asian
Average family size - Hispanic or Latino
Average family size - American Indian and Alaska Native
Average family size - Multirace
Average family size - Other Race
Geographical mobility - Same house 1 year ago (%)
Geographical mobility - Moved within same county (%)
Geographical mobility - Moved from different county within same state (%)
Geographical mobility - Moved from different state (%)
Geographical mobility - Moved from abroad (%)
Place of birth - Born in state of residence (%)
Place of birth - Born in other state (%)
Place of birth - Native, outside of US (%)
Place of birth - Foreign born (%)
Housing units in structures - 1, detached (%)
Housing units in structures - 1, attached (%)
Housing units in structures - 2 (%)
Housing units in structures - 3 or 4 (%)
Housing units in structures - 5 to 9 (%)
Housing units in structures - 10 to 19 (%)
Housing units in structures - 20 to 49 (%)
Housing units in structures - 50 or more (%)
Housing units in structures - Mobile home (%)
Housing units in structures - Boat, RV, van, etc. (%)
House/condo owner moved in on average (years ago)
Renter moved in on average (years ago)
Year householder moved into unit - Moved in 1999 to March 2000 (%)
Year householder moved into unit - Moved in 1995 to 1998 (%)
Year householder moved into unit - Moved in 1990 to 1994 (%)
Year householder moved into unit - Moved in 1980 to 1989 (%)
Year householder moved into unit - Moved in 1970 to 1979 (%)
Year householder moved into unit - Moved in 1969 or earlier (%)
Means of transportation to work - Drove car alone (%)
Means of transportation to work - Carpooled (%)
Means of transportation to work - Public transportation (%)
Means of transportation to work - Bus or trolley bus (%)
Means of transportation to work - Streetcar or trolley car (%)
Means of transportation to work - Subway or elevated (%)
Means of transportation to work - Railroad (%)
Means of transportation to work - Ferryboat (%)
Means of transportation to work - Taxicab (%)
Means of transportation to work - Motorcycle (%)
Means of transportation to work - Bicycle (%)
Means of transportation to work - Walked (%)
Means of transportation to work - Other means (%)
Working at home (%)
Industry diversity
Most Common Industries - Agriculture, forestry, fishing and hunting, and mining (%)
Most Common Industries - Agriculture, forestry, fishing and hunting (%)
Most Common Industries - Mining, quarrying, and oil and gas extraction (%)
Most Common Industries - Construction (%)
Most Common Industries - Manufacturing (%)
Most Common Industries - Wholesale trade (%)
Most Common Industries - Retail trade (%)
Most Common Industries - Transportation and warehousing, and utilities (%)
Most Common Industries - Transportation and warehousing (%)
Most Common Industries - Utilities (%)
Most Common Industries - Information (%)
Most Common Industries - Finance and insurance, and real estate and rental and leasing (%)
Most Common Industries - Finance and insurance (%)
Most Common Industries - Real estate and rental and leasing (%)
Most Common Industries - Professional, scientific, and management, and administrative and waste management services (%)
Most Common Industries - Professional, scientific, and technical services (%)
Most Common Industries - Management of companies and enterprises (%)
Most Common Industries - Administrative and support and waste management services (%)
Most Common Industries - Educational services, and health care and social assistance (%)
Most Common Industries - Educational services (%)
Most Common Industries - Health care and social assistance (%)
Most Common Industries - Arts, entertainment, and recreation, and accommodation and food services (%)
Most Common Industries - Arts, entertainment, and recreation (%)
Most Common Industries - Accommodation and food services (%)
Most Common Industries - Other services, except public administration (%)
Most Common Industries - Public administration (%)
Occupation diversity
Most Common Occupations - Management, business, science, and arts occupations (%)
Most Common Occupations - Management, business, and financial occupations (%)
Most Common Occupations - Management occupations (%)
Most Common Occupations - Business and financial operations occupations (%)
Most Common Occupations - Computer, engineering, and science occupations (%)
Most Common Occupations - Computer and mathematical occupations (%)
Most Common Occupations - Architecture and engineering occupations (%)
Most Common Occupations - Life, physical, and social science occupations (%)
Most Common Occupations - Education, legal, community service, arts, and media occupations (%)
Most Common Occupations - Community and social service occupations (%)
Most Common Occupations - Legal occupations (%)
Most Common Occupations - Education, training, and library occupations (%)
Most Common Occupations - Arts, design, entertainment, sports, and media occupations (%)
Most Common Occupations - Healthcare practitioners and technical occupations (%)
Most Common Occupations - Health diagnosing and treating practitioners and other technical occupations (%)
Most Common Occupations - Health technologists and technicians (%)
Most Common Occupations - Service occupations (%)
Most Common Occupations - Healthcare support occupations (%)
Most Common Occupations - Protective service occupations (%)
Most Common Occupations - Fire fighting and prevention, and other protective service workers including supervisors (%)
Most Common Occupations - Law enforcement workers including supervisors (%)
Most Common Occupations - Food preparation and serving related occupations (%)
Most Common Occupations - Building and grounds cleaning and maintenance occupations (%)
Most Common Occupations - Personal care and service occupations (%)
Most Common Occupations - Sales and office occupations (%)
Most Common Occupations - Sales and related occupations (%)
Most Common Occupations - Office and administrative support occupations (%)
Most Common Occupations - Natural resources, construction, and maintenance occupations (%)
Most Common Occupations - Farming, fishing, and forestry occupations (%)
Most Common Occupations - Construction and extraction occupations (%)
Most Common Occupations - Installation, maintenance, and repair occupations (%)
Most Common Occupations - Production, transportation, and material moving occupations (%)
Most Common Occupations - Production occupations (%)
Most Common Occupations - Transportation occupations (%)
Most Common Occupations - Material moving occupations (%)
People in Group quarters - Institutionalized population (%)
People in Group quarters - Correctional institutions (%)
People in Group quarters - Federal prisons and detention centers (%)
People in Group quarters - Halfway houses (%)
People in Group quarters - Local jails and other confinement facilities (including police lockups) (%)
People in Group quarters - Military disciplinary barracks (%)
People in Group quarters - State prisons (%)
People in Group quarters - Other types of correctional institutions (%)
People in Group quarters - Nursing homes (%)
People in Group quarters - Hospitals/wards, hospices, and schools for the handicapped (%)
People in Group quarters - Hospitals/wards and hospices for chronically ill (%)
People in Group quarters - Hospices or homes for chronically ill (%)
People in Group quarters - Military hospitals or wards for chronically ill (%)
People in Group quarters - Other hospitals or wards for chronically ill (%)
People in Group quarters - Hospitals or wards for drug/alcohol abuse (%)
People in Group quarters - Mental (Psychiatric) hospitals or wards (%)
People in Group quarters - Schools, hospitals, or wards for the mentally retarded (%)
People in Group quarters - Schools, hospitals, or wards for the physically handicapped (%)
People in Group quarters - Institutions for the deaf (%)
People in Group quarters - Institutions for the blind (%)
People in Group quarters - Orthopedic wards and institutions for the physically handicapped (%)
People in Group quarters - Wards in general hospitals for patients who have no usual home elsewhere (%)
People in Group quarters - Wards in military hospitals for patients who have no usual home elsewhere (%)
People in Group quarters - Juvenile institutions (%)
People in Group quarters - Long-term care (%)
People in Group quarters - Homes for abused, dependent, and neglected children (%)
People in Group quarters - Residential treatment centers for emotionally disturbed children (%)
People in Group quarters - Training schools for juvenile delinquents (%)
People in Group quarters - Short-term care, detention or diagnostic centers for delinquent children (%)
People in Group quarters - Type of juvenile institution unknown (%)
People in Group quarters - Noninstitutionalized population (%)
People in Group quarters - College dormitories (includes college quarters off campus) (%)
People in Group quarters - Military quarters (%)
People in Group quarters - On base (%)
People in Group quarters - Barracks, unaccompanied personnel housing (UPH), (Enlisted/Officer), ;and similar group living quarters for military personnel (%)
People in Group quarters - Transient quarters for temporary residents (%)
People in Group quarters - Military ships (%)
People in Group quarters - Group homes (%)
People in Group quarters - Homes or halfway houses for drug/alcohol abuse (%)
People in Group quarters - Homes for the mentally ill (%)
People in Group quarters - Homes for the mentally retarded (%)
People in Group quarters - Homes for the physically handicapped (%)
People in Group quarters - Other group homes (%)
People in Group quarters - Religious group quarters (%)
People in Group quarters - Dormitories (%)
People in Group quarters - Agriculture workers' dormitories on farms (%)
People in Group quarters - Job Corps and vocational training facilities (%)
People in Group quarters - Other workers' dormitories (%)
People in Group quarters - Crews of maritime vessels (%)
People in Group quarters - Other nonhousehold living situations (%)
People in Group quarters - Other noninstitutional group quarters (%)
Residents speaking English at home (%)
Residents speaking English at home - Born in the United States (%)
Residents speaking English at home - Native, born elsewhere (%)
Residents speaking English at home - Foreign born (%)
Residents speaking Spanish at home (%)
Residents speaking Spanish at home - Born in the United States (%)
Residents speaking Spanish at home - Native, born elsewhere (%)
Residents speaking Spanish at home - Foreign born (%)
Residents speaking other language at home (%)
Residents speaking other language at home - Born in the United States (%)
Residents speaking other language at home - Native, born elsewhere (%)
Residents speaking other language at home - Foreign born (%)
Class of Workers - Employee of private company (%)
Class of Workers - Self-employed in own incorporated business (%)
Class of Workers - Private not-for-profit wage and salary workers (%)
Class of Workers - Local government workers (%)
Class of Workers - State government workers (%)
Class of Workers - Federal government workers (%)
Class of Workers - Self-employed workers in own not incorporated business and Unpaid family workers (%)
House heating fuel used in houses and condos - Utility gas (%)
House heating fuel used in houses and condos - Bottled, tank, or LP gas (%)
House heating fuel used in houses and condos - Electricity (%)
House heating fuel used in houses and condos - Fuel oil, kerosene, etc. (%)
House heating fuel used in houses and condos - Coal or coke (%)
House heating fuel used in houses and condos - Wood (%)
House heating fuel used in houses and condos - Solar energy (%)
House heating fuel used in houses and condos - Other fuel (%)
House heating fuel used in houses and condos - No fuel used (%)
House heating fuel used in apartments - Utility gas (%)
House heating fuel used in apartments - Bottled, tank, or LP gas (%)
House heating fuel used in apartments - Electricity (%)
House heating fuel used in apartments - Fuel oil, kerosene, etc. (%)
House heating fuel used in apartments - Coal or coke (%)
House heating fuel used in apartments - Wood (%)
House heating fuel used in apartments - Solar energy (%)
House heating fuel used in apartments - Other fuel (%)
House heating fuel used in apartments - No fuel used (%)
Armed forces status - In Armed Forces (%)
Armed forces status - Civilian (%)
Armed forces status - Civilian - Veteran (%)
Armed forces status - Civilian - Nonveteran (%)
Fatal accidents locations in years 2005-2021
Fatal accidents locations in 2005
Fatal accidents locations in 2006
Fatal accidents locations in 2007
Fatal accidents locations in 2008
Fatal accidents locations in 2009
Fatal accidents locations in 2010
Fatal accidents locations in 2011
Fatal accidents locations in 2012
Fatal accidents locations in 2013
Fatal accidents locations in 2014
Fatal accidents locations in 2015
Fatal accidents locations in 2016
Fatal accidents locations in 2017
Fatal accidents locations in 2018
Fatal accidents locations in 2019
Fatal accidents locations in 2020
Fatal accidents locations in 2021
Alcohol use - People drinking some alcohol every month (%)
Alcohol use - People not drinking at all (%)
Alcohol use - Average days/month drinking alcohol
Alcohol use - Average drinks/week
Alcohol use - Average days/year people drink much
Audiometry - Average condition of hearing (%)
Audiometry - People that can hear a whisper from across a quiet room (%)
Audiometry - People that can hear normal voice from across a quiet room (%)
Audiometry - Ears ringing, roaring, buzzing (%)
Audiometry - Had a job exposure to loud noise (%)
Audiometry - Had off-work exposure to loud noise (%)
Blood Pressure & Cholesterol - Has high blood pressure (%)
Blood Pressure & Cholesterol - Checking blood pressure at home (%)
Blood Pressure & Cholesterol - Frequently checking blood cholesterol (%)
Blood Pressure & Cholesterol - Has high cholesterol level (%)
Consumer Behavior - Money monthly spent on food at supermarket/grocery store
Consumer Behavior - Money monthly spent on food at other stores
Consumer Behavior - Money monthly spent on eating out
Consumer Behavior - Money monthly spent on carryout/delivered foods
Consumer Behavior - Income spent on food at supermarket/grocery store (%)
Consumer Behavior - Income spent on food at other stores (%)
Consumer Behavior - Income spent on eating out (%)
Consumer Behavior - Income spent on carryout/delivered foods (%)
Current Health Status - General health condition (%)
Current Health Status - Blood donors (%)
Current Health Status - Has blood ever tested for HIV virus (%)
Current Health Status - Left-handed people (%)
Dermatology - People using sunscreen (%)
Diabetes - Diabetics (%)
Diabetes - Had a blood test for high blood sugar (%)
Diabetes - People taking insulin (%)
Diet Behavior & Nutrition - Diet health (%)
Diet Behavior & Nutrition - Milk product consumption (# of products/month)
Diet Behavior & Nutrition - Meals not home prepared (#/week)
Diet Behavior & Nutrition - Meals from fast food or pizza place (#/week)
Diet Behavior & Nutrition - Ready-to-eat foods (#/month)
Diet Behavior & Nutrition - Frozen meals/pizza (#/month)
Drug Use - People that ever used marijuana or hashish (%)
Drug Use - Ever used hard drugs (%)
Drug Use - Ever used any form of cocaine (%)
Drug Use - Ever used heroin (%)
Drug Use - Ever used methamphetamine (%)
Health Insurance - People covered by health insurance (%)
Kidney Conditions-Urology - Avg. # of times urinating at night
Medical Conditions - People with asthma (%)
Medical Conditions - People with anemia (%)
Medical Conditions - People with psoriasis (%)
Medical Conditions - People with overweight (%)
Medical Conditions - Elderly people having difficulties in thinking or remembering (%)
Medical Conditions - People who ever received blood transfusion (%)
Medical Conditions - People having trouble seeing even with glass/contacts (%)
Medical Conditions - People with arthritis (%)
Medical Conditions - People with gout (%)
Medical Conditions - People with congestive heart failure (%)
Medical Conditions - People with coronary heart disease (%)
Medical Conditions - People with angina pectoris (%)
Medical Conditions - People who ever had heart attack (%)
Medical Conditions - People who ever had stroke (%)
Medical Conditions - People with emphysema (%)
Medical Conditions - People with thyroid problem (%)
Medical Conditions - People with chronic bronchitis (%)
Medical Conditions - People with any liver condition (%)
Medical Conditions - People who ever had cancer or malignancy (%)
Mental Health - People who have little interest in doing things (%)
Mental Health - People feeling down, depressed, or hopeless (%)
Mental Health - People who have trouble sleeping or sleeping too much (%)
Mental Health - People feeling tired or having little energy (%)
Mental Health - People with poor appetite or overeating (%)
Mental Health - People feeling bad about themself (%)
Mental Health - People who have trouble concentrating on things (%)
Mental Health - People moving or speaking slowly or too fast (%)
Mental Health - People having thoughts they would be better off dead (%)
Oral Health - Average years since last visit a dentist
Oral Health - People embarrassed because of mouth (%)
Oral Health - People with gum disease (%)
Oral Health - General health of teeth and gums (%)
Oral Health - Average days a week using dental floss/device
Oral Health - Average days a week using mouthwash for dental problem
Oral Health - Average number of teeth
Pesticide Use - Households using pesticides to control insects (%)
Pesticide Use - Households using pesticides to kill weeds (%)
Physical Activity - People doing vigorous-intensity work activities (%)
Physical Activity - People doing moderate-intensity work activities (%)
Physical Activity - People walking or bicycling (%)
Physical Activity - People doing vigorous-intensity recreational activities (%)
Physical Activity - People doing moderate-intensity recreational activities (%)
Physical Activity - Average hours a day doing sedentary activities
Physical Activity - Average hours a day watching TV or videos
Physical Activity - Average hours a day using computer
Physical Functioning - People having limitations keeping them from working (%)
Physical Functioning - People limited in amount of work they can do (%)
Physical Functioning - People that need special equipment to walk (%)
Physical Functioning - People experiencing confusion/memory problems (%)
Physical Functioning - People requiring special healthcare equipment (%)
Prescription Medications - Average number of prescription medicines taking
Preventive Aspirin Use - Adults 40+ taking low-dose aspirin (%)
Reproductive Health - Vaginal deliveries (%)
Reproductive Health - Cesarean deliveries (%)
Reproductive Health - Deliveries resulted in a live birth (%)
Reproductive Health - Pregnancies resulted in a delivery (%)
Reproductive Health - Women breastfeeding newborns (%)
Reproductive Health - Women that had a hysterectomy (%)
Reproductive Health - Women that had both ovaries removed (%)
Reproductive Health - Women that have ever taken birth control pills (%)
Reproductive Health - Women taking birth control pills (%)
Reproductive Health - Women that have ever used Depo-Provera or injectables (%)
Reproductive Health - Women that have ever used female hormones (%)
Sexual Behavior - People 18+ that ever had sex (vaginal, anal, or oral) (%)
Sexual Behavior - Males 18+ that ever had vaginal sex with a woman (%)
Sexual Behavior - Males 18+ that ever performed oral sex on a woman (%)
Sexual Behavior - Males 18+ that ever had anal sex with a woman (%)
Sexual Behavior - Males 18+ that ever had any sex with a man (%)
Sexual Behavior - Females 18+ that ever had vaginal sex with a man (%)
Sexual Behavior - Females 18+ that ever performed oral sex on a man (%)
Sexual Behavior - Females 18+ that ever had anal sex with a man (%)
Sexual Behavior - Females 18+ that ever had any kind of sex with a woman (%)
Sexual Behavior - Average age people first had sex
Sexual Behavior - Average number of female sex partners in lifetime (males 18+)
Sexual Behavior - Average number of female vaginal sex partners in lifetime (males 18+)
Sexual Behavior - Average age people first performed oral sex on a woman (18+)
Sexual Behavior - Average number of woman performed oral sex on in lifetime (18+)
Sexual Behavior - Average number of male sex partners in lifetime (males 18+)
Sexual Behavior - Average number of male anal sex partners in lifetime (males 18+)
Sexual Behavior - Average age people first performed oral sex on a man (18+)
Sexual Behavior - Average number of male oral sex partners in lifetime (18+)
Sexual Behavior - People using protection when performing oral sex (%)
Sexual Behavior - Average number of times people have vaginal or anal sex a year
Sexual Behavior - People having sex without condom (%)
Sexual Behavior - Average number of male sex partners in lifetime (females 18+)
Sexual Behavior - Average number of male vaginal sex partners in lifetime (females 18+)
Sexual Behavior - Average number of female sex partners in lifetime (females 18+)
Sexual Behavior - Circumcised males 18+ (%)
Sleep Disorders - Average hours sleeping at night
Sleep Disorders - People that has trouble sleeping (%)
Smoking-Cigarette Use - People smoking cigarettes (%)
Taste & Smell - People 40+ having problems with smell (%)
Taste & Smell - People 40+ having problems with taste (%)
Taste & Smell - People 40+ that ever had wisdom teeth removed (%)
Taste & Smell - People 40+ that ever had tonsils teeth removed (%)
Taste & Smell - People 40+ that ever had a loss of consciousness because of a head injury (%)
Taste & Smell - People 40+ that ever had a broken nose or other serious injury to face or skull (%)
Taste & Smell - People 40+ that ever had two or more sinus infections (%)
Weight - Average height (inches)
Weight - Average weight (pounds)
Weight - Average BMI
Weight - People that are obese (%)
Weight - People that ever were obese (%)
Weight - People trying to lose weight (%)
Urban population: 25,698
Rural population: 3,635
Estimated median house/condo value in 2022: $231,178
37664:
$231,178Tennessee:
$284,800
According to our research of Tennessee and other state lists, there were 34 registered sex offenders living in 37664 zip code as of May 17, 2024 . The ratio of all residents to sex offenders in zip code 37664 is 788 to 1.The ratio of registered sex offenders to all residents in this zip code is lower than the state average.
Median resident age: This zip code:
46.4 yearsTennessee median age:
39.2 years
Average household size: This zip code:
2.2 peopleTennessee:
2.4 people
Averages for the 2020 tax year for zip code 37664, filed in 2021:
Average Adjusted Gross Income (AGI) in 2020: $64,968 (Individual Income Tax Returns) Here:
$64,968State:
$69,014
Salary/wage: $56,008 (reported on 79.1% of returns )Here:
$56,008State:
$55,872
(% of AGI for various income ranges: 1025.9% for AGIs below $25k , 3256.5% for AGIs $25k-50k , 5681.3% for AGIs $50k-75k , 8038.8% for AGIs $75k-100k , 15596.5% for AGIs $100k-200k , 63172.6% for AGIs over 200k ) Taxable interest for individuals: $1,187 (reported on 49.1% of returns )This zip code:
$1,187Tennessee:
$1,945
(% of AGI for various income ranges: 24.8% for AGIs below $25k , 31.4% for AGIs $25k-50k , 79.2% for AGIs $50k-75k , 115.3% for AGIs $75k-100k , 165.0% for AGIs $100k-200k , 902.6% for AGIs over 200k ) Ordinary dividends: $5,845 (reported on 16.9% of returns )(% of AGI for various income ranges: 15.0% for AGIs below $25k , 32.0% for AGIs $25k-50k , 58.5% for AGIs $50k-75k , 112.2% for AGIs $75k-100k , 338.4% for AGIs $100k-200k , 2708.7% for AGIs over 200k ) Net capital gain/loss in AGI: +$15,097 (reported on 15.9% of returns )Here:
+$15,097State:
+$33,664
(% of AGI for various income ranges: 8.6% for AGIs below $25k , 33.2% for AGIs $25k-50k , 79.3% for AGIs $50k-75k , 196.3% for AGIs $75k-100k , 534.0% for AGIs $100k-200k , 9668.3% for AGIs over 200k ) Profit/loss from business: +$18,646 (reported on 14.1% of returns )Here:
+$18,646State:
+$18,991
(% of AGI for various income ranges: 91.8% for AGIs below $25k , 132.9% for AGIs $25k-50k , 156.4% for AGIs $50k-75k , 221.8% for AGIs $75k-100k , 761.8% for AGIs $100k-200k , 6750.9% for AGIs over 200k ) Taxable individual retirement arrangement distribution: $28,914 (reported on 13.8% of returns )37664:
$28,914Tennessee:
$20,036
(% of AGI for various income ranges: 94.1% for AGIs below $25k , 183.7% for AGIs $25k-50k , 427.7% for AGIs $50k-75k , 705.2% for AGIs $75k-100k , 1441.2% for AGIs $100k-200k , 7223.9% for AGIs over 200k ) Self-employed (Keogh) retirement plans: $20,786 (reported on 0.5% of returns )37664:
$20,786Tennessee:
$28,955
(% of AGI for various income ranges: 40.0% for AGIs $75k-100k , 477.8% for AGIs over 200k ) Total itemized deductions: $35,717 (reported on 4.8% of returns )Here:
$35,717State:
$40,136
(% of AGI for various income ranges: 22.5% for AGIs below $25k , 66.7% for AGIs $25k-50k , 151.8% for AGIs $50k-75k , 200.1% for AGIs $75k-100k , 581.8% for AGIs $100k-200k , 4418.3% for AGIs over 200k ) Charity contributions: $17,109 (reported on 4.2% of returns )Here:
$17,109State:
$19,852
(% of AGI for various income ranges: 1.5% for AGIs below $25k , 8.2% for AGIs $25k-50k , 24.6% for AGIs $50k-75k , 69.9% for AGIs $75k-100k , 242.1% for AGIs $100k-200k , 2439.6% for AGIs over 200k ) Taxes paid: $5,966 (reported on 4.8% of returns )(% of AGI for various income ranges: 2.3% for AGIs below $25k , 7.0% for AGIs $25k-50k , 20.1% for AGIs $50k-75k , 30.1% for AGIs $75k-100k , 107.8% for AGIs $100k-200k , 774.8% for AGIs over 200k ) Earned income credit: $2,162 (reported on 16.7% of returns )(% of AGI for various income ranges: 82.6% for AGIs below $25k , 64.7% for AGIs $25k-50k , 1.2% for AGIs $50k-75k ) Percentage of individuals using paid preparers for their 2020 taxes: 94.0%(% for various income ranges: 93.6% for AGIs below $25k , 94.5% for AGIs $25k-50k , 94.0% for AGIs $50k-75k , 93.3% for AGIs $75k-100k , 94.1% for AGIs $100k-200k , 96.6% for AGIs over 200k )
Averages for the 2012 tax year for zip code 37664, filed in 2013:
Average Adjusted Gross Income (AGI) in 2012: $57,703 (Individual Income Tax Returns) Here:
$57,703State:
$53,767
Salary/wage: $51,771 (reported on 82.7% of returns )Here:
$51,771State:
$45,421
(% of AGI for various income ranges: 70.9% for AGIs below $25k , 75.7% for AGIs $25k-50k , 73.8% for AGIs $50k-75k , 74.0% for AGIs $75k-100k , 76.5% for AGIs $100k-200k , 72.6% for AGIs over 200k ) Taxable interest for individuals: $1,280 (reported on 47.0% of returns )This zip code:
$1,280Tennessee:
$1,732
(% of AGI for various income ranges: 2.0% for AGIs below $25k , 1.0% for AGIs $25k-50k , 1.1% for AGIs $50k-75k , 0.8% for AGIs $75k-100k , 1.0% for AGIs $100k-200k , 0.8% for AGIs over 200k ) Ordinary dividends: $4,290 (reported on 17.5% of returns )(% of AGI for various income ranges: 1.1% for AGIs below $25k , 0.8% for AGIs $25k-50k , 0.7% for AGIs $50k-75k , 0.8% for AGIs $75k-100k , 1.5% for AGIs $100k-200k , 2.0% for AGIs over 200k ) Net capital gain/loss in AGI: +$9,280 (reported on 14.2% of returns )Here:
+$9,280State:
+$19,082
(% of AGI for various income ranges: 0.1% for AGIs $25k-50k , 0.2% for AGIs $50k-75k , 1.2% for AGIs $75k-100k , 1.4% for AGIs $100k-200k , 6.7% for AGIs over 200k ) Profit/loss from business: +$17,709 (reported on 13.7% of returns )Here:
+$17,709State:
+$15,240
(% of AGI for various income ranges: 6.4% for AGIs below $25k , 2.9% for AGIs $25k-50k , 2.6% for AGIs $50k-75k , 1.7% for AGIs $75k-100k , 3.2% for AGIs $100k-200k , 7.2% for AGIs over 200k ) Taxable individual retirement arrangement distribution: $18,897 (reported on 14.1% of returns )37664:
$18,897Tennessee:
$15,505
(% of AGI for various income ranges: 5.9% for AGIs below $25k , 5.4% for AGIs $25k-50k , 4.9% for AGIs $50k-75k , 6.2% for AGIs $75k-100k , 4.5% for AGIs $100k-200k , 3.0% for AGIs over 200k ) Self-employment retirement plans: $21,033 (reported on 0.5% of returns )37664:
$21,033Tennessee:
$22,567
Total itemized deductions: $21,241 (16% of AGI, reported on 22.8% of returns )Here:
$21,241State:
$21,976
Here:
15.9% of AGIState:
17.8% of AGI
(% of AGI for various income ranges: 6.1% for AGIs below $25k , 7.2% for AGIs $25k-50k , 8.0% for AGIs $50k-75k , 9.0% for AGIs $75k-100k , 11.0% for AGIs $100k-200k , 7.3% for AGIs over 200k ) Charity contributions: $7,068 (reported on 19.4% of returns )(% of AGI for various income ranges: 0.7% for AGIs below $25k , 1.1% for AGIs $25k-50k , 1.7% for AGIs $50k-75k , 2.6% for AGIs $75k-100k , 3.5% for AGIs $100k-200k , 2.8% for AGIs over 200k ) Taxes paid: $4,787 (reported on 22.6% of returns )(% of AGI for various income ranges: 0.9% for AGIs below $25k , 1.2% for AGIs $25k-50k , 1.6% for AGIs $50k-75k , 1.9% for AGIs $75k-100k , 2.7% for AGIs $100k-200k , 1.9% for AGIs over 200k ) Earned income credit: $2,134 (reported on 18.9% of returns )(% of AGI for various income ranges: 6.2% for AGIs below $25k , 1.1% for AGIs $25k-50k ) Percentage of individuals using paid preparers for their 2012 taxes: 48.8%(% for various income ranges: 45.9% for AGIs below $25k , 49.6% for AGIs $25k-50k , 52.1% for AGIs $50k-75k , 48.6% for AGIs $75k-100k , 48.4% for AGIs $100k-200k , 70.3% for AGIs over 200k )
Averages for the 2004 tax year for zip code 37664, filed in 2005:
Average Adjusted Gross Income (AGI) in 2004: $47,189 (Individual Income Tax Returns) Here:
$47,189State:
$44,088
Salary/wage: $41,187 (reported on 83.4% of returns )Here:
$41,187State:
$38,825
(% of AGI for various income ranges: 85.2% for AGIs below $10k , 71.0% for AGIs $10k-25k , 75.7% for AGIs $25k-50k , 77.3% for AGIs $50k-75k , 80.0% for AGIs $75k-100k , 66.7% for AGIs over 100k ) Taxable interest for individuals: $1,686 (reported on 54.7% of returns )This zip code:
$1,686Tennessee:
$1,802
(% of AGI for various income ranges: 5.6% for AGIs below $10k , 3.6% for AGIs $10k-25k , 2.2% for AGIs $25k-50k , 1.7% for AGIs $50k-75k , 1.5% for AGIs $75k-100k , 1.6% for AGIs over 100k ) Taxable dividends: $2,988 (reported on 29.3% of returns )(% of AGI for various income ranges: 2.3% for AGIs below $10k , 1.3% for AGIs $10k-25k , 1.2% for AGIs $25k-50k , 1.1% for AGIs $50k-75k , 1.4% for AGIs $75k-100k , 2.7% for AGIs over 100k ) Net capital gain/loss: +$13,391 (reported on 17.4% of returns )Here:
+$13,391State:
+$15,776
(% of AGI for various income ranges: -1.3% for AGIs below $10k , 0.3% for AGIs $10k-25k , 0.9% for AGIs $25k-50k , 1.1% for AGIs $50k-75k , 1.1% for AGIs $75k-100k , 11.3% for AGIs over 100k ) Profit/loss from business: +$13,211 (reported on 13.9% of returns )Here:
+$13,211State:
+$12,882
(% of AGI for various income ranges: 6.9% for AGIs below $10k , 3.8% for AGIs $10k-25k , 2.0% for AGIs $25k-50k , 2.2% for AGIs $50k-75k , 1.7% for AGIs $75k-100k , 6.2% for AGIs over 100k ) IRA payment deduction: $3,027 (reported on 2.2% of returns )37664:
$3,027Tennessee:
$2,934
(% of AGI for various income ranges: 0.2% for AGIs $10k-25k , 0.2% for AGIs $25k-50k , 0.1% for AGIs $50k-75k , 0.2% for AGIs $75k-100k , 0.1% for AGIs over 100k ) Self-employed pension: $16,456 (reported on 0.5% of returns )Here:
$16,456Tennessee:
$16,857
Total itemized deductions: $17,366 (18% of AGI, reported on 24.8% of returns )Here:
$17,366State:
$18,035
Here:
17.7% of AGIState:
19.9% of AGI
(% of AGI for various income ranges: 6.5% for AGIs below $10k , 5.7% for AGIs $10k-25k , 8.0% for AGIs $25k-50k , 10.3% for AGIs $50k-75k , 12.0% for AGIs $75k-100k , 9.0% for AGIs over 100k ) Charity contributions deductions: $5,590 (5% of AGI, reported on 22.1% of returns )Here:
5.5% of AGIState:
5.3% of AGI
(% of AGI for various income ranges: 0.5% for AGIs below $10k , 0.8% for AGIs $10k-25k , 1.5% for AGIs $25k-50k , 2.3% for AGIs $50k-75k , 3.4% for AGIs $75k-100k , 3.5% for AGIs over 100k ) Total tax: $7,797 (reported on 75.1% of returns )(% of AGI for various income ranges: 2.8% for AGIs below $10k , 3.9% for AGIs $10k-25k , 6.8% for AGIs $25k-50k , 8.7% for AGIs $50k-75k , 10.5% for AGIs $75k-100k , 19.8% for AGIs over 100k ) Earned income credit: $1,672 (reported on 15.9% of returns )Percentage of individuals using paid preparers for their 2004 taxes: 55.4%(% for various income ranges: 49.8% for AGIs below $10k , 59.1% for AGIs $10k-25k , 58.9% for AGIs $25k-50k , 56.2% for AGIs $50k-75k , 48.0% for AGIs $75k-100k , 54.5% for AGIs over 100k )
Estimated median household income in 2022: This zip code:
$60,100Tennessee:
$65,254
Nearest zip codes: 37663 ,
37660 ,
37665 ,
24290 ,
37615 ,
37617 .
Kingsport Zip Code Map
Percentage of family households: This zip code:
41.1%Tennessee:
46.2%
Percentage of households with unmarried partners: This zip code:
3.7%Tennessee:
47.1%
No gay or lesbian households reported
Household received Food Stamps/SNAP in the past 12 months: 1,513Household did not receive Food Stamps/SNAP in the past 12 months: 11,720
Women who had a birth in the past 12 months: 255 (168 now married , 87 unmarried) Women who did not have a birth in the past 12 months: 5,979 (2,795 now married , 3,184 unmarried)
Housing units in zip code 37664 with a mortgage: 4,858 (342
second mortgage , 282
both second mortgage and home equity loan )
Houses without a mortgage: 148
Median monthly owner costs for units with a mortgage: $1,265
Median monthly owner costs for units without a mortgage: $421
Residents with income below the poverty level in 2022:
This zip code:
14.7%Whole state:
13.3%
Residents with income below 50% of the poverty level in 2022:
This zip code:
8.2%Whole state:
7.1%
Median number of rooms in houses and condos: Median number of rooms in apartments: Notable locations in this zip code not listed on our city pages
Click to draw/clear zip code borders Notable locations in zip code 37664: (A) , Civilian Conservation Corps Camp Number 2427 (B) , Kingsport Fire Department Station 2 (C) , Kingsport Fire Department Station 3 (D) . Display/hide their locations on the map
Shopping Centers: (1) , Green Acres Shopping Center (2) , Fort Henry Mall Shopping Center (3) , Crown Point Shopping Center (4) . Display/hide their locations on the map
Churches in zip code 37664 include: (A) , Calvary Baptist Church (B) , Fall Creek Church (C) , Glenwood Baptist Church (D) , Indian Springs Baptist Church (E) , Litz Manor Baptist Church (F) , Rock Springs United Methodist Church (G) , Saint Dominics Catholic Church (H) , Saint Matthew United Methodist Church (I) . Display/hide their locations on the map
Cemeteries: (1) , Thomas Cemetery (2) , Wells Cemetery (3) , White Cemetery (4) , Baxter Cemetery (5) , Roller Cemetery (6) , Gaines Cemetery (7) . Display/hide their locations on the map
Streams, rivers, and creeks: (A) , Cooks Valley Branch (B) , Cedar Branch (C) , Peaveler Branch (D) , Miller Branch (E) . Display/hide their locations on the map
Park in zip code 37664: (1) . Display/hide its location on the map
Year house built (houses)
0 2020 or later1,322 2010 to 20191,285 2000 to 20091,641 1990 to 19991,705 1980 to 19891,645 1970 to 19791,755 1960 to 19692,038 1950 to 19591,523 1940 to 19491,084 1939 or earlier
Zip code 37664 household income distribution in 2022 597 Less than $10,000852 $10,000 to $14,999721 $15,000 to $19,999687 $20,000 to $24,999572 $25,000 to $29,999703 $30,000 to $34,999445 $35,000 to $39,999570 $40,000 to $44,999597 $45,000 to $49,999808 $50,000 to $59,9991,297 $60,000 to $74,9991,393 $75,000 to $99,9991,259 $100,000 to $124,999629 $125,000 to $149,9991,165 $150,000 to $199,999889 $200,000 or moreEstimate of home value of owner-occupied houses/condos in 2022 in zip code 37664 273 Less than $10,00044 $10,000 to $14,999147 $15,000 to $19,9995 $20,000 to $24,99928 $25,000 to $29,9998 $35,000 to $39,99940 $40,000 to $49,999105 $50,000 to $59,99973 $60,000 to $69,999171 $70,000 to $79,999312 $80,000 to $89,999222 $90,000 to $99,999563 $100,000 to $124,999507 $125,000 to $149,999815 $150,000 to $174,999380 $175,000 to $199,999892 $200,000 to $249,999874 $250,000 to $299,9991,702 $300,000 to $399,999796 $400,000 to $499,999661 $500,000 to $749,99970 $750,000 to $999,99927 $1,000,000 to $1,499,999Rent paid by renters in 2022 in zip code 37664 25 Less than $10032 $100 to $14927 $150 to $199102 $200 to $24968 $250 to $299187 $300 to $349113 $350 to $399207 $400 to $449272 $450 to $499222 $500 to $549246 $550 to $599264 $600 to $649153 $650 to $699214 $700 to $749247 $750 to $799165 $800 to $899193 $900 to $999107 $1,000 to $1,24954 $1,250 to $1,499110 $1,500 to $1,99967 $2,000 to $2,499533 No cash rent
Median gross rent in 2022: $787.
Median price asked for vacant for-sale houses and condos in 2022: $251,562.
Estimated median house (or condo) value in 2022 for: White Non-Hispanic householders: $241,604Black or African American householders: $214,138American Indian or Alaska Native householders: $190,740Some other race householders: $317,900Two or more races householders: $190,740Hispanic or Latino householders: $200,404Estimated median house or condo value in 2022: $231,178
37664:
$231,178Tennessee:
$284,800
Lower value quartile - upper value quartile: $143,075 - $374,992
Mean price in 2022: Detached houses: $279,423Here:
$279,423State:
$374,382
Townhouses or other attached units: $199,989Here:
$199,989State:
$354,101
In 2-unit structures: $230,572Here:
$230,572State:
$247,693
In 3-to-4-unit structures: $100,512Here:
$100,512State:
$239,060
In 5-or-more-unit structures: $176,455Here:
$176,455State:
$317,434
Mobile homes: $52,982Here:
$52,982State:
$101,421
Housing units in structures:
One, detached: 11,161One, attached: 192Two: 2413 or 4: 4965 to 9: 75410 to 19: 34820 to 49: 14750 or more: 205Mobile homes: 895Unemployment : 2.9%
Means of transportation to work in zip code 37664 77.8% 9,759 Drove a car alone6.6% 829 Carpooled0.2% 28 Taxi0.0% 4 Motorcycle1.0% 130 Walked1.3% 169 Other means12.7% 1,588 Worked at homeTravel time to work (commute) in zip code 37664 479 Less than 5 minutes1,379 5 to 9 minutes2,306 10 to 14 minutes2,077 15 to 19 minutes1,703 20 to 24 minutes830 25 to 29 minutes995 30 to 34 minutes153 35 to 39 minutes214 40 to 44 minutes459 45 to 59 minutes178 60 to 89 minutes151 90 or more minutes
Percentage of zip code residents living and working in this county: 78.7%
Household type by relationship:
Households: 29,334
Male householders: 6,400 (1,824 living alone ), Female householders: 6,836 (2,139 living alone )6,060 spouses (5,992 opposite-sex spouses ), 1,050 unmarried partners , (1,032 opposite-sex unmarried partners ), 7,206 children (6,738 natural , 254 adopted , 223 stepchildren ), 575 grandchildren , 254 brothers or sisters , 251 parents , 27 foster children , 357 other relatives , 291 non-relatives In group quarters: 286 (-1 institutionalized population )
Size of family households: 4,519 2-persons , 1,934 3-persons , 1,304 4-persons , 580 5-persons , 99 6-persons , 63 7-or-more-persons
Size of nonfamily households: 3,963 1-person , 736 2-persons , 27 3-persons
3,476 married couples with children. single-parent households (296 men , 1,405 women ).
97.8% of residents of 37664 zip code speak English at home. of residents speak Spanish at home (86% very well, 5% well, 9% not at all ).of residents speak other Indo-European language at home (70% very well, 30% not well ).of residents speak Asian or Pacific Island language at home (76% very well, 12% well, 12% not at all ).of residents speak other language at home (61% very well, 39% well ).
Foreign born population: 475 (1.6%)
(46.8%
of them are naturalized citizens )
This zip code:
1.6%Whole state:
5.6%
11% Thailand 10% Moldova 10% Honduras 8% Bhutan 6% India 4% Haiti 4% United Kingdom, excluding England and Scotland 30% English 29% American 11% Irish 7% German 4% Scotch-Irish 2% Scottish 2% European
Year of entry for the foreign-born population
241 2010 or later 139 2000 to 2009 101 1990 to 1999 199 Before 1990
There are
170 Medical Specialists in Zip Code 37664 .
Facilities with environmental interests located in this zip code:
DOBYNS BENNETT HIGH SCHOOL (1800 LEGION DR in KINGSPORT, TN)
(Geographic Names Information System) (National Center for Education Statistics) - STATE ID-0010 Organizations: KINGSPORT CITY SCHOOL DISTRICT (SCHOOL DISTRICT)
CONCORD CUSTOM CLEANERS #067 (1700 FORT HENRY DRIVE in KINGSPORT, TN)
AIR MINOR (AIRS/AFS) Conditionally Exempt Small Quantity Generators, less than 100 kg/month of hazardous waste (Resource Conservation and Recovery Act (tracking hazardous waste)) Business SIC classification: COIN-OPERATED LAUNDRIES AND DRYCLEANINGOrganizations: STORE MANAGER (CONTACT/OPERATOR)
, CONCORD CUSTOMER CLEANERS (CONTACT/OWNER)
BYERLY CO., INC. (1929 BROOKSIDE DR. in KINGSPORT, TN)
National Pollutant Discharge Elimination System NON-MAJOR (Tracking pollutant discharge elimination systems) - permit Business SIC classification: READY-MIXED CONCRETEOrganizations: JERRY BYERLEY (CONTACT/OWNER)
Alternative names: BYERLEY CONST. CO., INC.
COVINGTON DETROIT DIESEL ALLISON (1435 ROCK SPRINGS ROAD in KINGSPORT, TN)
Small Quantity Generators, between 100 kg and 1000 kg of hazardous waste/month (Resource Conservation and Recovery Act (tracking hazardous waste)) - notification Business NAICS classification: ALL OTHER AUTOMOTIVE REPAIR AND MAINTENANCE.Organizations: DOUG MITCHELL, SERVICE MGR (CONTACT/OPERATOR)
, GENEVA CORPORATION (CONTACT/OWNER)
Housing units lacking complete plumbing facilities: 1.1%
Housing units lacking complete kitchen facilities: 1.5%
82.4% Electricity 13.9% Utility gas 1.2% Bottled, tank, or LP gas 1.1% No fuel used 1.1% Wood
Population in 1990: 22,289. Population change in the 1990s: +3,691 (+16.6%).
Place of birth for U.S.-born residents:
This state: 18,530Northeast: 747Midwest: 1,927South: 6,347West: 972
61% of the 37664 zip code residents lived in the same house 5 years ago.
Out of people who lived in different houses, 64% lived in this county.
Out of people who lived in different counties, 50% lived in Tennessee.
90% of the 37664 zip code residents lived in the same house 1 year ago.
Out of people who lived in different houses, 54% moved from this county.
Out of people who lived in different houses, 24% moved from different county within same state.
Out of people who lived in different houses, 18% moved from different state.
Out of people who lived in different houses, 4% moved from abroad.
Private vs. public school enrollment:
Students in private schools in grades 1 to 8 (elementary and middle school): 132
Students in private schools in grades 9 to 12 (high school): 61
Students in private undergraduate colleges: 314
Here:
30.3%Tennessee:
23.5%
Occupation by median earnings in the past 12 months ($)
108,718 Architecture and engineering occupations 90,129 Legal occupations 76,375 Computer and mathematical occupations 73,322 Management occupations 65,976 Law enforcement workers including supervisors 65,447 Life, physical, and social science occupations
Companies with federal contracts located in this zip code:
STEAMATIC OF EAST TENNESSEE (1337 POST ST in KINGSPORT, TN; small business) in 2 contracts in 2005
$42,698 with Army for Other Housekeeping Services. Taking place in VA. Signed on 2005-05-12. Completion date: 2005-07-25.
, same as above. Signed on 2005-06-15. Completion date: 2005-07-25.
TRI-CITY FENCE COMPANY (5017 MEMORIAL BLVD STE E in KINGSPORT, TN; small business)
$5,500 with Army for Solar Electric Power Systems. Taking place in VA. Signed on 2005-08-19. Completion date: 2005-08-15.
SMITH, JOHN ALAN, DDS, PC (1599 FORT HENRY DR in KINGSPORT, TN; small business)
$3,749 with Army for Dentistry Services. Signed on 2004-08-16. Completion date: 2004-07-15.
Top industries in this zip code by the number of employees in 2005:
Accommodation and Food Services: Full-Service Restaurants (100-249 employees: 1 establishment, 50-99 employees: 3 establishments, 20-49 employees: 2 establishments, 10-19 employees: 5 establishments, 5-9 employees: 2 establishments, 1-4 employees: 3 establishments)Accommodation and Food Services: Limited-Service Restaurants (50-99: 2, 20-49: 6, 10-19: 8, 5-9: 4, 1-4: 1)Other Services (except Public Administration): Religious Organizations (20-49: 1, 10-19: 8, 5-9: 10, 1-4: 14)Management of Companies and Enterprises: Corporate, Subsidiary, and Regional Managing Offices (100-249: 1, 5-9: 1, 1-4: 2)Information: Cable and Other Program Distribution (100-249: 1, 1-4: 1)Administrative and Support and Waste Management and Remediation Services: Professional Employer Organizations (100-249: 1)
People in group quarters in 2010:
348 people in nursing facilities/skilled-nursing facilities
22 people in group homes intended for adults
6 people in group homes for juveniles (non-correctional)
People in group quarters in 2000:
342 people in nursing homes
70 people in other noninstitutional group quarters
10 people in homes for the mentally ill
Fatal accident statistics in 2014:
Fatal accident count: 2Vehicles involved in fatal accidents: 5Fatal accidents caused by drunken drivers: 1Fatalities: 2Persons involved in fatal accidents: 6Pedestrians involved in fatal accidents: 0
Fatal accident statistics in 2013:
Fatal accident count: 5Vehicles involved in fatal accidents: 11Fatal accidents caused by drunken drivers: 0Fatalities: 6Persons involved in fatal accidents: 16Pedestrians involved in fatal accidents: 0
Home Mortgage Disclosure Act Aggregated Statistics For Year 2009(Based on 2 full and 20 partial tracts) A) FHA, FSA/RHS & VA B) Conventional C) Refinancings D) Home Improvement Loans E) Loans on Dwellings For 5+ Families F) Non-occupant Loans on G) Loans On Manufactured Number Average Value Number Average Value Number Average Value Number Average Value Number Average Value Number Average Value Number Average Value
LOANS ORIGINATED 197 $125,207 298 $141,812 967 $133,340 57 $64,195 7 $469,111 81 $95,977 8 $48,932 APPLICATIONS APPROVED, NOT ACCEPTED 14 $102,995 9 $162,973 56 $150,388 4 $73,158 0 $0 0 $0 1 $91,700 APPLICATIONS DENIED 20 $115,938 43 $106,813 290 $126,306 37 $31,439 8 $403,844 21 $91,710 11 $67,910 APPLICATIONS WITHDRAWN 22 $125,970 29 $118,086 161 $139,404 9 $91,683 0 $0 4 $112,128 0 $0 FILES CLOSED FOR INCOMPLETENESS 7 $107,701 1 $93,580 59 $179,431 6 $86,298 0 $0 2 $65,290 0 $0
Aggregated Statistics For Year 2008(Based on 2 full and 20 partial tracts) A) FHA, FSA/RHS & VA B) Conventional C) Refinancings D) Home Improvement Loans E) Loans on Dwellings For 5+ Families F) Non-occupant Loans on G) Loans On Manufactured Number Average Value Number Average Value Number Average Value Number Average Value Number Average Value Number Average Value Number Average Value
LOANS ORIGINATED 140 $117,059 413 $140,168 599 $123,329 99 $42,955 10 $1,082,241 118 $91,449 11 $67,074 APPLICATIONS APPROVED, NOT ACCEPTED 8 $84,016 24 $148,697 51 $94,786 11 $29,716 0 $0 10 $61,182 2 $72,250 APPLICATIONS DENIED 30 $109,799 73 $113,678 334 $116,146 42 $51,296 3 $579,373 22 $92,120 15 $61,680 APPLICATIONS WITHDRAWN 13 $125,959 23 $131,183 128 $122,449 8 $90,361 2 $958,300 2 $122,040 3 $73,843 FILES CLOSED FOR INCOMPLETENESS 2 $171,820 11 $87,855 31 $138,846 3 $43,033 0 $0 2 $137,910 2 $54,315
Aggregated Statistics For Year 2007(Based on 2 full and 20 partial tracts) A) FHA, FSA/RHS & VA B) Conventional C) Refinancings D) Home Improvement Loans E) Loans on Dwellings For 5+ Families F) Non-occupant Loans on G) Loans On Manufactured Number Average Value Number Average Value Number Average Value Number Average Value Number Average Value Number Average Value Number Average Value
LOANS ORIGINATED 44 $111,994 729 $116,546 581 $109,485 103 $41,597 4 $383,118 163 $76,578 19 $59,504 APPLICATIONS APPROVED, NOT ACCEPTED 4 $118,632 46 $127,908 89 $108,113 7 $47,330 0 $0 11 $57,991 8 $52,491 APPLICATIONS DENIED 11 $91,677 101 $107,391 340 $118,381 83 $51,570 4 $330,160 35 $130,630 25 $127,356 APPLICATIONS WITHDRAWN 2 $84,125 47 $99,205 150 $103,771 13 $69,846 2 $888,030 9 $67,072 5 $37,820 FILES CLOSED FOR INCOMPLETENESS 4 $65,515 15 $135,815 42 $141,276 3 $96,650 0 $0 2 $57,595 0 $0
Aggregated Statistics For Year 2006(Based on 2 full and 20 partial tracts) A) FHA, FSA/RHS & VA B) Conventional C) Refinancings D) Home Improvement Loans E) Loans on Dwellings For 5+ Families F) Non-occupant Loans on G) Loans On Manufactured Number Average Value Number Average Value Number Average Value Number Average Value Number Average Value Number Average Value Number Average Value
LOANS ORIGINATED 72 $100,267 821 $106,104 697 $85,848 97 $32,271 10 $258,677 199 $71,763 35 $63,410 APPLICATIONS APPROVED, NOT ACCEPTED 3 $81,500 77 $84,336 116 $95,312 11 $36,634 1 $112,290 40 $69,168 22 $73,358 APPLICATIONS DENIED 14 $76,011 180 $82,854 502 $97,327 55 $52,462 6 $896,593 90 $63,512 79 $57,975 APPLICATIONS WITHDRAWN 3 $82,257 61 $101,253 275 $94,199 23 $55,890 0 $0 11 $75,919 5 $59,378 FILES CLOSED FOR INCOMPLETENESS 0 $0 36 $70,533 89 $112,374 5 $33,828 0 $0 3 $67,660 2 $100,340
Aggregated Statistics For Year 2005(Based on 2 full and 20 partial tracts) A) FHA, FSA/RHS & VA B) Conventional C) Refinancings D) Home Improvement Loans E) Loans on Dwellings For 5+ Families F) Non-occupant Loans on G) Loans On Manufactured Number Average Value Number Average Value Number Average Value Number Average Value Number Average Value Number Average Value Number Average Value
LOANS ORIGINATED 45 $102,536 834 $103,451 893 $86,343 111 $38,782 6 $513,718 165 $74,402 32 $59,120 APPLICATIONS APPROVED, NOT ACCEPTED 2 $65,290 64 $72,673 159 $67,859 10 $40,055 1 $101,180 29 $59,007 32 $39,772 APPLICATIONS DENIED 13 $81,695 179 $77,243 420 $91,767 72 $41,300 1 $114,680 26 $48,815 97 $52,954 APPLICATIONS WITHDRAWN 4 $107,920 58 $101,932 342 $108,405 34 $130,493 0 $0 11 $108,394 2 $107,500 FILES CLOSED FOR INCOMPLETENESS 3 $93,580 33 $83,875 58 $98,311 6 $48,347 0 $0 3 $38,970 0 $0
Aggregated Statistics For Year 2004(Based on 2 full and 20 partial tracts) A) FHA, FSA/RHS & VA B) Conventional C) Refinancings D) Home Improvement Loans E) Loans on Dwellings For 5+ Families F) Non-occupant Loans on G) Loans On Manufactured Number Average Value Number Average Value Number Average Value Number Average Value Number Average Value Number Average Value Number Average Value
LOANS ORIGINATED 64 $93,184 617 $107,103 969 $89,799 108 $27,848 2 $459,800 150 $63,646 39 $46,484 APPLICATIONS APPROVED, NOT ACCEPTED 1 $54,270 78 $77,848 176 $82,333 10 $27,707 0 $0 15 $68,164 20 $49,144 APPLICATIONS DENIED 12 $88,743 167 $70,295 547 $87,974 92 $32,624 0 $0 14 $43,985 106 $49,151 APPLICATIONS WITHDRAWN 3 $60,920 44 $90,290 325 $96,362 11 $55,955 0 $0 12 $58,961 6 $63,795 FILES CLOSED FOR INCOMPLETENESS 3 $96,443 20 $92,222 53 $93,262 3 $47,547 0 $0 0 $0 1 $99,810
Aggregated Statistics For Year 2003(Based on 2 full and 20 partial tracts) A) FHA, FSA/RHS & VA B) Conventional C) Refinancings D) Home Improvement Loans E) Loans on Dwellings For 5+ Families F) Non-occupant Loans on Number Average Value Number Average Value Number Average Value Number Average Value Number Average Value Number Average Value
LOANS ORIGINATED 69 $93,071 624 $101,272 1,808 $100,671 84 $53,662 2 $1,038,065 135 $67,877 APPLICATIONS APPROVED, NOT ACCEPTED 5 $45,748 74 $82,444 257 $92,952 15 $30,747 0 $0 22 $50,139 APPLICATIONS DENIED 15 $73,324 168 $64,763 570 $79,395 45 $31,782 0 $0 25 $49,152 APPLICATIONS WITHDRAWN 2 $89,285 49 $85,703 226 $92,285 3 $60,890 0 $0 11 $80,068 FILES CLOSED FOR INCOMPLETENESS 0 $0 11 $73,276 35 $94,904 3 $42,203 0 $0 2 $71,685
Aggregated Statistics For Year 2002(Based on 2 full and 20 partial tracts) A) FHA, FSA/RHS & VA B) Conventional C) Refinancings D) Home Improvement Loans E) Loans on Dwellings For 5+ Families F) Non-occupant Loans on Number Average Value Number Average Value Number Average Value Number Average Value Number Average Value Number Average Value
LOANS ORIGINATED 99 $83,984 700 $99,654 1,147 $97,736 64 $25,627 3 $418,273 108 $61,550 APPLICATIONS APPROVED, NOT ACCEPTED 9 $75,384 77 $50,740 168 $79,069 16 $20,236 0 $0 18 $53,489 APPLICATIONS DENIED 16 $78,686 239 $55,820 444 $78,604 51 $14,041 0 $0 21 $40,966 APPLICATIONS WITHDRAWN 6 $106,313 66 $88,315 215 $81,807 5 $40,286 1 $118,050 2 $46,680 FILES CLOSED FOR INCOMPLETENESS 4 $75,432 10 $76,314 33 $98,008 1 $142,500 0 $0 0 $0
Aggregated Statistics For Year 2001(Based on 2 full and 20 partial tracts) A) FHA, FSA/RHS & VA B) Conventional C) Refinancings D) Home Improvement Loans F) Non-occupant Loans on Number Average Value Number Average Value Number Average Value Number Average Value Number Average Value
LOANS ORIGINATED 82 $82,592 607 $95,825 906 $85,927 63 $22,457 97 $55,588 APPLICATIONS APPROVED, NOT ACCEPTED 6 $86,320 98 $50,784 148 $68,525 7 $30,446 20 $46,430 APPLICATIONS DENIED 18 $75,498 229 $52,763 470 $75,151 38 $21,429 24 $59,451 APPLICATIONS WITHDRAWN 10 $86,238 100 $70,504 211 $78,069 10 $38,577 8 $67,830 FILES CLOSED FOR INCOMPLETENESS 1 $141,450 11 $127,550 36 $67,360 1 $22,630 2 $61,310
Aggregated Statistics For Year 2000(Based on 2 full and 20 partial tracts) A) FHA, FSA/RHS & VA B) Conventional C) Refinancings D) Home Improvement Loans F) Non-occupant Loans on Number Average Value Number Average Value Number Average Value Number Average Value Number Average Value
LOANS ORIGINATED 99 $79,375 637 $83,867 480 $66,047 75 $21,260 98 $51,111 APPLICATIONS APPROVED, NOT ACCEPTED 24 $44,215 94 $49,851 157 $70,913 23 $26,682 10 $45,017 APPLICATIONS DENIED 38 $51,898 344 $46,719 357 $60,725 61 $21,381 20 $55,198 APPLICATIONS WITHDRAWN 8 $76,708 140 $52,461 189 $63,156 5 $34,100 7 $58,967 FILES CLOSED FOR INCOMPLETENESS 1 $47,220 2 $77,095 27 $80,938 0 $0 1 $142,010
Aggregated Statistics For Year 1999(Based on 1 full and 10 partial tracts) A) FHA, FSA/RHS & VA B) Conventional C) Refinancings D) Home Improvement Loans E) Loans on Dwellings For 5+ Families F) Non-occupant Loans on Number Average Value Number Average Value Number Average Value Number Average Value Number Average Value Number Average Value
LOANS ORIGINATED 29 $84,943 297 $83,197 441 $71,548 38 $17,326 1 $589,740 56 $48,061 APPLICATIONS APPROVED, NOT ACCEPTED 1 $67,500 58 $57,138 77 $61,308 13 $14,346 0 $0 8 $52,875 APPLICATIONS DENIED 7 $95,577 166 $47,940 142 $62,089 28 $14,749 0 $0 12 $58,852 APPLICATIONS WITHDRAWN 11 $62,475 57 $90,964 109 $65,836 11 $57,059 0 $0 4 $332,880 FILES CLOSED FOR INCOMPLETENESS 0 $0 5 $61,458 29 $74,629 1 $62,800 0 $0 0 $0
Private Mortgage Insurance Companies Aggregated Statistics For Year 2009(Based on 2 full and 20 partial tracts) A) Conventional B) Refinancings C) Non-occupant Loans on D) Loans On Manufactured Number Average Value Number Average Value Number Average Value Number Average Value
LOANS ORIGINATED 45 $174,989 46 $150,795 2 $93,800 0 $0 APPLICATIONS APPROVED, NOT ACCEPTED 5 $152,216 17 $144,621 0 $0 1 $91,700 APPLICATIONS DENIED 10 $110,152 6 $118,702 1 $75,820 0 $0 APPLICATIONS WITHDRAWN 4 $172,055 5 $148,906 0 $0 0 $0 FILES CLOSED FOR INCOMPLETENESS 0 $0 1 $105,270 0 $0 0 $0
Aggregated Statistics For Year 2008(Based on 2 full and 20 partial tracts) A) Conventional B) Refinancings C) Non-occupant Loans on Number Average Value Number Average Value Number Average Value
LOANS ORIGINATED 123 $141,755 64 $155,565 12 $74,524 APPLICATIONS APPROVED, NOT ACCEPTED 18 $187,884 12 $99,688 1 $22,610 APPLICATIONS DENIED 0 $0 3 $210,120 0 $0 APPLICATIONS WITHDRAWN 10 $243,065 3 $110,847 0 $0 FILES CLOSED FOR INCOMPLETENESS 3 $211,643 1 $108,390 2 $113,640
Aggregated Statistics For Year 2007(Based on 2 full and 20 partial tracts) A) Conventional B) Refinancings C) Non-occupant Loans on Number Average Value Number Average Value Number Average Value
LOANS ORIGINATED 271 $116,442 66 $135,758 35 $79,026 APPLICATIONS APPROVED, NOT ACCEPTED 16 $145,798 14 $124,339 2 $131,505 APPLICATIONS DENIED 4 $49,138 0 $0 0 $0 APPLICATIONS WITHDRAWN 7 $196,203 2 $78,080 1 $60,040 FILES CLOSED FOR INCOMPLETENESS 0 $0 2 $109,210 0 $0
Aggregated Statistics For Year 2006(Based on 2 full and 20 partial tracts) A) Conventional B) Refinancings C) Non-occupant Loans on D) Loans On Manufactured Number Average Value Number Average Value Number Average Value Number Average Value
LOANS ORIGINATED 180 $115,917 55 $108,137 27 $77,707 3 $64,227 APPLICATIONS APPROVED, NOT ACCEPTED 15 $118,361 6 $94,363 4 $35,065 2 $99,900 APPLICATIONS DENIED 0 $0 2 $110,905 0 $0 0 $0 APPLICATIONS WITHDRAWN 8 $213,035 1 $125,230 0 $0 0 $0 FILES CLOSED FOR INCOMPLETENESS 1 $96,120 0 $0 0 $0 0 $0
Aggregated Statistics For Year 2005(Based on 2 full and 20 partial tracts) A) Conventional B) Refinancings C) Non-occupant Loans on Number Average Value Number Average Value Number Average Value
LOANS ORIGINATED 180 $112,221 69 $118,314 9 $62,974 APPLICATIONS APPROVED, NOT ACCEPTED 14 $141,760 3 $136,720 0 $0 APPLICATIONS DENIED 2 $171,120 0 $0 0 $0 APPLICATIONS WITHDRAWN 4 $140,980 3 $57,207 0 $0 FILES CLOSED FOR INCOMPLETENESS 2 $127,555 0 $0 0 $0
Aggregated Statistics For Year 2004(Based on 2 full and 20 partial tracts) A) Conventional B) Refinancings C) Non-occupant Loans on D) Loans On Manufactured Number Average Value Number Average Value Number Average Value Number Average Value
LOANS ORIGINATED 108 $99,164 46 $103,822 15 $62,994 1 $100,500 APPLICATIONS APPROVED, NOT ACCEPTED 22 $110,729 11 $119,873 5 $54,324 3 $61,063 APPLICATIONS DENIED 2 $111,270 0 $0 0 $0 0 $0 APPLICATIONS WITHDRAWN 1 $70,960 4 $88,408 1 $81,100 0 $0 FILES CLOSED FOR INCOMPLETENESS 1 $70,960 0 $0 0 $0 0 $0
Aggregated Statistics For Year 2003(Based on 2 full and 20 partial tracts) A) Conventional B) Refinancings C) Non-occupant Loans on Number Average Value Number Average Value Number Average Value
LOANS ORIGINATED 144 $102,711 151 $109,871 9 $51,544 APPLICATIONS APPROVED, NOT ACCEPTED 23 $126,600 41 $103,970 6 $58,610 APPLICATIONS DENIED 2 $87,270 2 $72,030 0 $0 APPLICATIONS WITHDRAWN 1 $343,500 11 $136,602 1 $87,340 FILES CLOSED FOR INCOMPLETENESS 3 $118,170 2 $72,645 0 $0
Aggregated Statistics For Year 2002(Based on 2 full and 20 partial tracts) A) Conventional B) Refinancings C) Non-occupant Loans on Number Average Value Number Average Value Number Average Value
LOANS ORIGINATED 124 $102,070 91 $103,670 12 $66,677 APPLICATIONS APPROVED, NOT ACCEPTED 28 $99,029 26 $120,092 4 $59,312 APPLICATIONS DENIED 5 $109,368 3 $132,780 0 $0 APPLICATIONS WITHDRAWN 4 $122,420 11 $72,972 2 $27,590 FILES CLOSED FOR INCOMPLETENESS 2 $40,635 3 $121,653 2 $53,335
Aggregated Statistics For Year 2001(Based on 2 full and 20 partial tracts) A) Conventional B) Refinancings C) Non-occupant Loans on Number Average Value Number Average Value Number Average Value
LOANS ORIGINATED 117 $108,509 65 $108,332 7 $59,447 APPLICATIONS APPROVED, NOT ACCEPTED 30 $116,151 19 $128,933 2 $153,090 APPLICATIONS DENIED 1 $569,160 5 $85,222 0 $0 APPLICATIONS WITHDRAWN 1 $48,910 7 $74,599 0 $0 FILES CLOSED FOR INCOMPLETENESS 2 $102,575 3 $88,187 0 $0
Aggregated Statistics For Year 2000(Based on 2 full and 20 partial tracts) A) Conventional B) Refinancings C) Non-occupant Loans on Number Average Value Number Average Value Number Average Value
LOANS ORIGINATED 115 $100,439 22 $87,018 4 $80,645 APPLICATIONS APPROVED, NOT ACCEPTED 16 $89,056 6 $129,002 0 $0 APPLICATIONS DENIED 4 $126,090 5 $151,082 4 $65,745 APPLICATIONS WITHDRAWN 1 $67,830 2 $95,665 0 $0 FILES CLOSED FOR INCOMPLETENESS 0 $0 0 $0 0 $0
Aggregated Statistics For Year 1999(Based on 1 full and 9 partial tracts) A) Conventional B) Refinancings C) Non-occupant Loans on Number Average Value Number Average Value Number Average Value
LOANS ORIGINATED 52 $103,537 22 $95,228 3 $40,300 APPLICATIONS APPROVED, NOT ACCEPTED 2 $129,245 4 $127,678 0 $0 APPLICATIONS DENIED 0 $0 3 $63,277 0 $0 APPLICATIONS WITHDRAWN 2 $73,745 0 $0 0 $0 FILES CLOSED FOR INCOMPLETENESS 1 $52,290 0 $0 0 $0
2002 - 2018 National Fire Incident Reporting System (NFIRS) incidents See full 2006 National Fire Incident Reporting System statistics for zip code 37664, Tennessee
Most common first names in zip code 37664 among deceased individuals Name Count Lived (average)
James 234 72.3 years Mary 210 79.3 years William 191 74.7 years John 166 74.8 years Robert 150 74.0 years Charles 109 73.5 years George 73 75.1 years Ruth 64 80.2 years Helen 60 75.5 years Paul 60 70.1 years
Most common last names in zip code 37664 among deceased individuals Last name Count Lived (average)
Smith 107 76.4 years Williams 69 72.6 years Jones 68 74.5 years Carter 63 75.6 years Johnson 62 76.0 years Taylor 59 74.8 years Cox 55 75.2 years Davis 53 73.1 years Lawson 42 74.3 years Light 42 76.4 years
Businesses in zip code 37664
Name Count Name Count
Aeropostale 1 New Balance 2 American Eagle Outfitters 1 Nike 5 Bath & Body Works 1 Panera Bread 1 Blockbuster 1 Papa John's Pizza 1 Burger King 1 Payless 1 CVS 1 Penske 1 Deb 1 Rue21 1 Domino's Pizza 1 Sears 2 FedEx 2 Spencer Gifts 1 GNC 1 Sprint Nextel 1 GameStop 1 Starbucks 1 H&R Block 1 Subway 1 JCPenney 1 T-Mobile 2 Jones New York 3 Taco Bell 1 Justice 1 U-Haul 1 KFC 1 UPS 1 Kroger 1 Victoria's Secret 1 LensCrafters 1 Walgreens 1 Long John Silver's 1 Walmart 1 McDonald's 1 YMCA 1

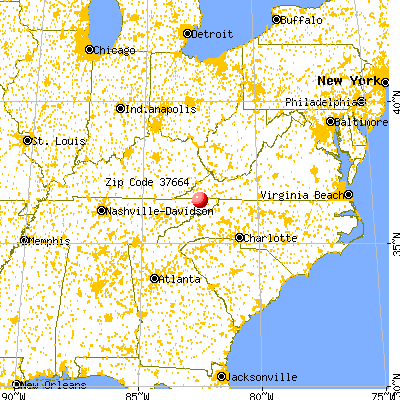


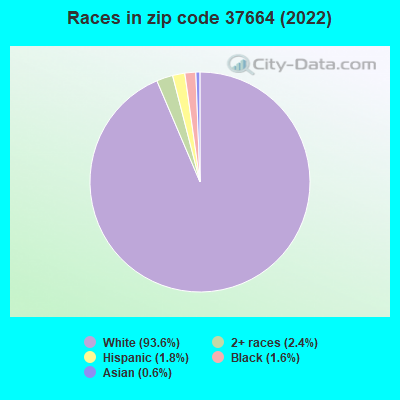


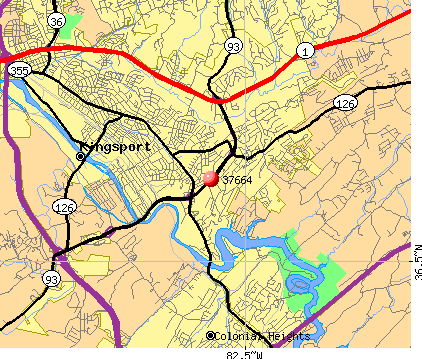 Nearest zip codes: 37663, 37660, 37665, 24290, 37615, 37617.
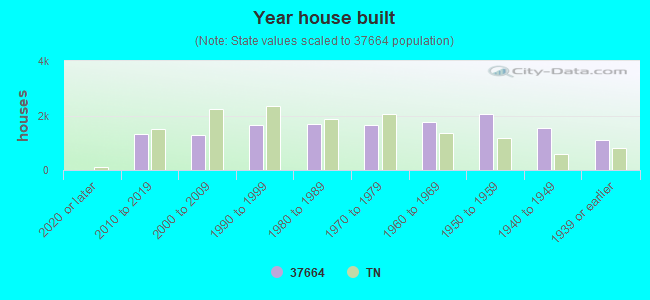

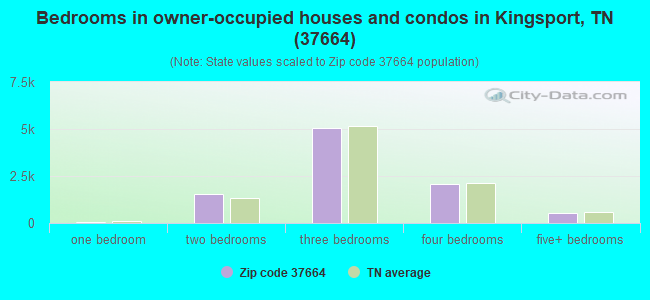
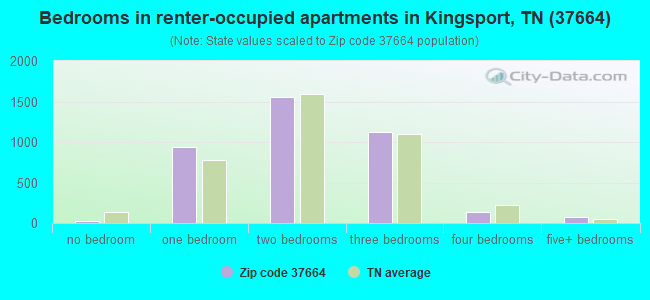
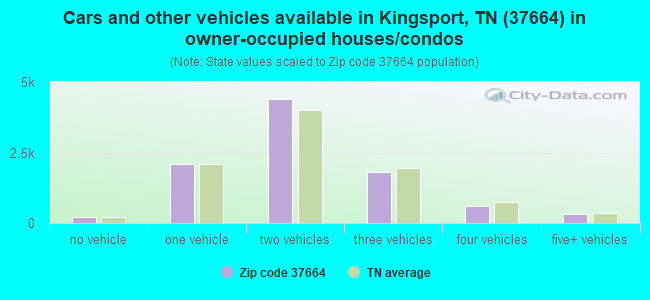
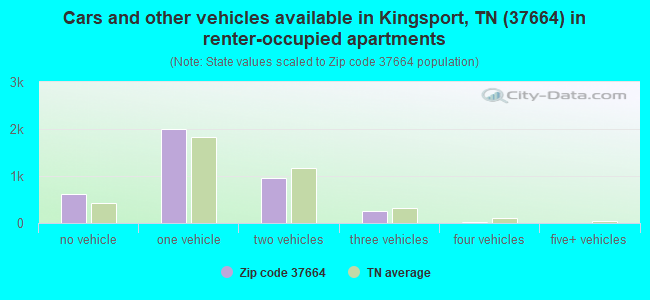


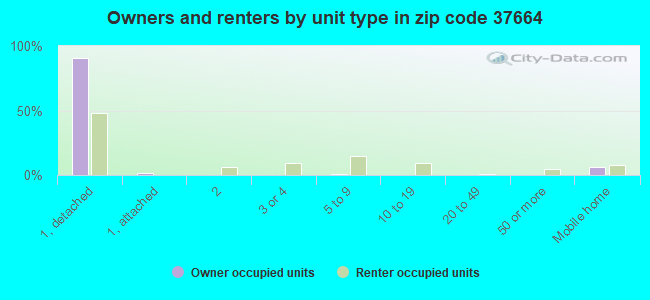
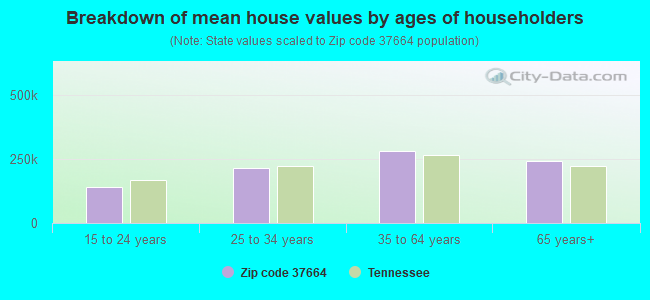


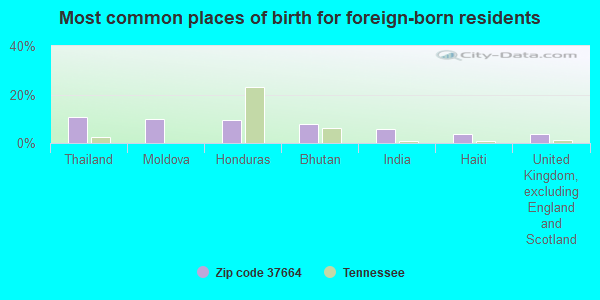
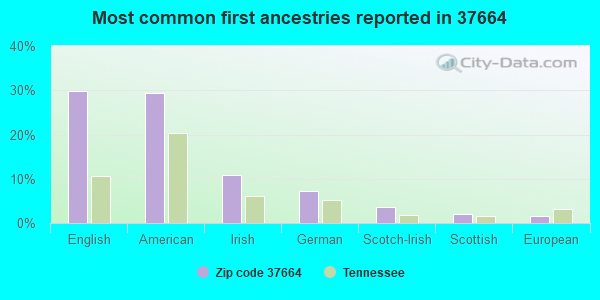


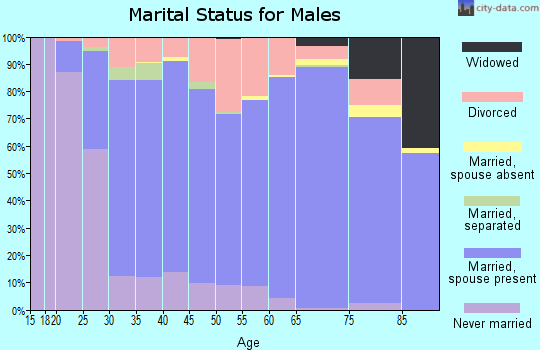
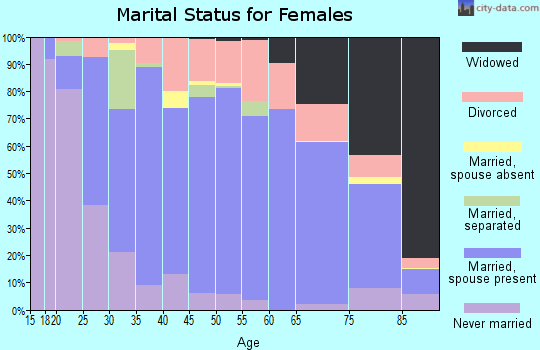
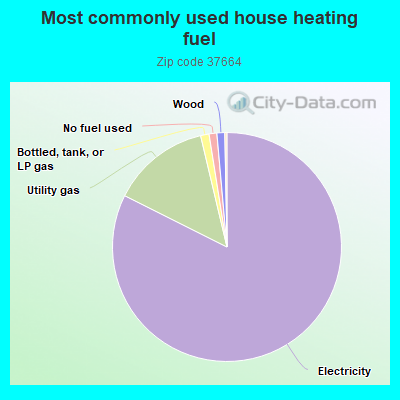
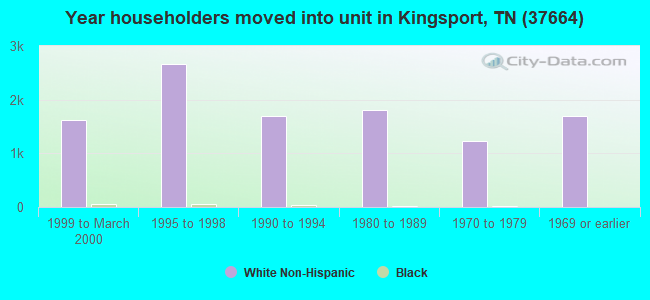
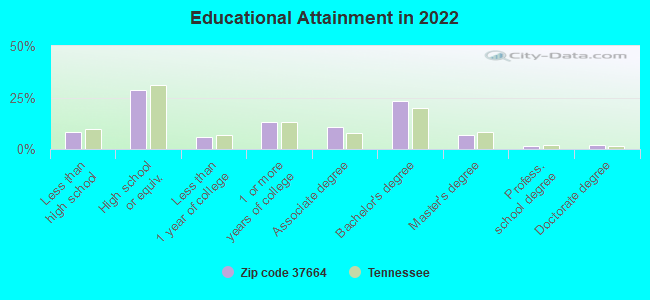
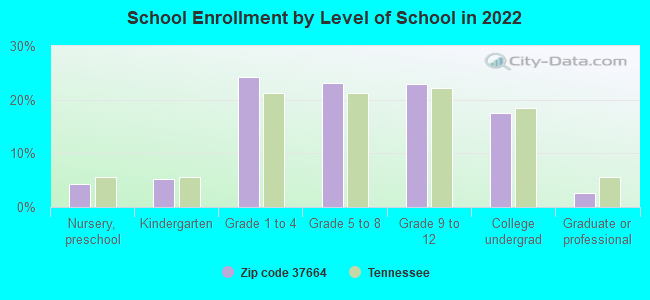
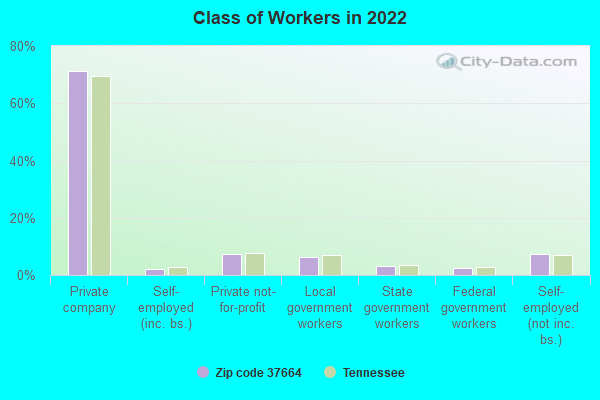
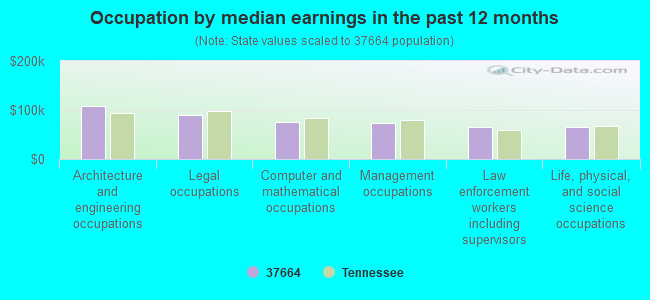
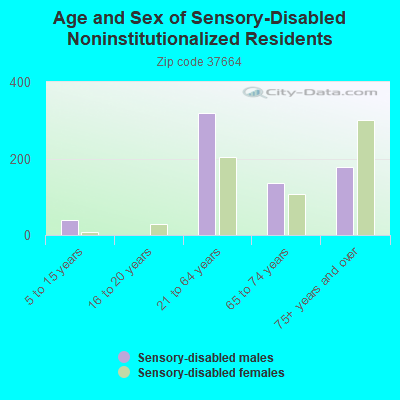
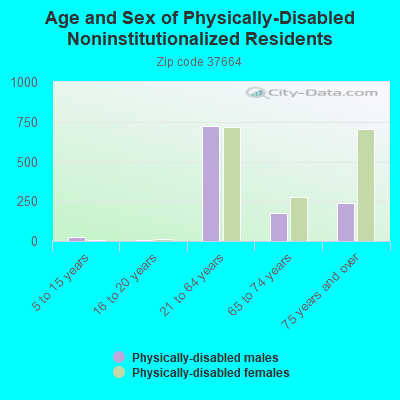
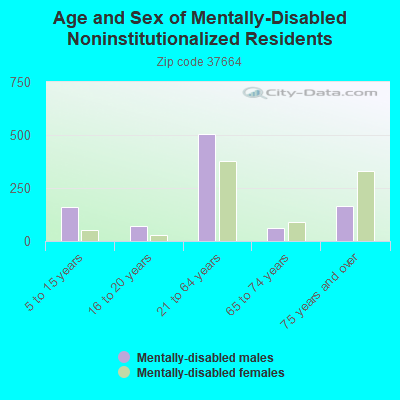
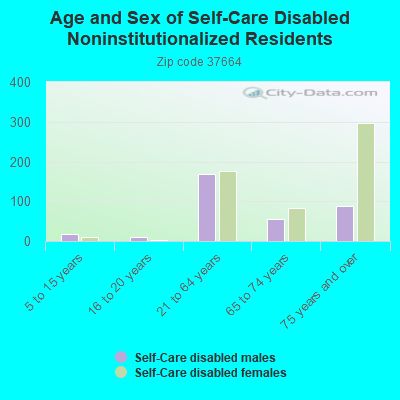
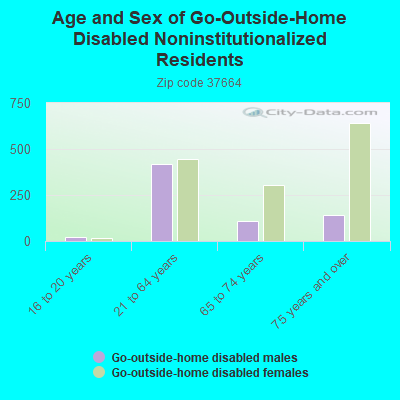
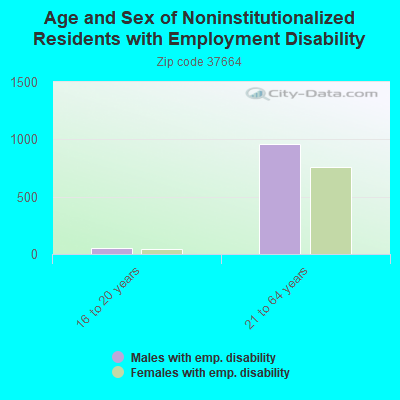
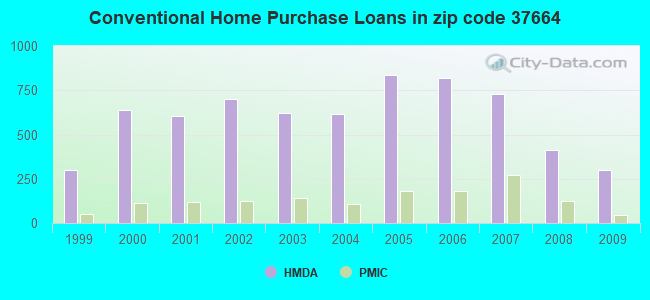
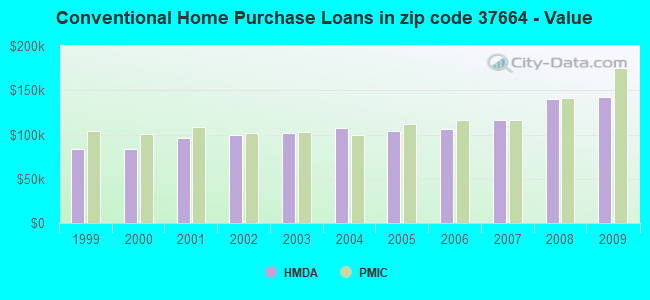
 According to the data from the years 2002 - 2018 the average number of fires per year is 28. The highest number of fires - 62 took place in 2005, and the least - 10 in 2017. The data has a decreasing trend.
 When looking into fire subcategories, the most reports belonged to: Outside Fires (39.1%), and Structure Fires (38.7%).