Estimated zip code population in 2022: 2,223 Zip code population in 2010: 2,656 Zip code population in 2000: 2,535
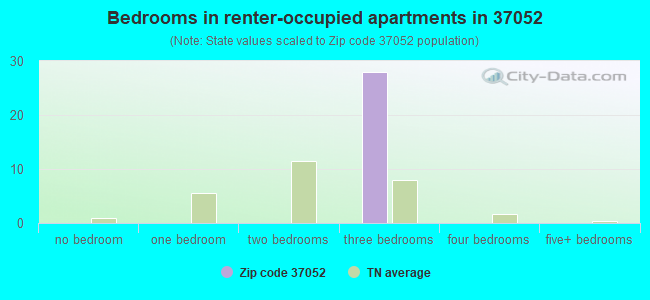
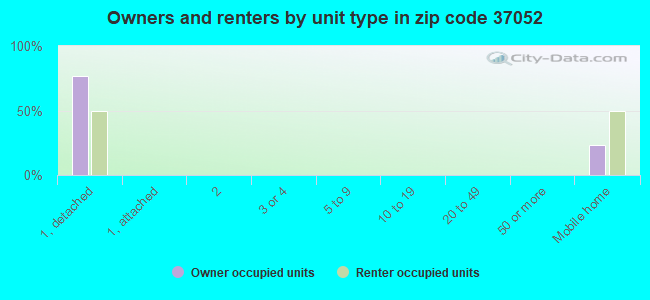
Houses and condos: 980 Renter-occupied apartments: 29
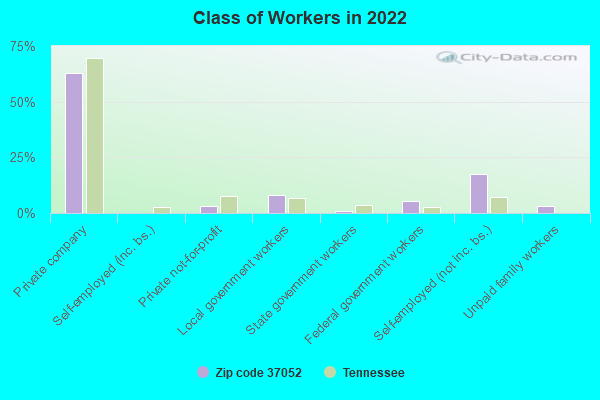
% of renters here:
3%
State:
33%
March 2022 cost of living index in zip code 37052: 77.4 (low, U.S. average is 100)
Land area: 37.6 sq. mi. Water area: 0.0 sq. mi.
Population density: 59 people per square mile
(very low).
OSM Map
General Map
Google Map
MSN Map
OSM Map
General Map
Google Map
MSN Map
OSM Map
General Map
Google Map
MSN Map
OSM Map
General Map
Google Map
MSN Map
Please wait while loading the map...
Real estate property taxes paid for housing units in 2022:
This zip code:
0.5% ($1,229)
Tennessee:
0.5% ($1,376)
Median real estate property taxes paid for housing units with mortgages in 2022: $1,233 (0.5%) Median real estate property taxes paid for housing units with no mortgage in 2022: $1,231 (0.5%)
Business Search- 14 Million verified businesses
Males: 1,294
(58.2%)
Females: 929
(41.8%)
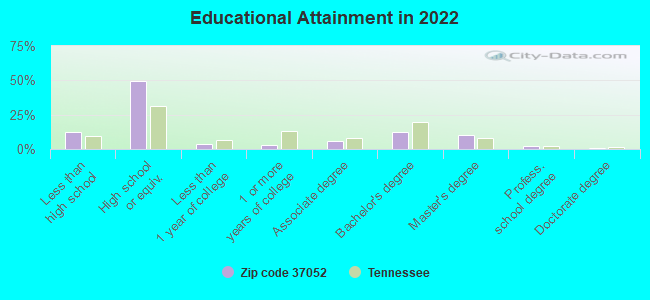
For population 25 years and over in 37052:
High school or higher: 87.4%
Bachelor's degree or higher: 25.4%
Graduate or professional degree: 13.0%
Unemployed: 3.9%
Mean travel time to work (commute): 33.0 minutes
For population 15 years and over in 37052:
Never married: 23.1%
Now married: 55.2%
Separated: 1.0%
Widowed: 13.2%
Divorced: 7.5%
Zip code 37052 compared to state average:
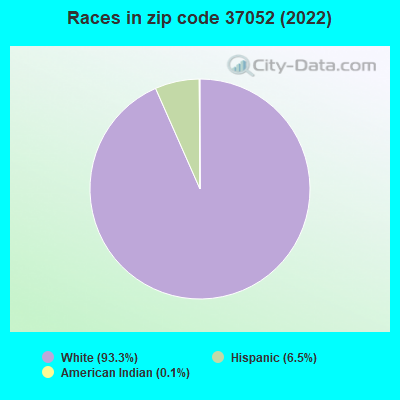
Black race population percentage significantly below state average.
Median age significantly above state average.
Renting percentage significantly below state average.
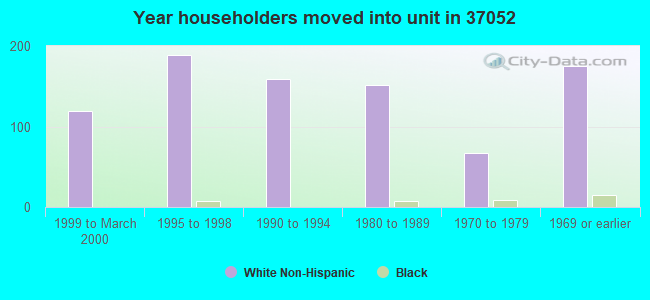
Length of stay since moving in significantly above state average.
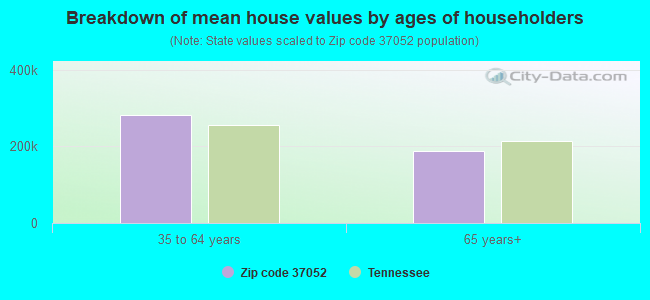
Estimated median house/condo value in 2022: $240,135
37052:
$240,135
Tennessee:
$284,800
According to our research of Tennessee and other state lists, there were 5 registered sex offenders living in 37052 zip code as of May 07, 2024. The ratio of all residents to sex offenders in zip code 37052 is 560 to 1. The ratio of registered sex offenders to all residents in this zip code is lower than the state average.
Median resident age:
This zip code:
48.4 years
Tennessee median age:
39.2 years
Average household size:
This zip code:
2.3 people
Tennessee:
2.4 people
Averages for the 2020 tax year for zip code 37052, filed in 2021:
Average Adjusted Gross Income (AGI) in 2020: $60,636 (Individual Income Tax Returns)
Here:
$60,636
State:
$69,014
Salary/wage: $54,828 (reported on 78.9% of returns)
Here:
$54,828
State:
$55,872
(% of AGI for various income ranges: 1013.3% for AGIs below $25k, 3412.9% for AGIs $25k-50k, 6347.5% for AGIs $50k-75k, 9239.0% for AGIs $75k-100k, 13586.0% for AGIs $100k-200k)
Taxable interest for individuals: $1,354 (reported on 30.5% of returns)
This zip code:
$1,354
Tennessee:
$1,945
(% of AGI for various income ranges: 23.7% for AGIs below $25k, 25.7% for AGIs $25k-50k, 28.7% for AGIs $50k-75k, 74.0% for AGIs $75k-100k, 157.3% for AGIs $100k-200k)
Ordinary dividends: $2,107 (reported on 10.9% of returns)
Here:
$2,107
State:
$8,105
(% of AGI for various income ranges: 11.7% for AGIs below $25k, 28.7% for AGIs $50k-75k, 29.0% for AGIs $75k-100k, 123.3% for AGIs $100k-200k)
Net capital gain/loss in AGI: +$17,354 (reported on 10.2% of returns)
Here:
+$17,354
State:
+$33,664
(% of AGI for various income ranges: 1.7% for AGIs below $25k, 88.1% for AGIs $50k-75k, 144.0% for AGIs $75k-100k, 1310.7% for AGIs $100k-200k)
Profit/loss from business: +$20,768 (reported on 17.2% of returns)
Here:
+$20,768
State:
+$18,991
(% of AGI for various income ranges: 179.0% for AGIs below $25k, 283.3% for AGIs $25k-50k, 595.6% for AGIs $50k-75k, 611.0% for AGIs $75k-100k, 1248.7% for AGIs $100k-200k)
Taxable individual retirement arrangement distribution: $15,667 (reported on 7.0% of returns)
37052:
$15,667
Tennessee:
$20,036
(% of AGI for various income ranges: 94.0% for AGIs below $25k, 201.3% for AGIs $50k-75k, 537.3% for AGIs $100k-200k)
Total itemized deductions: $31,220 (reported on 3.9% of returns)
Here:
$31,220
State:
$40,136
(% of AGI for various income ranges: 145.3% for AGIs below $25k, 750.0% for AGIs $100k-200k)
Charity contributions: $17,900 (reported on 2.3% of returns)
Here:
$17,900
State:
$19,852
(% of AGI for various income ranges: 358.0% for AGIs $100k-200k)
Taxes paid: $4,850 (reported on 3.1% of returns)
37052:
$4,850
State:
$6,038
(% of AGI for various income ranges: 20.3% for AGIs below $25k, 88.7% for AGIs $100k-200k)
Earned income credit: $2,226 (reported on 14.8% of returns)
Here:
$2,226
State:
$2,391
(% of AGI for various income ranges: 91.3% for AGIs below $25k, 71.0% for AGIs $25k-50k)
Percentage of individuals using paid preparers for their 2020 taxes: 90.6%
Here:
91%
State:
93%
(% for various income ranges: 92.5% for AGIs below $25k, 92.6% for AGIs $25k-50k, 86.4% for AGIs $50k-75k, 86.7% for AGIs $75k-100k, 90.5% for AGIs $100k-200k, 100.0% for AGIs over 200k)
Averages for the 2012 tax year for zip code 37052, filed in 2013:
Average Adjusted Gross Income (AGI) in 2012: $45,423 (Individual Income Tax Returns)
Here:
$45,423
State:
$53,767
Salary/wage: $41,741 (reported on 81.2% of returns)
Here:
$41,741
State:
$45,421
(% of AGI for various income ranges: 63.8% for AGIs below $25k, 80.9% for AGIs $25k-50k, 78.6% for AGIs $50k-75k, 77.1% for AGIs $75k-100k, 70.0% for AGIs $100k-200k)
Taxable interest for individuals: $915 (reported on 34.8% of returns)
This zip code:
$915
Tennessee:
$1,732
(% of AGI for various income ranges: 1.9% for AGIs below $25k, 0.5% for AGIs $25k-50k, 0.5% for AGIs $50k-75k, 0.4% for AGIs $75k-100k, 0.7% for AGIs $100k-200k)
Ordinary dividends: $1,688 (reported on 15.2% of returns)
Here:
$1,688
State:
$6,739
(% of AGI for various income ranges: 1.0% for AGIs below $25k, 0.3% for AGIs $25k-50k, 0.4% for AGIs $50k-75k, 0.2% for AGIs $75k-100k, 0.9% for AGIs $100k-200k)
Net capital gain/loss in AGI: +$2,250 (reported on 14.3% of returns)
Here:
+$2,250
State:
+$19,082
(% of AGI for various income ranges: 1.4% for AGIs below $25k, 0.4% for AGIs $25k-50k, 0.6% for AGIs $50k-75k, 0.7% for AGIs $75k-100k, 0.7% for AGIs $100k-200k)
Profit/loss from business: +$13,300 (reported on 17.0% of returns)
Here:
+$13,300
State:
+$15,240
(% of AGI for various income ranges: 11.5% for AGIs below $25k, 5.6% for AGIs $25k-50k, 4.0% for AGIs $50k-75k, 9.8% for AGIs $75k-100k)
Taxable individual retirement arrangement distribution: $10,700 (reported on 8.9% of returns)
37052:
$10,700
Tennessee:
$15,505
(% of AGI for various income ranges: 7.2% for AGIs below $25k, 1.8% for AGIs $50k-75k, 5.4% for AGIs $75k-100k)
Total itemized deductions: $17,219 (20% of AGI, reported on 18.8% of returns)
Here:
$17,219
State:
$21,976
Here:
19.6% of AGI
State:
17.8% of AGI
(% of AGI for various income ranges: 5.4% for AGIs below $25k, 6.0% for AGIs $25k-50k, 6.2% for AGIs $50k-75k, 6.9% for AGIs $75k-100k, 9.3% for AGIs $100k-200k)
Charity contributions: $5,262 (reported on 14.3% of returns)
Here:
$5,262
State:
$6,709
(% of AGI for various income ranges: 1.2% for AGIs $25k-50k, 1.2% for AGIs $50k-75k, 1.1% for AGIs $75k-100k, 3.2% for AGIs $100k-200k)
Taxes paid: $3,710 (reported on 18.8% of returns)
37052:
$3,710
State:
$4,829
(% of AGI for various income ranges: 1.5% for AGIs $25k-50k, 1.1% for AGIs $50k-75k, 1.9% for AGIs $75k-100k, 2.2% for AGIs $100k-200k)
Earned income credit: $2,335 (reported on 17.9% of returns)
Here:
$2,335
State:
$2,404
(% of AGI for various income ranges: 5.6% for AGIs below $25k, 1.5% for AGIs $25k-50k)
Percentage of individuals using paid preparers for their 2012 taxes: 50.9%
Here:
51%
State:
52%
(% for various income ranges: 44.4% for AGIs below $25k, 48.3% for AGIs $25k-50k, 61.1% for AGIs $50k-75k, 50.0% for AGIs $75k-100k, 70.0% for AGIs $100k-200k)
Averages for the 2004 tax year for zip code 37052, filed in 2005:
Average Adjusted Gross Income (AGI) in 2004: $37,039 (Individual Income Tax Returns)
Here:
$37,039
State:
$44,088
Salary/wage: $34,688 (reported on 84.2% of returns)
Here:
$34,688
State:
$38,825
(% of AGI for various income ranges: 159.5% for AGIs below $10k, 74.0% for AGIs $10k-25k, 82.2% for AGIs $25k-50k, 82.6% for AGIs $50k-75k, 85.0% for AGIs $75k-100k, 59.4% for AGIs over 100k)
Taxable interest for individuals: $1,521 (reported on 37.7% of returns)
This zip code:
$1,521
Tennessee:
$1,802
(% of AGI for various income ranges: 9.4% for AGIs below $10k, 3.5% for AGIs $10k-25k, 1.1% for AGIs $25k-50k, 0.8% for AGIs $50k-75k, 0.9% for AGIs $75k-100k, 2.0% for AGIs over 100k)
Taxable dividends: $873 (reported on 14.0% of returns)
Here:
$873
State:
$3,727
(% of AGI for various income ranges: 1.1% for AGIs below $10k, 0.5% for AGIs $10k-25k, 0.2% for AGIs $25k-50k, 0.3% for AGIs $50k-75k, 0.2% for AGIs $75k-100k, 0.6% for AGIs over 100k)
Net capital gain/loss: +$3,048 (reported on 11.6% of returns)
Here:
+$3,048
State:
+$15,776
(% of AGI for various income ranges: -2.5% for AGIs below $10k, -0.3% for AGIs $10k-25k, 0.6% for AGIs $25k-50k, 2.1% for AGIs $50k-75k, 0.3% for AGIs $75k-100k, 1.5% for AGIs over 100k)
Profit/loss from business: +$9,937 (reported on 17.7% of returns)
Here:
+$9,937
State:
+$12,882
(% of AGI for various income ranges: 18.2% for AGIs below $10k, 7.7% for AGIs $10k-25k, 2.6% for AGIs $25k-50k, 3.5% for AGIs $50k-75k, 2.2% for AGIs $75k-100k, 9.3% for AGIs over 100k)
IRA payment deduction: $3,316 (reported on 1.8% of returns)
37052:
$3,316
Tennessee:
$2,934
Total itemized deductions: $14,544 (20% of AGI, reported on 19.2% of returns)
Here:
$14,544
State:
$18,035
Here:
20.4% of AGI
State:
19.9% of AGI
(% of AGI for various income ranges: 5.4% for AGIs $10k-25k, 6.7% for AGIs $25k-50k, 8.4% for AGIs $50k-75k, 8.0% for AGIs $75k-100k, 8.9% for AGIs over 100k)
Charity contributions deductions: $3,844 (5% of AGI, reported on 16.7% of returns)
Here:
$3,844
State:
$5,167
Here:
5.1% of AGI
State:
5.3% of AGI
(% of AGI for various income ranges: 0.8% for AGIs $10k-25k, 1.2% for AGIs $25k-50k, 1.7% for AGIs $50k-75k, 2.4% for AGIs $75k-100k, 2.6% for AGIs over 100k)
Total tax: $4,884 (reported on 72.7% of returns)
37052:
$4,884
State:
$7,482
(% of AGI for various income ranges: 5.2% for AGIs below $10k, 4.2% for AGIs $10k-25k, 6.0% for AGIs $25k-50k, 8.5% for AGIs $50k-75k, 10.9% for AGIs $75k-100k, 19.0% for AGIs over 100k)
Earned income credit: $1,743 (reported on 15.9% of returns)
Here:
$1,743
State:
$1,826
Percentage of individuals using paid preparers for their 2004 taxes: 56.2%
Here:
56%
State:
60%
(% for various income ranges: 43.2% for AGIs below $10k, 60.2% for AGIs $10k-25k, 57.1% for AGIs $25k-50k, 61.6% for AGIs $50k-75k, 56.4% for AGIs $75k-100k, 71.7% for AGIs over 100k)
Household received Food Stamps/SNAP in the past 12 months: 37 Household did not receive Food Stamps/SNAP in the past 12 months: 937
Women who had a birth in the past 12 months: 9 (0 now married, 9 unmarried) Women who did not have a birth in the past 12 months: 307 (137 now married, 169 unmarried)
Housing units in zip code 37052 with a mortgage: 356 (7 second mortgage, 7 both second mortgage and home equity loan) Median monthly owner costs for units with a mortgage: $1,323 Median monthly owner costs for units without a mortgage: $429
Residents with income below the poverty level in 2022:
This zip code:
7.8%
Whole state:
13.3%
Residents with income below 50% of the poverty level in 2022:
This zip code:
2.6%
Whole state:
7.1%
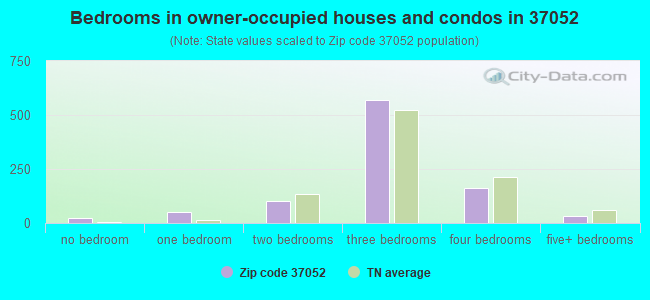
Median number of rooms in houses and condos:
Here:
6.5
State:
6.5
Notable locations in this zip code not listed on our city pages
Churches in zip code 37052 include: Locust Grove Church (A), Marion United Methodist Church (B), Sulphur Spring Church (C), Grays Chapel (D), Gum Springs Church (E), Hopewell Church (F), Marthas Chapel (G). Display/hide their locations on the map
Cemeteries: Yarbrough Cemetery (1), Baggett Cemetery (2), Batson Cemetery (3), Black Cemetery (4), Harvey Cemetery (5), Crockett Cemetery (6), Davis Cemetery (7). Display/hide their locations on the map
Housing units lacking complete plumbing facilities: 5.5% Housing units lacking complete kitchen facilities: 5.5%
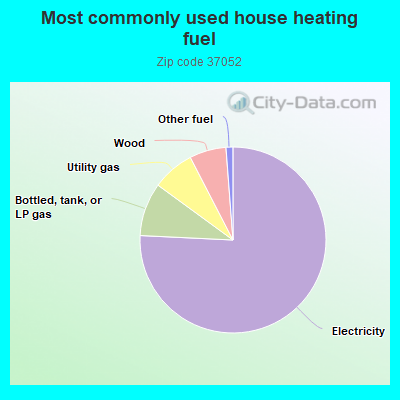
76.0%Electricity
9.3%Bottled, tank, or LP gas
7.4%Utility gas
6.4%Wood
1.2%Other fuel
Population in 1990: 2,163. Population change in the 1990s: +372 (+17.2%).
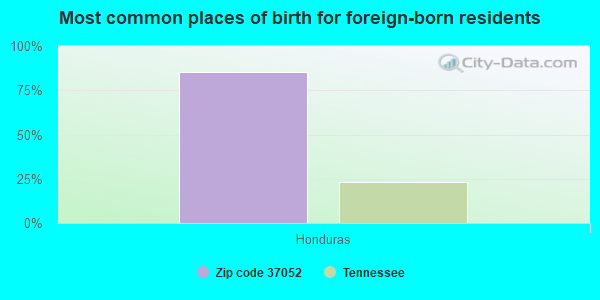
Place of birth for U.S.-born residents:
This state: 1,312
Northeast: 104
Midwest: 302
South: 297
West: 29
69% of the 37052 zip code residents lived in the same house 5 years ago. Out of people who lived in different houses, 64% lived in this county. Out of people who lived in different counties, 50% lived in Tennessee.
91% of the 37052 zip code residents lived in the same house 1 year ago. Out of people who lived in different houses, 92% moved from this county.
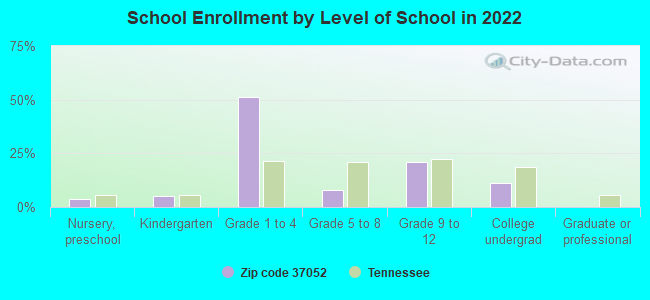
Private vs. public school enrollment:
Students in private schools in grades 1 to 8 (elementary and middle school): 83
Here:
32.8%
Tennessee:
15.0%
Students in private schools in grades 9 to 12 (high school):
Here:
0.0%
Tennessee:
16.2%
Students in private undergraduate colleges:
Here:
0.0%
Tennessee:
23.5%
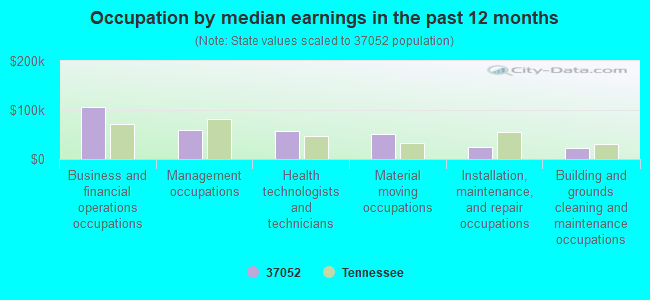
Occupation by median earnings in the past 12 months ($)
106,078Business and financial operations occupations
58,457Management occupations
57,755Health technologists and technicians
50,088Material moving occupations
24,801Installation, maintenance, and repair occupations
22,954Building and grounds cleaning and maintenance occupations
Top industries in this zip code by the number of employees in 2005:
Health Care and Social Assistance: Child Day Care Services (10-19 employees: 1 establishment)
Other Services (except Public Administration): Religious Organizations (5-9: 1, 1-4: 3)
Construction: Framing Contractors (5-9: 1)
Accommodation and Food Services: Full-Service Restaurants (1-4: 1)
Professional, Scientific, and Technical Services: Architectural Services (1-4: 1)
Professional, Scientific, and Technical Services: Veterinary Services (1-4: 1)
Other Services (except Public Administration): Automotive Transmission Repair (1-4: 1)
Fatal accident statistics in 2014:
Fatal accident count: 1
Vehicles involved in fatal accidents: 1
Fatal accidents caused by drunken drivers: 0
Fatalities: 2
Persons involved in fatal accidents: 2
Pedestrians involved in fatal accidents: 0
Fatal accident statistics in 2012:
Fatal accident count: 2
Vehicles involved in fatal accidents: 2
Fatal accidents caused by drunken drivers: 1
Fatalities: 2
Persons involved in fatal accidents: 2
Pedestrians involved in fatal accidents: 0
Home Mortgage Disclosure Act Aggregated Statistics For Year 2009 (Based on 2 partial tracts)
A) FHA, FSA/RHS & VA Home Purchase Loans
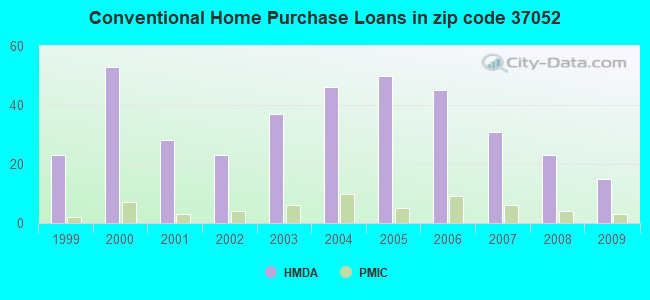
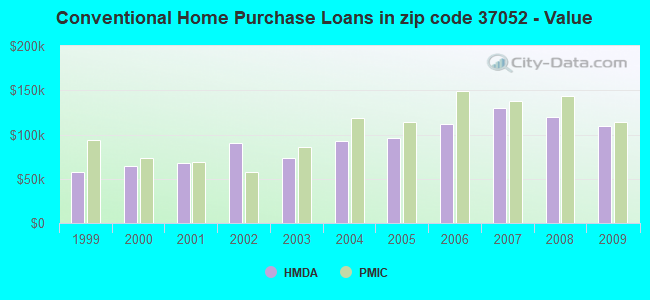
B) Conventional Home Purchase Loans
C) Refinancings
D) Home Improvement Loans
E) Loans on Dwellings For 5+ Families
F) Non-occupant Loans on < 5 Family Dwellings (A B C & D)
G) Loans On Manufactured Home Dwelling (A B C & D)
Number
Average Value
Number
Average Value
Number
Average Value
Number
Average Value
Number
Average Value
Number
Average Value
Number
Average Value
LOANS ORIGINATED
18
$162,976
15
$109,781
75
$157,870
8
$65,902
0
$0
9
$93,496
6
$81,750
APPLICATIONS APPROVED, NOT ACCEPTED
0
$0
2
$85,510
5
$116,462
2
$33,050
0
$0
0
$0
2
$77,380
APPLICATIONS DENIED
5
$143,216
5
$95,478
26
$136,598
7
$20,834
1
$47,210
2
$86,820
10
$75,490
APPLICATIONS WITHDRAWN
4
$123,412
2
$90,755
15
$161,297
1
$3,150
0
$0
1
$37,770
1
$106,490
FILES CLOSED FOR INCOMPLETENESS
1
$78,690
1
$78,690
4
$200,265
1
$53,510
0
$0
0
$0
1
$47,210
Aggregated Statistics For Year 2008 (Based on 2 partial tracts)
A) FHA, FSA/RHS & VA Home Purchase Loans
B) Conventional Home Purchase Loans
C) Refinancings
D) Home Improvement Loans
E) Loans on Dwellings For 5+ Families
F) Non-occupant Loans on < 5 Family Dwellings (A B C & D)
G) Loans On Manufactured Home Dwelling (A B C & D)
Number
Average Value
Number
Average Value
Number
Average Value
Number
Average Value
Number
Average Value
Number
Average Value
Number
Average Value
LOANS ORIGINATED
15
$145,909
23
$119,632
46
$148,975
13
$75,462
1
$146,360
8
$97,969
8
$81,051
APPLICATIONS APPROVED, NOT ACCEPTED
1
$82,360
2
$197,510
9
$91,339
0
$0
0
$0
1
$40,920
1
$81,310
APPLICATIONS DENIED
2
$125,115
7
$138,644
40
$120,579
21
$91,380
0
$0
3
$91,457
10
$77,169
APPLICATIONS WITHDRAWN
1
$24,130
6
$181,687
12
$124,505
2
$101,770
0
$0
1
$97,050
1
$78,170
FILES CLOSED FOR INCOMPLETENESS
0
$0
2
$191,740
3
$69,423
1
$19,410
0
$0
0
$0
0
$0
Aggregated Statistics For Year 2007 (Based on 2 partial tracts)
A) FHA, FSA/RHS & VA Home Purchase Loans
B) Conventional Home Purchase Loans
C) Refinancings
D) Home Improvement Loans
F) Non-occupant Loans on < 5 Family Dwellings (A B C & D)
G) Loans On Manufactured Home Dwelling (A B C & D)
Number
Average Value
Number
Average Value
Number
Average Value
Number
Average Value
Number
Average Value
Number
Average Value
LOANS ORIGINATED
14
$154,195
31
$129,610
54
$115,538
12
$36,198
7
$120,059
16
$74,166
APPLICATIONS APPROVED, NOT ACCEPTED
1
$204,070
5
$92,120
9
$160,352
2
$35,150
2
$65,575
2
$102,035
APPLICATIONS DENIED
3
$150,737
13
$111,618
43
$143,240
8
$48,656
2
$30,165
9
$75,134
APPLICATIONS WITHDRAWN
3
$127,127
6
$105,182
15
$114,013
3
$48,437
2
$39,085
2
$72,395
FILES CLOSED FOR INCOMPLETENESS
1
$33,050
0
$0
4
$155,412
1
$9,440
0
$0
0
$0
Aggregated Statistics For Year 2006 (Based on 2 partial tracts)
A) FHA, FSA/RHS & VA Home Purchase Loans
B) Conventional Home Purchase Loans
C) Refinancings
D) Home Improvement Loans
F) Non-occupant Loans on < 5 Family Dwellings (A B C & D)
G) Loans On Manufactured Home Dwelling (A B C & D)
Number
Average Value
Number
Average Value
Number
Average Value
Number
Average Value
Number
Average Value
Number
Average Value
LOANS ORIGINATED
17
$142,629
45
$111,705
54
$117,841
12
$39,082
8
$75,149
17
$65,853
APPLICATIONS APPROVED, NOT ACCEPTED
0
$0
8
$93,904
6
$82,450
1
$7,870
2
$66,100
3
$51,060
APPLICATIONS DENIED
3
$84,287
15
$83,831
42
$100,299
15
$44,206
5
$63,162
16
$69,411
APPLICATIONS WITHDRAWN
2
$89,180
8
$114,625
29
$116,769
3
$45,990
1
$20,460
3
$75,017
FILES CLOSED FOR INCOMPLETENESS
0
$0
0
$0
6
$103,697
0
$0
2
$63,215
0
$0
Aggregated Statistics For Year 2005 (Based on 2 partial tracts)
A) FHA, FSA/RHS & VA Home Purchase Loans
B) Conventional Home Purchase Loans
C) Refinancings
D) Home Improvement Loans
F) Non-occupant Loans on < 5 Family Dwellings (A B C & D)
G) Loans On Manufactured Home Dwelling (A B C & D)
Number
Average Value
Number
Average Value
Number
Average Value
Number
Average Value
Number
Average Value
Number
Average Value
LOANS ORIGINATED
14
$112,976
50
$95,729
74
$100,688
11
$22,224
9
$77,408
20
$66,047
APPLICATIONS APPROVED, NOT ACCEPTED
2
$114,100
14
$78,278
13
$90,433
3
$78,690
1
$33,570
4
$62,428
APPLICATIONS DENIED
4
$104,790
22
$74,612
57
$93,029
22
$32,692
5
$61,064
15
$53,929
APPLICATIONS WITHDRAWN
2
$93,640
8
$76,395
35
$103,541
4
$94,822
1
$29,380
2
$57,445
FILES CLOSED FOR INCOMPLETENESS
0
$0
2
$61,380
9
$119,726
1
$43,020
0
$0
1
$33,570
Aggregated Statistics For Year 2004 (Based on 2 partial tracts)
A) FHA, FSA/RHS & VA Home Purchase Loans
B) Conventional Home Purchase Loans
C) Refinancings
D) Home Improvement Loans
F) Non-occupant Loans on < 5 Family Dwellings (A B C & D)
G) Loans On Manufactured Home Dwelling (A B C & D)
Number
Average Value
Number
Average Value
Number
Average Value
Number
Average Value
Number
Average Value
Number
Average Value
LOANS ORIGINATED
12
$113,445
46
$92,124
74
$99,114
10
$29,430
9
$56,482
14
$58,118
APPLICATIONS APPROVED, NOT ACCEPTED
1
$52,980
3
$90,230
15
$72,605
4
$30,820
0
$0
3
$44,067
APPLICATIONS DENIED
2
$69,510
25
$73,360
57
$93,719
12
$23,476
5
$37,142
15
$52,215
APPLICATIONS WITHDRAWN
2
$99,410
6
$60,328
41
$104,920
1
$35,150
1
$36,720
5
$67,568
FILES CLOSED FOR INCOMPLETENESS
1
$73,440
2
$90,230
4
$95,608
0
$0
1
$33,570
1
$91,280
Aggregated Statistics For Year 2003 (Based on 2 partial tracts)
A) FHA, FSA/RHS & VA Home Purchase Loans
B) Conventional Home Purchase Loans
C) Refinancings
D) Home Improvement Loans
F) Non-occupant Loans on < 5 Family Dwellings (A B C & D)
Number
Average Value
Number
Average Value
Number
Average Value
Number
Average Value
Number
Average Value
LOANS ORIGINATED
7
$105,370
37
$72,948
148
$91,380
9
$25,239
11
$70,630
APPLICATIONS APPROVED, NOT ACCEPTED
2
$85,245
7
$61,153
22
$86,273
3
$32,350
1
$68,720
APPLICATIONS DENIED
3
$87,083
23
$84,757
68
$87,276
7
$28,329
1
$69,770
APPLICATIONS WITHDRAWN
2
$97,315
4
$75,018
33
$98,450
1
$23,610
1
$23,610
FILES CLOSED FOR INCOMPLETENESS
1
$36,720
1
$98,620
4
$88,658
1
$62,950
0
$0
Aggregated Statistics For Year 2002 (Based on 2 partial tracts)
A) FHA, FSA/RHS & VA Home Purchase Loans
B) Conventional Home Purchase Loans
C) Refinancings
D) Home Improvement Loans
F) Non-occupant Loans on < 5 Family Dwellings (A B C & D)
Number
Average Value
Number
Average Value
Number
Average Value
Number
Average Value
Number
Average Value
LOANS ORIGINATED
15
$103,906
23
$89,935
93
$85,470
8
$21,442
4
$67,805
APPLICATIONS APPROVED, NOT ACCEPTED
0
$0
9
$69,247
17
$76,499
4
$11,802
1
$18,360
APPLICATIONS DENIED
2
$60,065
17
$65,112
79
$73,570
8
$8,590
6
$58,055
APPLICATIONS WITHDRAWN
1
$40,390
2
$72,655
35
$86,934
2
$26,230
1
$52,980
FILES CLOSED FOR INCOMPLETENESS
1
$76,070
3
$96,700
8
$85,969
0
$0
0
$0
Aggregated Statistics For Year 2001 (Based on 2 partial tracts)
A) FHA, FSA/RHS & VA Home Purchase Loans
B) Conventional Home Purchase Loans
C) Refinancings
D) Home Improvement Loans
F) Non-occupant Loans on < 5 Family Dwellings (A B C & D)
Number
Average Value
Number
Average Value
Number
Average Value
Number
Average Value
Number
Average Value
LOANS ORIGINATED
9
$98,276
28
$67,880
92
$81,199
10
$13,430
6
$54,122
APPLICATIONS APPROVED, NOT ACCEPTED
1
$18,360
12
$70,209
17
$67,766
1
$2,100
1
$88,130
APPLICATIONS DENIED
3
$65,923
46
$59,816
50
$72,059
16
$15,181
3
$48,263
APPLICATIONS WITHDRAWN
1
$76,070
9
$73,736
18
$82,012
1
$7,870
1
$68,200
FILES CLOSED FOR INCOMPLETENESS
0
$0
1
$71,350
4
$77,772
0
$0
0
$0
Aggregated Statistics For Year 2000 (Based on 2 partial tracts)
A) FHA, FSA/RHS & VA Home Purchase Loans
B) Conventional Home Purchase Loans
C) Refinancings
D) Home Improvement Loans
F) Non-occupant Loans on < 5 Family Dwellings (A B C & D)
Number
Average Value
Number
Average Value
Number
Average Value
Number
Average Value
Number
Average Value
LOANS ORIGINATED
12
$90,887
53
$63,952
52
$72,980
21
$9,068
7
$27,279
APPLICATIONS APPROVED, NOT ACCEPTED
2
$39,605
18
$58,114
16
$47,706
6
$19,847
2
$27,280
APPLICATIONS DENIED
3
$59,103
41
$53,829
54
$56,463
13
$14,164
4
$47,082
APPLICATIONS WITHDRAWN
1
$66,100
9
$81,313
24
$72,941
2
$20,195
1
$44,590
FILES CLOSED FOR INCOMPLETENESS
0
$0
3
$45,117
6
$87,347
0
$0
1
$45,640
Aggregated Statistics For Year 1999 (Based on 1 partial tract)
A) FHA, FSA/RHS & VA Home Purchase Loans
B) Conventional Home Purchase Loans
C) Refinancings
D) Home Improvement Loans
F) Non-occupant Loans on < 5 Family Dwellings (A B C & D)
Detailed PMIC statistics for the following Tracts:1017.00
2002 - 2018 National Fire Incident Reporting System (NFIRS) incidents
Based on the data from the years 2002 - 2018 the average number of fires per year is 16. The highest number of fire incidents - 26 took place in 2004, and the least - 6 in 2018. The data has a decreasing trend.
When looking into fire subcategories, the most incidents belonged to: Outside Fires (47.4%), and Other (20.4%).
Fire incident types reported to NFIRS in Zip Code 37052

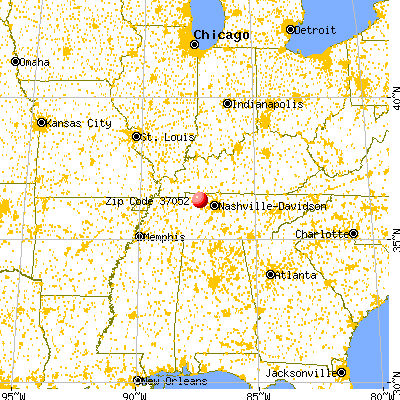


 Nearest zip codes: 37051, 37171, 37165, 37142, 37181, 37040.


 (Students: 1,031, Location: 3955 HWY 48, Grades: 9-12)


 Based on the data from the years 2002 - 2018 the average number of fires per year is 16. The highest number of fire incidents - 26 took place in 2004, and the least - 6 in 2018. The data has a decreasing trend.
 When looking into fire subcategories, the most incidents belonged to: Outside Fires (47.4%), and Other (20.4%).