Estimated zip code population in 2022: 6,456
Zip code population in 2010: 6,106
Zip code population in 2000: 6,364
Houses and condos: 2,818
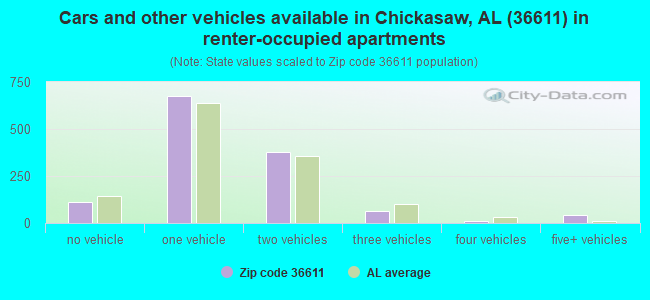
Renter-occupied apartments: 1,276
% of renters here:
52%State:
30%
March 2022 cost of living index in zip code 36611: 82.8
(low, U.S. average is 100)
Land area: 4.8
sq. mi.
Water area: 0.5
sq. mi.
Population density: 1,359 people per square mile (low).
OSM Map
General Map
Google Map
MSN Map
OSM Map
General Map
Google Map
MSN Map
OSM Map
General Map
Google Map
MSN Map
OSM Map
General Map
Google Map
MSN Map
Please wait while loading the map...
Real estate property taxes paid for housing units in 2022:
This zip code:
0.4% ($378)Alabama:
0.4% ($718)
Median real estate property taxes paid for housing units with mortgages in 2022: $388 (0.4%)
Median real estate property taxes paid for housing units with no mortgage in 2022: $370 (0.4%)
Business Search - 14 Million verified businesses
Males: 3,196 Females: 3,259
For population 25 years and over in 36611:
High school or higher: 88.6%Bachelor's degree or higher: 12.9%Graduate or professional degree: 2.7%Unemployed: 4.2%Mean travel time to work (commute): 20.9 minutes
For population 15 years and over in 36611:
Never married: 40.3%Now married: 35.5%Separated: 3.5%Widowed: 6.3%Divorced: 14.4%
Zip code 36611 compared to state average:
Median household income below state average. Median house value below state average. Black race population percentage above state average. Hispanic race population percentage below state average. Median age below state average. Renting percentage above state average. Length of stay since moving in above state average. House age above state average. Percentage of population with a bachelor's degree or higher significantly below state average. 3,175 49.2% Black 2,825 43.8% White 183 2.8% Two or more races 149 2.3% Hispanic or Latino 75 1.2% Asian 23 0.4% American Indian 23 0.4% Some other race
Data:
Median household income ($)
Median household income (% change since 2000)
Household income diversity
Ratio of average income to average house value (%)
Ratio of average income to average rent
Median household income ($) - White
Median household income ($) - Black or African American
Median household income ($) - Asian
Median household income ($) - Hispanic or Latino
Median household income ($) - American Indian and Alaska Native
Median household income ($) - Multirace
Median household income ($) - Other Race
Median household income for houses/condos with a mortgage ($)
Median household income for apartments without a mortgage ($)
Races - White alone (%)
Races - White alone (% change since 2000)
Races - Black alone (%)
Races - Black alone (% change since 2000)
Races - American Indian alone (%)
Races - American Indian alone (% change since 2000)
Races - Asian alone (%)
Races - Asian alone (% change since 2000)
Races - Hispanic (%)
Races - Hispanic (% change since 2000)
Races - Native Hawaiian and Other Pacific Islander alone (%)
Races - Native Hawaiian and Other Pacific Islander alone (% change since 2000)
Races - Two or more races (%)
Races - Two or more races (% change since 2000)
Races - Other race alone (%)
Races - Other race alone (% change since 2000)
Racial diversity
Unemployment (%)
Unemployment (% change since 2000)
Unemployment (%) - White
Unemployment (%) - Black or African American
Unemployment (%) - Asian
Unemployment (%) - Hispanic or Latino
Unemployment (%) - American Indian and Alaska Native
Unemployment (%) - Multirace
Unemployment (%) - Other Race
Population density (people per square mile)
Population - Males (%)
Population - Females (%)
Population - Males (%) - White
Population - Males (%) - Black or African American
Population - Males (%) - Asian
Population - Males (%) - Hispanic or Latino
Population - Males (%) - American Indian and Alaska Native
Population - Males (%) - Multirace
Population - Males (%) - Other Race
Population - Females (%) - White
Population - Females (%) - Black or African American
Population - Females (%) - Asian
Population - Females (%) - Hispanic or Latino
Population - Females (%) - American Indian and Alaska Native
Population - Females (%) - Multirace
Population - Females (%) - Other Race
Coronavirus confirmed cases (May 24, 2024)
Deaths caused by coronavirus (May 24, 2024)
Coronavirus confirmed cases (per 100k population) (May 24, 2024)
Deaths caused by coronavirus (per 100k population) (May 24, 2024)
Daily increase in number of cases (May 24, 2024)
Weekly increase in number of cases (May 24, 2024)
Cases doubled (in days) (May 24, 2024)
Hospitalized patients (Apr 18, 2022)
Negative test results (Apr 18, 2022)
Total test results (Apr 18, 2022)
COVID Vaccine doses distributed (per 100k population) (Sep 19, 2023)
COVID Vaccine doses administered (per 100k population) (Sep 19, 2023)
COVID Vaccine doses distributed (Sep 19, 2023)
COVID Vaccine doses administered (Sep 19, 2023)
Likely homosexual households (%)
Likely homosexual households (% change since 2000)
Likely homosexual households - Lesbian couples (%)
Likely homosexual households - Lesbian couples (% change since 2000)
Likely homosexual households - Gay men (%)
Likely homosexual households - Gay men (% change since 2000)
Cost of living index
Median gross rent ($)
Median contract rent ($)
Median monthly housing costs ($)
Median house or condo value ($)
Median house or condo value ($ change since 2000)
Mean house or condo value by units in structure - 1, detached ($)
Mean house or condo value by units in structure - 1, attached ($)
Mean house or condo value by units in structure - 2 ($)
Mean house or condo value by units in structure by units in structure - 3 or 4 ($)
Mean house or condo value by units in structure - 5 or more ($)
Mean house or condo value by units in structure - Boat, RV, van, etc. ($)
Mean house or condo value by units in structure - Mobile home ($)
Median house or condo value ($) - White
Median house or condo value ($) - Black or African American
Median house or condo value ($) - Asian
Median house or condo value ($) - Hispanic or Latino
Median house or condo value ($) - American Indian and Alaska Native
Median house or condo value ($) - Multirace
Median house or condo value ($) - Other Race
Median resident age
Resident age diversity
Median resident age - Males
Median resident age - Females
Median resident age - White
Median resident age - Black or African American
Median resident age - Asian
Median resident age - Hispanic or Latino
Median resident age - American Indian and Alaska Native
Median resident age - Multirace
Median resident age - Other Race
Median resident age - Males - White
Median resident age - Males - Black or African American
Median resident age - Males - Asian
Median resident age - Males - Hispanic or Latino
Median resident age - Males - American Indian and Alaska Native
Median resident age - Males - Multirace
Median resident age - Males - Other Race
Median resident age - Females - White
Median resident age - Females - Black or African American
Median resident age - Females - Asian
Median resident age - Females - Hispanic or Latino
Median resident age - Females - American Indian and Alaska Native
Median resident age - Females - Multirace
Median resident age - Females - Other Race
Commute - mean travel time to work (minutes)
Travel time to work - Less than 5 minutes (%)
Travel time to work - Less than 5 minutes (% change since 2000)
Travel time to work - 5 to 9 minutes (%)
Travel time to work - 5 to 9 minutes (% change since 2000)
Travel time to work - 10 to 19 minutes (%)
Travel time to work - 10 to 19 minutes (% change since 2000)
Travel time to work - 20 to 29 minutes (%)
Travel time to work - 20 to 29 minutes (% change since 2000)
Travel time to work - 30 to 39 minutes (%)
Travel time to work - 30 to 39 minutes (% change since 2000)
Travel time to work - 40 to 59 minutes (%)
Travel time to work - 40 to 59 minutes (% change since 2000)
Travel time to work - 60 to 89 minutes (%)
Travel time to work - 60 to 89 minutes (% change since 2000)
Travel time to work - 90 or more minutes (%)
Travel time to work - 90 or more minutes (% change since 2000)
Marital status - Never married (%)
Marital status - Now married (%)
Marital status - Separated (%)
Marital status - Widowed (%)
Marital status - Divorced (%)
Median family income ($)
Median family income (% change since 2000)
Median non-family income ($)
Median non-family income (% change since 2000)
Median per capita income ($)
Median per capita income (% change since 2000)
Median family income ($) - White
Median family income ($) - Black or African American
Median family income ($) - Asian
Median family income ($) - Hispanic or Latino
Median family income ($) - American Indian and Alaska Native
Median family income ($) - Multirace
Median family income ($) - Other Race
Median year house/condo built
Median year apartment built
Year house built - Built 2005 or later (%)
Year house built - Built 2000 to 2004 (%)
Year house built - Built 1990 to 1999 (%)
Year house built - Built 1980 to 1989 (%)
Year house built - Built 1970 to 1979 (%)
Year house built - Built 1960 to 1969 (%)
Year house built - Built 1950 to 1959 (%)
Year house built - Built 1940 to 1949 (%)
Year house built - Built 1939 or earlier (%)
Average household size
Household density (households per square mile)
Average household size - White
Average household size - Black or African American
Average household size - Asian
Average household size - Hispanic or Latino
Average household size - American Indian and Alaska Native
Average household size - Multirace
Average household size - Other Race
Occupied housing units (%)
Vacant housing units (%)
Owner occupied housing units (%)
Renter occupied housing units (%)
Vacancy status - For rent (%)
Vacancy status - For sale only (%)
Vacancy status - Rented or sold, not occupied (%)
Vacancy status - For seasonal, recreational, or occasional use (%)
Vacancy status - For migrant workers (%)
Vacancy status - Other vacant (%)
Residents with income below the poverty level (%)
Residents with income below 50% of the poverty level (%)
Children below poverty level (%)
Poor families by family type - Married-couple family (%)
Poor families by family type - Male, no wife present (%)
Poor families by family type - Female, no husband present (%)
Poverty status for native-born residents (%)
Poverty status for foreign-born residents (%)
Poverty among high school graduates not in families (%)
Poverty among people who did not graduate high school not in families (%)
Residents with income below the poverty level (%) - White
Residents with income below the poverty level (%) - Black or African American
Residents with income below the poverty level (%) - Asian
Residents with income below the poverty level (%) - Hispanic or Latino
Residents with income below the poverty level (%) - American Indian and Alaska Native
Residents with income below the poverty level (%) - Multirace
Residents with income below the poverty level (%) - Other Race
Air pollution - Air Quality Index (AQI)
Air pollution - CO
Air pollution - NO2
Air pollution - SO2
Air pollution - Ozone
Air pollution - PM10
Air pollution - PM25
Air pollution - Pb
Crime - Murders per 100,000 population
Crime - Rapes per 100,000 population
Crime - Robberies per 100,000 population
Crime - Assaults per 100,000 population
Crime - Burglaries per 100,000 population
Crime - Thefts per 100,000 population
Crime - Auto thefts per 100,000 population
Crime - Arson per 100,000 population
Crime - City-data.com crime index
Crime - Violent crime index
Crime - Property crime index
Crime - Murders per 100,000 population (5 year average)
Crime - Rapes per 100,000 population (5 year average)
Crime - Robberies per 100,000 population (5 year average)
Crime - Assaults per 100,000 population (5 year average)
Crime - Burglaries per 100,000 population (5 year average)
Crime - Thefts per 100,000 population (5 year average)
Crime - Auto thefts per 100,000 population (5 year average)
Crime - Arson per 100,000 population (5 year average)
Crime - City-data.com crime index (5 year average)
Crime - Violent crime index (5 year average)
Crime - Property crime index (5 year average)
1996 Presidential Elections Results (%) - Democratic Party (Clinton)
1996 Presidential Elections Results (%) - Republican Party (Dole)
1996 Presidential Elections Results (%) - Other
2000 Presidential Elections Results (%) - Democratic Party (Gore)
2000 Presidential Elections Results (%) - Republican Party (Bush)
2000 Presidential Elections Results (%) - Other
2004 Presidential Elections Results (%) - Democratic Party (Kerry)
2004 Presidential Elections Results (%) - Republican Party (Bush)
2004 Presidential Elections Results (%) - Other
2008 Presidential Elections Results (%) - Democratic Party (Obama)
2008 Presidential Elections Results (%) - Republican Party (McCain)
2008 Presidential Elections Results (%) - Other
2012 Presidential Elections Results (%) - Democratic Party (Obama)
2012 Presidential Elections Results (%) - Republican Party (Romney)
2012 Presidential Elections Results (%) - Other
2016 Presidential Elections Results (%) - Democratic Party (Clinton)
2016 Presidential Elections Results (%) - Republican Party (Trump)
2016 Presidential Elections Results (%) - Other
2020 Presidential Elections Results (%) - Democratic Party (Biden)
2020 Presidential Elections Results (%) - Republican Party (Trump)
2020 Presidential Elections Results (%) - Other
Ancestries Reported - Arab (%)
Ancestries Reported - Czech (%)
Ancestries Reported - Danish (%)
Ancestries Reported - Dutch (%)
Ancestries Reported - English (%)
Ancestries Reported - French (%)
Ancestries Reported - French Canadian (%)
Ancestries Reported - German (%)
Ancestries Reported - Greek (%)
Ancestries Reported - Hungarian (%)
Ancestries Reported - Irish (%)
Ancestries Reported - Italian (%)
Ancestries Reported - Lithuanian (%)
Ancestries Reported - Norwegian (%)
Ancestries Reported - Polish (%)
Ancestries Reported - Portuguese (%)
Ancestries Reported - Russian (%)
Ancestries Reported - Scotch-Irish (%)
Ancestries Reported - Scottish (%)
Ancestries Reported - Slovak (%)
Ancestries Reported - Subsaharan African (%)
Ancestries Reported - Swedish (%)
Ancestries Reported - Swiss (%)
Ancestries Reported - Ukrainian (%)
Ancestries Reported - United States (%)
Ancestries Reported - Welsh (%)
Ancestries Reported - West Indian (%)
Ancestries Reported - Other (%)
Educational Attainment - No schooling completed (%)
Educational Attainment - Less than high school (%)
Educational Attainment - High school or equivalent (%)
Educational Attainment - Less than 1 year of college (%)
Educational Attainment - 1 or more years of college (%)
Educational Attainment - Associate degree (%)
Educational Attainment - Bachelor's degree (%)
Educational Attainment - Master's degree (%)
Educational Attainment - Professional school degree (%)
Educational Attainment - Doctorate degree (%)
School Enrollment - Nursery, preschool (%)
School Enrollment - Kindergarten (%)
School Enrollment - Grade 1 to 4 (%)
School Enrollment - Grade 5 to 8 (%)
School Enrollment - Grade 9 to 12 (%)
School Enrollment - College undergrad (%)
School Enrollment - Graduate or professional (%)
School Enrollment - Not enrolled in school (%)
School enrollment - Public schools (%)
School enrollment - Private schools (%)
School enrollment - Not enrolled (%)
Median number of rooms in houses and condos
Median number of rooms in apartments
Housing units lacking complete plumbing facilities (%)
Housing units lacking complete kitchen facilities (%)
Density of houses
Urban houses (%)
Rural houses (%)
Households with people 60 years and over (%)
Households with people 65 years and over (%)
Households with people 75 years and over (%)
Households with one or more nonrelatives (%)
Households with no nonrelatives (%)
Population in households (%)
Family households (%)
Nonfamily households (%)
Population in families (%)
Family households with own children (%)
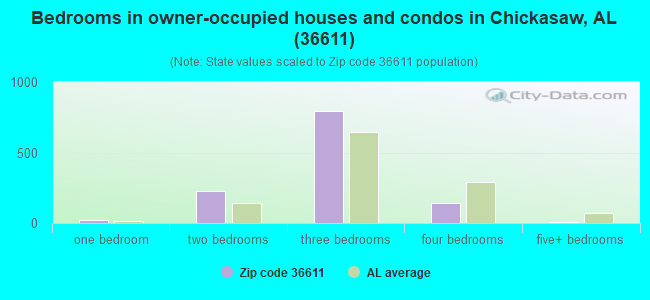
Median number of bedrooms in owner occupied houses
Mean number of bedrooms in owner occupied houses
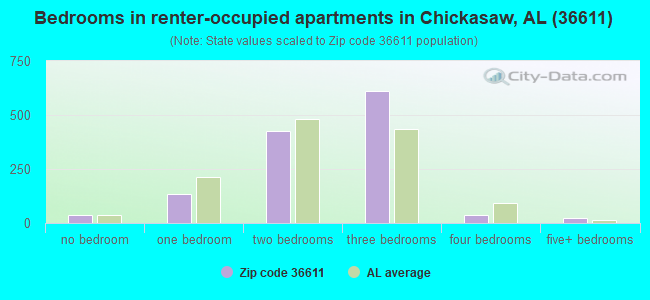
Median number of bedrooms in renter occupied houses
Mean number of bedrooms in renter occupied houses
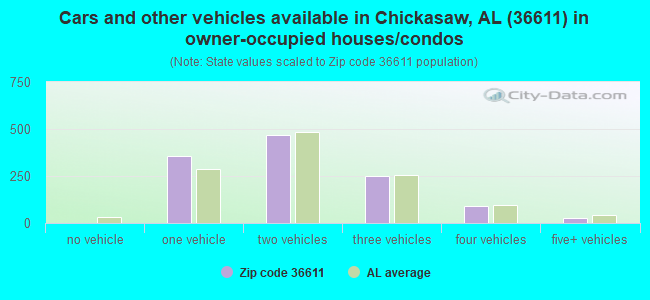
Median number of vehichles in owner occupied houses
Mean number of vehichles in owner occupied houses
Median number of vehichles in renter occupied houses
Mean number of vehichles in renter occupied houses
Mortgage status - with mortgage (%)
Mortgage status - with second mortgage (%)
Mortgage status - with home equity loan (%)
Mortgage status - with both second mortgage and home equity loan (%)
Mortgage status - without a mortgage (%)
Average family size
Average family size - White
Average family size - Black or African American
Average family size - Asian
Average family size - Hispanic or Latino
Average family size - American Indian and Alaska Native
Average family size - Multirace
Average family size - Other Race
Geographical mobility - Same house 1 year ago (%)
Geographical mobility - Moved within same county (%)
Geographical mobility - Moved from different county within same state (%)
Geographical mobility - Moved from different state (%)
Geographical mobility - Moved from abroad (%)
Place of birth - Born in state of residence (%)
Place of birth - Born in other state (%)
Place of birth - Native, outside of US (%)
Place of birth - Foreign born (%)
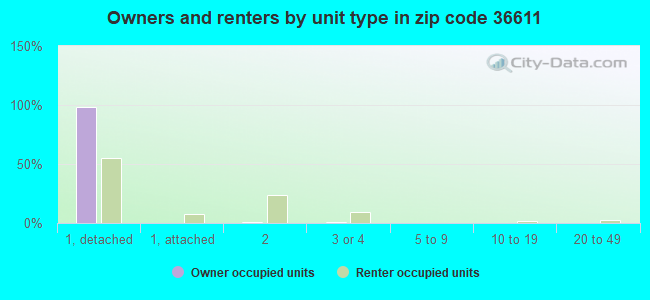
Housing units in structures - 1, detached (%)
Housing units in structures - 1, attached (%)
Housing units in structures - 2 (%)
Housing units in structures - 3 or 4 (%)
Housing units in structures - 5 to 9 (%)
Housing units in structures - 10 to 19 (%)
Housing units in structures - 20 to 49 (%)
Housing units in structures - 50 or more (%)
Housing units in structures - Mobile home (%)
Housing units in structures - Boat, RV, van, etc. (%)
House/condo owner moved in on average (years ago)
Renter moved in on average (years ago)
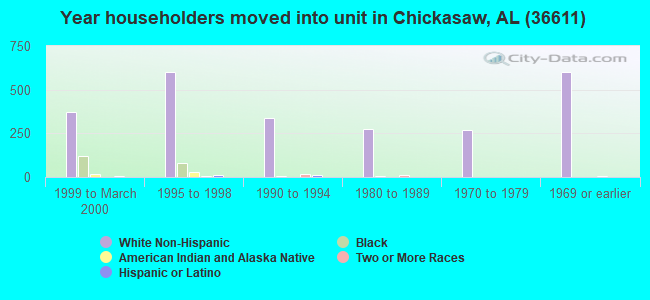
Year householder moved into unit - Moved in 1999 to March 2000 (%)
Year householder moved into unit - Moved in 1995 to 1998 (%)
Year householder moved into unit - Moved in 1990 to 1994 (%)
Year householder moved into unit - Moved in 1980 to 1989 (%)
Year householder moved into unit - Moved in 1970 to 1979 (%)
Year householder moved into unit - Moved in 1969 or earlier (%)
Means of transportation to work - Drove car alone (%)
Means of transportation to work - Carpooled (%)
Means of transportation to work - Public transportation (%)
Means of transportation to work - Bus or trolley bus (%)
Means of transportation to work - Streetcar or trolley car (%)
Means of transportation to work - Subway or elevated (%)
Means of transportation to work - Railroad (%)
Means of transportation to work - Ferryboat (%)
Means of transportation to work - Taxicab (%)
Means of transportation to work - Motorcycle (%)
Means of transportation to work - Bicycle (%)
Means of transportation to work - Walked (%)
Means of transportation to work - Other means (%)
Working at home (%)
Industry diversity
Most Common Industries - Agriculture, forestry, fishing and hunting, and mining (%)
Most Common Industries - Agriculture, forestry, fishing and hunting (%)
Most Common Industries - Mining, quarrying, and oil and gas extraction (%)
Most Common Industries - Construction (%)
Most Common Industries - Manufacturing (%)
Most Common Industries - Wholesale trade (%)
Most Common Industries - Retail trade (%)
Most Common Industries - Transportation and warehousing, and utilities (%)
Most Common Industries - Transportation and warehousing (%)
Most Common Industries - Utilities (%)
Most Common Industries - Information (%)
Most Common Industries - Finance and insurance, and real estate and rental and leasing (%)
Most Common Industries - Finance and insurance (%)
Most Common Industries - Real estate and rental and leasing (%)
Most Common Industries - Professional, scientific, and management, and administrative and waste management services (%)
Most Common Industries - Professional, scientific, and technical services (%)
Most Common Industries - Management of companies and enterprises (%)
Most Common Industries - Administrative and support and waste management services (%)
Most Common Industries - Educational services, and health care and social assistance (%)
Most Common Industries - Educational services (%)
Most Common Industries - Health care and social assistance (%)
Most Common Industries - Arts, entertainment, and recreation, and accommodation and food services (%)
Most Common Industries - Arts, entertainment, and recreation (%)
Most Common Industries - Accommodation and food services (%)
Most Common Industries - Other services, except public administration (%)
Most Common Industries - Public administration (%)
Occupation diversity
Most Common Occupations - Management, business, science, and arts occupations (%)
Most Common Occupations - Management, business, and financial occupations (%)
Most Common Occupations - Management occupations (%)
Most Common Occupations - Business and financial operations occupations (%)
Most Common Occupations - Computer, engineering, and science occupations (%)
Most Common Occupations - Computer and mathematical occupations (%)
Most Common Occupations - Architecture and engineering occupations (%)
Most Common Occupations - Life, physical, and social science occupations (%)
Most Common Occupations - Education, legal, community service, arts, and media occupations (%)
Most Common Occupations - Community and social service occupations (%)
Most Common Occupations - Legal occupations (%)
Most Common Occupations - Education, training, and library occupations (%)
Most Common Occupations - Arts, design, entertainment, sports, and media occupations (%)
Most Common Occupations - Healthcare practitioners and technical occupations (%)
Most Common Occupations - Health diagnosing and treating practitioners and other technical occupations (%)
Most Common Occupations - Health technologists and technicians (%)
Most Common Occupations - Service occupations (%)
Most Common Occupations - Healthcare support occupations (%)
Most Common Occupations - Protective service occupations (%)
Most Common Occupations - Fire fighting and prevention, and other protective service workers including supervisors (%)
Most Common Occupations - Law enforcement workers including supervisors (%)
Most Common Occupations - Food preparation and serving related occupations (%)
Most Common Occupations - Building and grounds cleaning and maintenance occupations (%)
Most Common Occupations - Personal care and service occupations (%)
Most Common Occupations - Sales and office occupations (%)
Most Common Occupations - Sales and related occupations (%)
Most Common Occupations - Office and administrative support occupations (%)
Most Common Occupations - Natural resources, construction, and maintenance occupations (%)
Most Common Occupations - Farming, fishing, and forestry occupations (%)
Most Common Occupations - Construction and extraction occupations (%)
Most Common Occupations - Installation, maintenance, and repair occupations (%)
Most Common Occupations - Production, transportation, and material moving occupations (%)
Most Common Occupations - Production occupations (%)
Most Common Occupations - Transportation occupations (%)
Most Common Occupations - Material moving occupations (%)
People in Group quarters - Institutionalized population (%)
People in Group quarters - Correctional institutions (%)
People in Group quarters - Federal prisons and detention centers (%)
People in Group quarters - Halfway houses (%)
People in Group quarters - Local jails and other confinement facilities (including police lockups) (%)
People in Group quarters - Military disciplinary barracks (%)
People in Group quarters - State prisons (%)
People in Group quarters - Other types of correctional institutions (%)
People in Group quarters - Nursing homes (%)
People in Group quarters - Hospitals/wards, hospices, and schools for the handicapped (%)
People in Group quarters - Hospitals/wards and hospices for chronically ill (%)
People in Group quarters - Hospices or homes for chronically ill (%)
People in Group quarters - Military hospitals or wards for chronically ill (%)
People in Group quarters - Other hospitals or wards for chronically ill (%)
People in Group quarters - Hospitals or wards for drug/alcohol abuse (%)
People in Group quarters - Mental (Psychiatric) hospitals or wards (%)
People in Group quarters - Schools, hospitals, or wards for the mentally retarded (%)
People in Group quarters - Schools, hospitals, or wards for the physically handicapped (%)
People in Group quarters - Institutions for the deaf (%)
People in Group quarters - Institutions for the blind (%)
People in Group quarters - Orthopedic wards and institutions for the physically handicapped (%)
People in Group quarters - Wards in general hospitals for patients who have no usual home elsewhere (%)
People in Group quarters - Wards in military hospitals for patients who have no usual home elsewhere (%)
People in Group quarters - Juvenile institutions (%)
People in Group quarters - Long-term care (%)
People in Group quarters - Homes for abused, dependent, and neglected children (%)
People in Group quarters - Residential treatment centers for emotionally disturbed children (%)
People in Group quarters - Training schools for juvenile delinquents (%)
People in Group quarters - Short-term care, detention or diagnostic centers for delinquent children (%)
People in Group quarters - Type of juvenile institution unknown (%)
People in Group quarters - Noninstitutionalized population (%)
People in Group quarters - College dormitories (includes college quarters off campus) (%)
People in Group quarters - Military quarters (%)
People in Group quarters - On base (%)
People in Group quarters - Barracks, unaccompanied personnel housing (UPH), (Enlisted/Officer), ;and similar group living quarters for military personnel (%)
People in Group quarters - Transient quarters for temporary residents (%)
People in Group quarters - Military ships (%)
People in Group quarters - Group homes (%)
People in Group quarters - Homes or halfway houses for drug/alcohol abuse (%)
People in Group quarters - Homes for the mentally ill (%)
People in Group quarters - Homes for the mentally retarded (%)
People in Group quarters - Homes for the physically handicapped (%)
People in Group quarters - Other group homes (%)
People in Group quarters - Religious group quarters (%)
People in Group quarters - Dormitories (%)
People in Group quarters - Agriculture workers' dormitories on farms (%)
People in Group quarters - Job Corps and vocational training facilities (%)
People in Group quarters - Other workers' dormitories (%)
People in Group quarters - Crews of maritime vessels (%)
People in Group quarters - Other nonhousehold living situations (%)
People in Group quarters - Other noninstitutional group quarters (%)
Residents speaking English at home (%)
Residents speaking English at home - Born in the United States (%)
Residents speaking English at home - Native, born elsewhere (%)
Residents speaking English at home - Foreign born (%)
Residents speaking Spanish at home (%)
Residents speaking Spanish at home - Born in the United States (%)
Residents speaking Spanish at home - Native, born elsewhere (%)
Residents speaking Spanish at home - Foreign born (%)
Residents speaking other language at home (%)
Residents speaking other language at home - Born in the United States (%)
Residents speaking other language at home - Native, born elsewhere (%)
Residents speaking other language at home - Foreign born (%)
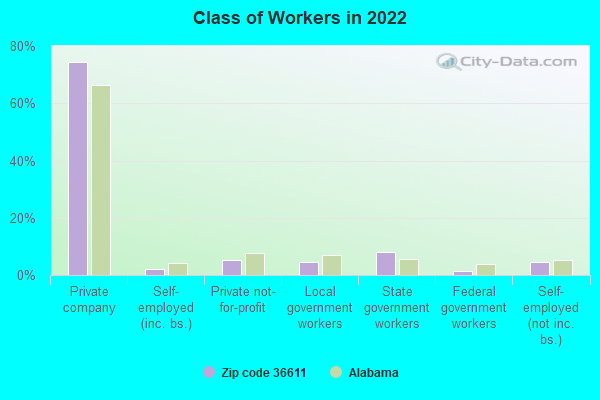
Class of Workers - Employee of private company (%)
Class of Workers - Self-employed in own incorporated business (%)
Class of Workers - Private not-for-profit wage and salary workers (%)
Class of Workers - Local government workers (%)
Class of Workers - State government workers (%)
Class of Workers - Federal government workers (%)
Class of Workers - Self-employed workers in own not incorporated business and Unpaid family workers (%)
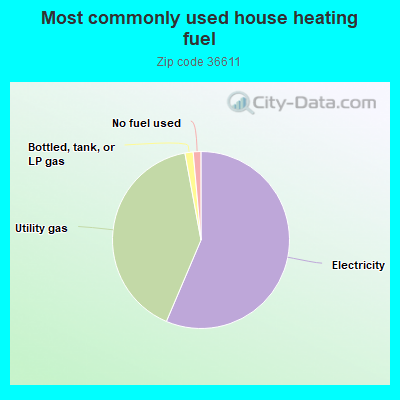
House heating fuel used in houses and condos - Utility gas (%)
House heating fuel used in houses and condos - Bottled, tank, or LP gas (%)
House heating fuel used in houses and condos - Electricity (%)
House heating fuel used in houses and condos - Fuel oil, kerosene, etc. (%)
House heating fuel used in houses and condos - Coal or coke (%)
House heating fuel used in houses and condos - Wood (%)
House heating fuel used in houses and condos - Solar energy (%)
House heating fuel used in houses and condos - Other fuel (%)
House heating fuel used in houses and condos - No fuel used (%)
House heating fuel used in apartments - Utility gas (%)
House heating fuel used in apartments - Bottled, tank, or LP gas (%)
House heating fuel used in apartments - Electricity (%)
House heating fuel used in apartments - Fuel oil, kerosene, etc. (%)
House heating fuel used in apartments - Coal or coke (%)
House heating fuel used in apartments - Wood (%)
House heating fuel used in apartments - Solar energy (%)
House heating fuel used in apartments - Other fuel (%)
House heating fuel used in apartments - No fuel used (%)
Armed forces status - In Armed Forces (%)
Armed forces status - Civilian (%)
Armed forces status - Civilian - Veteran (%)
Armed forces status - Civilian - Nonveteran (%)
Fatal accidents locations in years 2005-2021
Fatal accidents locations in 2005
Fatal accidents locations in 2006
Fatal accidents locations in 2007
Fatal accidents locations in 2008
Fatal accidents locations in 2009
Fatal accidents locations in 2010
Fatal accidents locations in 2011
Fatal accidents locations in 2012
Fatal accidents locations in 2013
Fatal accidents locations in 2014
Fatal accidents locations in 2015
Fatal accidents locations in 2016
Fatal accidents locations in 2017
Fatal accidents locations in 2018
Fatal accidents locations in 2019
Fatal accidents locations in 2020
Fatal accidents locations in 2021
Alcohol use - People drinking some alcohol every month (%)
Alcohol use - People not drinking at all (%)
Alcohol use - Average days/month drinking alcohol
Alcohol use - Average drinks/week
Alcohol use - Average days/year people drink much
Audiometry - Average condition of hearing (%)
Audiometry - People that can hear a whisper from across a quiet room (%)
Audiometry - People that can hear normal voice from across a quiet room (%)
Audiometry - Ears ringing, roaring, buzzing (%)
Audiometry - Had a job exposure to loud noise (%)
Audiometry - Had off-work exposure to loud noise (%)
Blood Pressure & Cholesterol - Has high blood pressure (%)
Blood Pressure & Cholesterol - Checking blood pressure at home (%)
Blood Pressure & Cholesterol - Frequently checking blood cholesterol (%)
Blood Pressure & Cholesterol - Has high cholesterol level (%)
Consumer Behavior - Money monthly spent on food at supermarket/grocery store
Consumer Behavior - Money monthly spent on food at other stores
Consumer Behavior - Money monthly spent on eating out
Consumer Behavior - Money monthly spent on carryout/delivered foods
Consumer Behavior - Income spent on food at supermarket/grocery store (%)
Consumer Behavior - Income spent on food at other stores (%)
Consumer Behavior - Income spent on eating out (%)
Consumer Behavior - Income spent on carryout/delivered foods (%)
Current Health Status - General health condition (%)
Current Health Status - Blood donors (%)
Current Health Status - Has blood ever tested for HIV virus (%)
Current Health Status - Left-handed people (%)
Dermatology - People using sunscreen (%)
Diabetes - Diabetics (%)
Diabetes - Had a blood test for high blood sugar (%)
Diabetes - People taking insulin (%)
Diet Behavior & Nutrition - Diet health (%)
Diet Behavior & Nutrition - Milk product consumption (# of products/month)
Diet Behavior & Nutrition - Meals not home prepared (#/week)
Diet Behavior & Nutrition - Meals from fast food or pizza place (#/week)
Diet Behavior & Nutrition - Ready-to-eat foods (#/month)
Diet Behavior & Nutrition - Frozen meals/pizza (#/month)
Drug Use - People that ever used marijuana or hashish (%)
Drug Use - Ever used hard drugs (%)
Drug Use - Ever used any form of cocaine (%)
Drug Use - Ever used heroin (%)
Drug Use - Ever used methamphetamine (%)
Health Insurance - People covered by health insurance (%)
Kidney Conditions-Urology - Avg. # of times urinating at night
Medical Conditions - People with asthma (%)
Medical Conditions - People with anemia (%)
Medical Conditions - People with psoriasis (%)
Medical Conditions - People with overweight (%)
Medical Conditions - Elderly people having difficulties in thinking or remembering (%)
Medical Conditions - People who ever received blood transfusion (%)
Medical Conditions - People having trouble seeing even with glass/contacts (%)
Medical Conditions - People with arthritis (%)
Medical Conditions - People with gout (%)
Medical Conditions - People with congestive heart failure (%)
Medical Conditions - People with coronary heart disease (%)
Medical Conditions - People with angina pectoris (%)
Medical Conditions - People who ever had heart attack (%)
Medical Conditions - People who ever had stroke (%)
Medical Conditions - People with emphysema (%)
Medical Conditions - People with thyroid problem (%)
Medical Conditions - People with chronic bronchitis (%)
Medical Conditions - People with any liver condition (%)
Medical Conditions - People who ever had cancer or malignancy (%)
Mental Health - People who have little interest in doing things (%)
Mental Health - People feeling down, depressed, or hopeless (%)
Mental Health - People who have trouble sleeping or sleeping too much (%)
Mental Health - People feeling tired or having little energy (%)
Mental Health - People with poor appetite or overeating (%)
Mental Health - People feeling bad about themself (%)
Mental Health - People who have trouble concentrating on things (%)
Mental Health - People moving or speaking slowly or too fast (%)
Mental Health - People having thoughts they would be better off dead (%)
Oral Health - Average years since last visit a dentist
Oral Health - People embarrassed because of mouth (%)
Oral Health - People with gum disease (%)
Oral Health - General health of teeth and gums (%)
Oral Health - Average days a week using dental floss/device
Oral Health - Average days a week using mouthwash for dental problem
Oral Health - Average number of teeth
Pesticide Use - Households using pesticides to control insects (%)
Pesticide Use - Households using pesticides to kill weeds (%)
Physical Activity - People doing vigorous-intensity work activities (%)
Physical Activity - People doing moderate-intensity work activities (%)
Physical Activity - People walking or bicycling (%)
Physical Activity - People doing vigorous-intensity recreational activities (%)
Physical Activity - People doing moderate-intensity recreational activities (%)
Physical Activity - Average hours a day doing sedentary activities
Physical Activity - Average hours a day watching TV or videos
Physical Activity - Average hours a day using computer
Physical Functioning - People having limitations keeping them from working (%)
Physical Functioning - People limited in amount of work they can do (%)
Physical Functioning - People that need special equipment to walk (%)
Physical Functioning - People experiencing confusion/memory problems (%)
Physical Functioning - People requiring special healthcare equipment (%)
Prescription Medications - Average number of prescription medicines taking
Preventive Aspirin Use - Adults 40+ taking low-dose aspirin (%)
Reproductive Health - Vaginal deliveries (%)
Reproductive Health - Cesarean deliveries (%)
Reproductive Health - Deliveries resulted in a live birth (%)
Reproductive Health - Pregnancies resulted in a delivery (%)
Reproductive Health - Women breastfeeding newborns (%)
Reproductive Health - Women that had a hysterectomy (%)
Reproductive Health - Women that had both ovaries removed (%)
Reproductive Health - Women that have ever taken birth control pills (%)
Reproductive Health - Women taking birth control pills (%)
Reproductive Health - Women that have ever used Depo-Provera or injectables (%)
Reproductive Health - Women that have ever used female hormones (%)
Sexual Behavior - People 18+ that ever had sex (vaginal, anal, or oral) (%)
Sexual Behavior - Males 18+ that ever had vaginal sex with a woman (%)
Sexual Behavior - Males 18+ that ever performed oral sex on a woman (%)
Sexual Behavior - Males 18+ that ever had anal sex with a woman (%)
Sexual Behavior - Males 18+ that ever had any sex with a man (%)
Sexual Behavior - Females 18+ that ever had vaginal sex with a man (%)
Sexual Behavior - Females 18+ that ever performed oral sex on a man (%)
Sexual Behavior - Females 18+ that ever had anal sex with a man (%)
Sexual Behavior - Females 18+ that ever had any kind of sex with a woman (%)
Sexual Behavior - Average age people first had sex
Sexual Behavior - Average number of female sex partners in lifetime (males 18+)
Sexual Behavior - Average number of female vaginal sex partners in lifetime (males 18+)
Sexual Behavior - Average age people first performed oral sex on a woman (18+)
Sexual Behavior - Average number of woman performed oral sex on in lifetime (18+)
Sexual Behavior - Average number of male sex partners in lifetime (males 18+)
Sexual Behavior - Average number of male anal sex partners in lifetime (males 18+)
Sexual Behavior - Average age people first performed oral sex on a man (18+)
Sexual Behavior - Average number of male oral sex partners in lifetime (18+)
Sexual Behavior - People using protection when performing oral sex (%)
Sexual Behavior - Average number of times people have vaginal or anal sex a year
Sexual Behavior - People having sex without condom (%)
Sexual Behavior - Average number of male sex partners in lifetime (females 18+)
Sexual Behavior - Average number of male vaginal sex partners in lifetime (females 18+)
Sexual Behavior - Average number of female sex partners in lifetime (females 18+)
Sexual Behavior - Circumcised males 18+ (%)
Sleep Disorders - Average hours sleeping at night
Sleep Disorders - People that has trouble sleeping (%)
Smoking-Cigarette Use - People smoking cigarettes (%)
Taste & Smell - People 40+ having problems with smell (%)
Taste & Smell - People 40+ having problems with taste (%)
Taste & Smell - People 40+ that ever had wisdom teeth removed (%)
Taste & Smell - People 40+ that ever had tonsils teeth removed (%)
Taste & Smell - People 40+ that ever had a loss of consciousness because of a head injury (%)
Taste & Smell - People 40+ that ever had a broken nose or other serious injury to face or skull (%)
Taste & Smell - People 40+ that ever had two or more sinus infections (%)
Weight - Average height (inches)
Weight - Average weight (pounds)
Weight - Average BMI
Weight - People that are obese (%)
Weight - People that ever were obese (%)
Weight - People trying to lose weight (%)
Urban population: 6,424
Rural population: 31
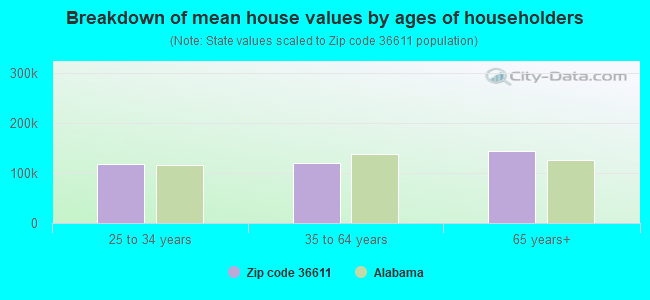
Estimated median house/condo value in 2022: $100,002
36611:
$100,002Alabama:
$200,900
Median resident age: This zip code:
33.6 yearsAlabama median age:
39.6 years
Average household size: This zip code:
2.6 peopleAlabama:
2.5 people
Averages for the 2020 tax year for zip code 36611, filed in 2021:
Average Adjusted Gross Income (AGI) in 2020: $33,286 (Individual Income Tax Returns) Here:
$33,286State:
$63,984
Salary/wage: $29,824 (reported on 85.5% of returns )Here:
$29,824State:
$52,834
(% of AGI for various income ranges: 1182.6% for AGIs below $25k , 3627.5% for AGIs $25k-50k , 7288.5% for AGIs $50k-75k , 10005.6% for AGIs $75k-100k , 14234.0% for AGIs $100k-200k ) Taxable interest for individuals: $836 (reported on 10.7% of returns )This zip code:
$836Alabama:
$1,615
(% of AGI for various income ranges: 1.9% for AGIs below $25k , 10.0% for AGIs $25k-50k , 44.5% for AGIs $50k-75k , 41.1% for AGIs $75k-100k , 46.0% for AGIs $100k-200k ) Ordinary dividends: $2,480 (reported on 3.8% of returns )(% of AGI for various income ranges: 3.4% for AGIs below $25k , 10.9% for AGIs $25k-50k , 156.7% for AGIs $75k-100k ) Net capital gain/loss in AGI: +$1,133 (reported on 3.4% of returns )Here:
+$1,133State:
+$23,528
(% of AGI for various income ranges: 5.2% for AGIs $25k-50k , 77.8% for AGIs $75k-100k ) Profit/loss from business: +$4,875 (reported on 18.3% of returns )Here:
+$4,875State:
+$9,534
(% of AGI for various income ranges: 143.3% for AGIs below $25k , 26.2% for AGIs $25k-50k , 117.5% for AGIs $50k-75k , 416.7% for AGIs $75k-100k ) Taxable individual retirement arrangement distribution: $12,990 (reported on 3.8% of returns )36611:
$12,990Alabama:
$19,004
(% of AGI for various income ranges: 15.5% for AGIs below $25k , 47.2% for AGIs $25k-50k , 414.0% for AGIs $50k-75k ) Total itemized deductions: $24,360 (reported on 3.8% of returns )Here:
$24,360State:
$37,338
(% of AGI for various income ranges: 168.8% for AGIs $25k-50k , 678.0% for AGIs $50k-75k ) Charity contributions: $10,483 (reported on 2.3% of returns )Here:
$10,483State:
$18,005
(% of AGI for various income ranges: 314.5% for AGIs $50k-75k ) Taxes paid: $3,183 (reported on 2.3% of returns )(% of AGI for various income ranges: 2.8% for AGIs below $25k , 80.0% for AGIs $50k-75k ) Earned income credit: $2,979 (reported on 38.5% of returns )(% of AGI for various income ranges: 203.0% for AGIs below $25k , 124.4% for AGIs $25k-50k ) Percentage of individuals using paid preparers for their 2020 taxes: 92.4%(% for various income ranges: 92.4% for AGIs below $25k , 93.7% for AGIs $25k-50k , 86.7% for AGIs $50k-75k , 92.3% for AGIs $75k-100k , 100.0% for AGIs $100k-200k )
Averages for the 2012 tax year for zip code 36611, filed in 2013:
Average Adjusted Gross Income (AGI) in 2012: $30,934 (Individual Income Tax Returns) Here:
$30,934State:
$52,001
Salary/wage: $29,265 (reported on 84.6% of returns )Here:
$29,265State:
$43,822
(% of AGI for various income ranges: 77.2% for AGIs below $25k , 87.2% for AGIs $25k-50k , 81.4% for AGIs $50k-75k , 78.5% for AGIs $75k-100k , 65.9% for AGIs $100k-200k ) Taxable interest for individuals: $1,090 (reported on 15.8% of returns )This zip code:
$1,090Alabama:
$1,592
(% of AGI for various income ranges: 0.9% for AGIs below $25k , 0.5% for AGIs $25k-50k , 0.7% for AGIs $50k-75k , 0.2% for AGIs $75k-100k , 0.3% for AGIs $100k-200k ) Ordinary dividends: $2,553 (reported on 6.1% of returns )(% of AGI for various income ranges: 0.6% for AGIs below $25k , 0.4% for AGIs $25k-50k , 0.6% for AGIs $50k-75k , 0.9% for AGIs $75k-100k ) Profit/loss from business: +$4,293 (reported on 17.0% of returns )Here:
+$4,293State:
+$9,151
(% of AGI for various income ranges: 8.9% for AGIs below $25k , 2.5% for AGIs $75k-100k ) Taxable individual retirement arrangement distribution: $9,827 (reported on 6.1% of returns )36611:
$9,827Alabama:
$14,992
(% of AGI for various income ranges: 1.5% for AGIs below $25k , 1.0% for AGIs $25k-50k , 1.7% for AGIs $50k-75k , 6.9% for AGIs $75k-100k ) Total itemized deductions: $14,948 (28% of AGI, reported on 18.6% of returns )Here:
$14,948State:
$21,388
Here:
28.2% of AGIState:
20.1% of AGI
(% of AGI for various income ranges: 5.3% for AGIs below $25k , 10.1% for AGIs $25k-50k , 9.8% for AGIs $50k-75k , 10.4% for AGIs $75k-100k , 11.0% for AGIs $100k-200k ) Charity contributions: $4,072 (reported on 14.6% of returns )(% of AGI for various income ranges: 0.9% for AGIs below $25k , 1.9% for AGIs $25k-50k , 2.4% for AGIs $50k-75k , 2.6% for AGIs $75k-100k , 2.5% for AGIs $100k-200k ) Taxes paid: $2,744 (reported on 18.2% of returns )(% of AGI for various income ranges: 0.7% for AGIs below $25k , 1.5% for AGIs $25k-50k , 1.9% for AGIs $50k-75k , 2.1% for AGIs $75k-100k , 3.0% for AGIs $100k-200k ) Earned income credit: $2,956 (reported on 42.1% of returns )(% of AGI for various income ranges: 14.3% for AGIs below $25k , 1.8% for AGIs $25k-50k ) Percentage of individuals using paid preparers for their 2012 taxes: 58.3%(% for various income ranges: 60.0% for AGIs below $25k , 56.5% for AGIs $25k-50k , 52.0% for AGIs $50k-75k , 58.3% for AGIs $75k-100k , 66.7% for AGIs $100k-200k )
Averages for the 2004 tax year for zip code 36611, filed in 2005:
Average Adjusted Gross Income (AGI) in 2004: $26,311 (Individual Income Tax Returns) Here:
$26,311State:
$42,302
Salary/wage: $23,935 (reported on 83.5% of returns )Here:
$23,935State:
$36,626
(% of AGI for various income ranges: 89.3% for AGIs below $10k , 78.8% for AGIs $10k-25k , 82.6% for AGIs $25k-50k , 74.1% for AGIs $50k-75k , 77.5% for AGIs $75k-100k , 41.7% for AGIs over 100k ) Taxable interest for individuals: $1,618 (reported on 26.0% of returns )This zip code:
$1,618Alabama:
$1,827
(% of AGI for various income ranges: 3.9% for AGIs below $10k , 1.6% for AGIs $10k-25k , 1.1% for AGIs $25k-50k , 1.5% for AGIs $50k-75k , 0.8% for AGIs $75k-100k , 3.3% for AGIs over 100k ) Taxable dividends: $1,984 (reported on 10.9% of returns )(% of AGI for various income ranges: 1.6% for AGIs below $10k , 0.5% for AGIs $10k-25k , 0.5% for AGIs $25k-50k , 1.4% for AGIs $50k-75k , 1.3% for AGIs $75k-100k , 0.6% for AGIs over 100k ) Net capital gain/loss: +$2,788 (reported on 7.4% of returns )Here:
+$2,788State:
+$13,031
(% of AGI for various income ranges: -0.8% for AGIs below $10k , 0.0% for AGIs $10k-25k , 0.1% for AGIs $25k-50k , 0.5% for AGIs $50k-75k , 7.0% for AGIs over 100k ) Profit/loss from business: +$4,855 (reported on 11.1% of returns )Here:
+$4,855State:
+$8,302
(% of AGI for various income ranges: 14.5% for AGIs below $10k , 3.2% for AGIs $10k-25k , 1.6% for AGIs $25k-50k , -0.5% for AGIs $50k-75k , 2.4% for AGIs $75k-100k ) IRA payment deduction: $2,174 (reported on 1.0% of returns )36611:
$2,174Alabama:
$3,006
Total itemized deductions: $14,298 (30% of AGI, reported on 20.0% of returns )Here:
$14,298State:
$17,623
Here:
30.0% of AGIState:
20.8% of AGI
(% of AGI for various income ranges: 8.5% for AGIs below $10k , 7.6% for AGIs $10k-25k , 10.7% for AGIs $25k-50k , 12.4% for AGIs $50k-75k , 12.4% for AGIs $75k-100k , 16.5% for AGIs over 100k ) Charity contributions deductions: $2,865 (6% of AGI, reported on 17.7% of returns )Here:
5.9% of AGIState:
5.4% of AGI
(% of AGI for various income ranges: 0.8% for AGIs below $10k , 1.4% for AGIs $10k-25k , 1.6% for AGIs $25k-50k , 2.8% for AGIs $50k-75k , 2.6% for AGIs $75k-100k , 2.3% for AGIs over 100k ) Total tax: $3,077 (reported on 60.0% of returns )(% of AGI for various income ranges: 2.7% for AGIs below $10k , 2.9% for AGIs $10k-25k , 5.9% for AGIs $25k-50k , 8.9% for AGIs $50k-75k , 10.5% for AGIs $75k-100k , 16.6% for AGIs over 100k ) Earned income credit: $2,140 (reported on 35.5% of returns )Percentage of individuals using paid preparers for their 2004 taxes: 64.9%(% for various income ranges: 67.7% for AGIs below $10k , 68.1% for AGIs $10k-25k , 58.4% for AGIs $25k-50k , 63.1% for AGIs $50k-75k , 65.4% for AGIs $75k-100k , 62.5% for AGIs over 100k )
Estimated median household income in 2022: This zip code:
$39,028Alabama:
$59,674
Nearest zip codes: 36610 ,
36612 ,
36616 ,
36617 ,
36607 ,
36602 .
Saraland Zip Code Map
Percentage of family households: This zip code:
43.5%Alabama:
45.6%
Percentage of households with unmarried partners: This zip code:
6.2%Alabama:
46.7%
Likely homosexual households (counted as self-reported same-sex unmarried-partner households)
Lesbian couples: 0.7% of all households Gay men: 0.0% of all households
Household received Food Stamps/SNAP in the past 12 months: 695Household did not receive Food Stamps/SNAP in the past 12 months: 1,807
Women who had a birth in the past 12 months: 75 (38 now married , 32 unmarried) Women who did not have a birth in the past 12 months: 1,639 (574 now married , 1,065 unmarried)
Housing units in zip code 36611 with a mortgage: 671 (53
second mortgage , 43
both second mortgage and home equity loan )
Houses without a mortgage: 5
Median monthly owner costs for units with a mortgage: $1,046
Median monthly owner costs for units without a mortgage: $419
Residents with income below the poverty level in 2022:
This zip code:
32.7%Whole state:
16.2%
Residents with income below 50% of the poverty level in 2022:
This zip code:
15.2%Whole state:
8.6%
Median number of rooms in houses and condos: Median number of rooms in apartments: Notable locations in this zip code not listed on our city pages
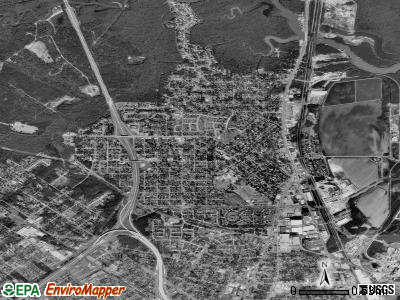
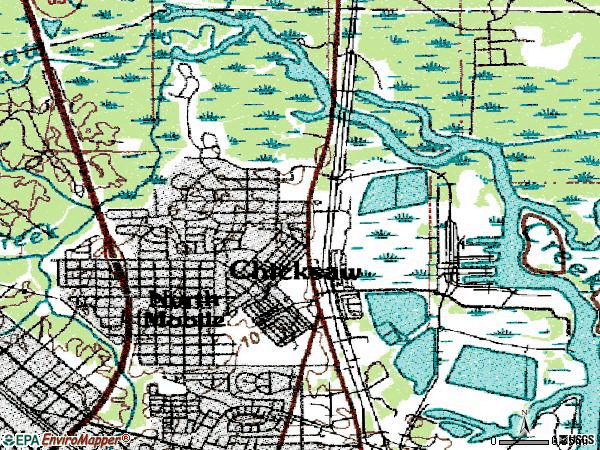
Click to draw/clear zip code borders Notable locations in zip code 36611: (A) , Prichard Water Treatment Plant (B) , Chickasaw Steam Plant (C) , Chickasaw Fire Prevention Bureau (D) , Chickasaw Fire Department (E) , Ina Pullen Smallwood Memorial Library (F) . Display/hide their locations on the map
Shopping Centers: (1) , Chickasaw Shopping Center (2) , Northgate Shopping Center (3) , Village Square Shopping Center (4) . Display/hide their locations on the map
Churches in zip code 36611 include: (A) , Trinity Faith Bible Church (B) , Saint Thomas Church (C) , Saint Michaels Episcopal Church (D) , North Mobile Free Holiness Church (E) , Mount Calvary Baptist Church (F) , First Baptist Church (G) , Consolation Primitive Baptist Church (H) , Church of God of Prophecy (I) . Display/hide their locations on the map
Creek: (A) . Display/hide its location on the map
Park in zip code 36611: (1) . Display/hide its location on the map
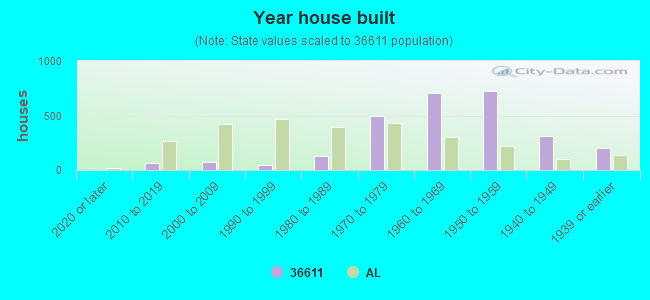
Year house built (houses)
0 2020 or later67 2010 to 201976 2000 to 200947 1990 to 1999126 1980 to 1989500 1970 to 1979702 1960 to 1969728 1950 to 1959308 1940 to 1949203 1939 or earlier
Zip code 36611 household income distribution in 2022 312 Less than $10,000270 $10,000 to $14,999139 $15,000 to $19,999194 $20,000 to $24,999101 $25,000 to $29,999139 $30,000 to $34,999123 $35,000 to $39,999156 $40,000 to $44,999133 $45,000 to $49,99995 $50,000 to $59,999232 $60,000 to $74,999244 $75,000 to $99,999237 $100,000 to $124,99931 $125,000 to $149,99938 $150,000 to $199,99943 $200,000 or moreEstimate of home value of owner-occupied houses/condos in 2022 in zip code 36611 26 Less than $10,0009 $10,000 to $14,99921 $15,000 to $19,99910 $20,000 to $24,9999 $25,000 to $29,99913 $30,000 to $34,99919 $35,000 to $39,99999 $40,000 to $49,99970 $50,000 to $59,99977 $60,000 to $69,99993 $70,000 to $79,999119 $80,000 to $89,99957 $90,000 to $99,99950 $100,000 to $124,999116 $125,000 to $149,99980 $150,000 to $174,99994 $175,000 to $199,99976 $200,000 to $249,9991 $250,000 to $299,9993 $400,000 to $499,9995 $500,000 to $749,999Rent paid by renters in 2022 in zip code 36611 19 Less than $10058 $100 to $14965 $150 to $199113 $200 to $24955 $250 to $29969 $300 to $34911 $350 to $3998 $400 to $44935 $450 to $49964 $500 to $54955 $550 to $59992 $600 to $64958 $650 to $699151 $700 to $749128 $750 to $79983 $800 to $89947 $900 to $99951 $1,000 to $1,24912 $1,250 to $1,49960 No cash rent
Median gross rent in 2022: $860.
Estimated median house (or condo) value in 2022 for: White Non-Hispanic householders: $99,286Black or African American householders: $115,029American Indian or Alaska Native householders: $100,717Asian householders: $201,256Some other race householders: $152,060Two or more races householders: $67,085Hispanic or Latino householders: $147,051Estimated median house or condo value in 2022: $100,002
36611:
$100,002Alabama:
$200,900
Lower value quartile - upper value quartile: $62,253 - $169,300
Mean price in 2022: Detached houses: $232,447Here:
$232,447State:
$273,076
Townhouses or other attached units: $264,555Here:
$264,555State:
$222,857
In 2-unit structures: $77,535Here:
$77,535State:
$191,282
In 3-to-4-unit structures: $236,180Here:
$236,180State:
$194,388
In 5-or-more-unit structures: $116,843Here:
$116,843State:
$307,073
Mobile homes: $58,185Here:
$58,185State:
$77,780
Occupied boats, RVs, vans, etc.: $55,054Here:
$55,054State:
$95,848
Housing units in structures:
One, detached: 2,140One, attached: 108Two: 3263 or 4: 15510 to 19: 2120 to 49: 92Mobile homes: 3Unemployment : 4.2%
Means of transportation to work in zip code 36611 85.2% 2,378 Drove a car alone5.4% 152 Carpooled0.1% 4 Bus or trolley bus2.3% 63 Walked0.6% 18 Other means5.2% 146 Worked at homeTravel time to work (commute) in zip code 36611 27 Less than 5 minutes221 5 to 9 minutes357 10 to 14 minutes686 15 to 19 minutes519 20 to 24 minutes178 25 to 29 minutes379 30 to 34 minutes17 35 to 39 minutes43 40 to 44 minutes134 45 to 59 minutes29 60 to 89 minutes24 90 or more minutes
Percentage of zip code residents living and working in this county: 87.1%
Household type by relationship:
Households: 6,456
Male householders: 907 (368 living alone ), Female householders: 1,583 (464 living alone )785 spouses (785 opposite-sex spouses ), 220 unmarried partners , (214 opposite-sex unmarried partners ), 2,317 children (2,221 natural , 56 adopted , 43 stepchildren ), 125 grandchildren , 99 brothers or sisters , 47 parents , 0 foster children , 92 other relatives , 215 non-relatives In group quarters: 34 (-1 institutionalized population )
Size of family households: 488 2-persons , 400 3-persons , 351 4-persons , 143 5-persons , 41 6-persons , 26 7-or-more-persons
Size of nonfamily households: 831 1-person , 178 2-persons , 3 3-persons , 19 4-persons
798 married couples with children. single-parent households (63 men , 791 women ).
97.3% of residents of 36611 zip code speak English at home. of residents speak Spanish at home (30% very well, 9% well, 50% not well, 11% not at all ).of residents speak other Indo-European language at home (100% very well ).of residents speak other language at home (100% very well ).
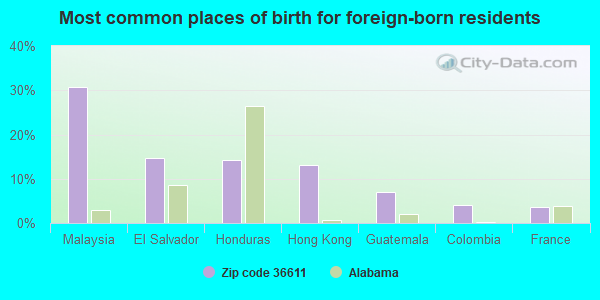
Foreign born population: 178 (2.8%)
(55.1%
of them are naturalized citizens )
This zip code:
2.8%Whole state:
3.8%
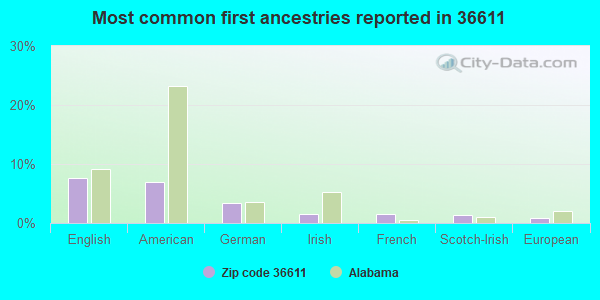
31% Malaysia 15% El Salvador 14% Honduras 13% Hong Kong 7% Guatemala 4% Colombia 4% France 8% English 7% American 3% German 2% Irish 1% French 1% Scotch-Irish 1% European
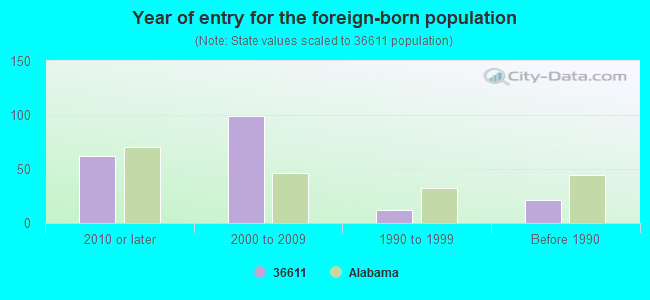
Year of entry for the foreign-born population
62 2010 or later 99 2000 to 2009 12 1990 to 1999 21 Before 1990
There are
7 Medical Specialists in Zip Code 36611 .
Major facilities with environmental interests located in this zip code:
CHICKASAW ELEMENTARY SCHOOL (201 N CRAFT HWY in CHICKASAW, AL)
(Geographic Names Information System) (National Center for Education Statistics) - STATE ID-0180 Organizations: MOBILE COUNTY (SCHOOL DISTRICT)
CHICKASAW LAGOON (CHICKASAW CITY OF UTILITIES BD in CHICKASAW, AL)
National Pollutant Discharge Elimination System MAJOR (Tracking pollutant discharge elimination systems) - permit - ICIS-, ENFORCEMENT/COMPLIANCE ACTIVITY Business SIC classification: SEWERAGE SYSTEMSAlternative names: CHICKASAW CITY OF LAGOON, CHICKASAW UTILITIES BOARD, UTILITIES BOARD OF CHICKASAW INCORPORATED
PETER JOE HAMILTON ELEMENTARY SCHOOL (80 GRANT ST in CHICKASAW, AL)
(Geographic Names Information System) (National Center for Education Statistics) - STATE ID-0360 Organizations: MOBILE COUNTY (SCHOOL DISTRICT)
K J CLARK MIDDLE SCHOOL (50 12TH AVE in CHICKASAW, AL)
(Geographic Names Information System) (National Center for Education Statistics) - STATE ID-0410 Organizations: MOBILE COUNTY (SCHOOL DISTRICT)
CHARLES SMALL ENGINE REPAIR (523 HWY 43 in CHICKASAW, AL)
(Resource Conservation and Recovery Act (tracking hazardous waste)) Alternative names: GUYS SMALL ENGINE
ALABAMA POWER COMPANY (400 SHIPYARD STREET in CHICKASAW, AL)
AIR MAJOR (AIRS/AFS) AIR PROGRAM (Clean Air Markets Division Business System) Conditionally Exempt Small Quantity Generators, less than 100 kg/month of hazardous waste (Resource Conservation and Recovery Act (tracking hazardous waste)) - notification Business SIC classification: ELECTRIC SERVICESAlternative names: ALABAMA POWER-CHICKASAW STEAM PLANT, CHICKASAW
AUTOZONE #238 (295 S CRAFT HIGHWAY in CHICKASAW, AL)
(Resource Conservation and Recovery Act (tracking hazardous waste)) Organizations: OPER NAME (CONTACT/OPERATOR)
, AUTOZONE INC (CONTACT/OWNER)
O NEAL STEEL INC (HIGHWAY 43 CRAFT HIGHWAY in MOBILE, AL)
National Pollutant Discharge Elimination System NON-MAJOR (Tracking pollutant discharge elimination systems) - permit Business SIC classification: METALS SERVICE CENTERS AND OFFICESOrganizations: ONEAL STEEL INC (CONTACT/OWNER)
Alternative names: ONEAL STEEL MOBILE
A.C. KYSER AUTO REPAIR (322 HWY 43 in CHICKASAW, AL)
(Resource Conservation and Recovery Act (tracking hazardous waste)) Organizations: LARRY KYSER (CONTACT/OWNER)
ALTER SCRAP MOBILE YARD (ALTER SCRAP PROCESSING in MOBILE, AL)
National Pollutant Discharge Elimination System NON-MAJOR (Tracking pollutant discharge elimination systems) - permit Business SIC classification: SCRAP AND WASTE MATERIALSOrganizations: ALTER SCRAP PROCESSING (CONTACT/OWNER)
Alternative names: ALTER SCRAP PROCESSING
ALTER SCRAP PROCESSING (1 HARDWOOD LANE in MOBILE, AL)
STATE MASTER (PERMIT TRACKING) Conditionally Exempt Small Quantity Generators, less than 100 kg/month of hazardous waste (Resource Conservation and Recovery Act (tracking hazardous waste)) Organizations: ALTER SCRAP PROCESSING MOBILE (CONTACT/OPERATOR)
, ALTER TRADING CORP (CONTACT/OWNER)
Alternative names: ALTER SCRAP PROCESSING-MOBILE
C & G TANK LINES INC (530 W VALLEY RD in CHICKASAW, AL)
(Resource Conservation and Recovery Act (tracking hazardous waste)) Organizations: ANDREW CHISHOLM SR (CONTACT/OWNER)
RECTEC LLC (101 HARDWOOD LANE in CHICKASAW, AL)
National Pollutant Discharge Elimination System NON-MAJOR (Tracking pollutant discharge elimination systems) - permit Business SIC classification: SCRAP AND WASTE MATERIALSAlternative names: SCAT RECYCLING LLC
Housing units lacking complete plumbing facilities: 3.2%
Housing units lacking complete kitchen facilities: 3.8%
56.4% Electricity 40.7% Utility gas 1.5% Bottled, tank, or LP gas 1.4% No fuel used
Population in 1990: 6,660.
Place of birth for U.S.-born residents:
This state: 5,138Northeast: 61Midwest: 187South: 732West: 108
60% of the 36611 zip code residents lived in the same house 5 years ago.
Out of people who lived in different houses, 75% lived in this county.
Out of people who lived in different counties, 50% lived in Alabama.
86% of the 36611 zip code residents lived in the same house 1 year ago.
Out of people who lived in different houses, 68% moved from this county.
Out of people who lived in different houses, 8% moved from different county within same state.
Out of people who lived in different houses, 19% moved from different state.
Private vs. public school enrollment:
Students in private schools in grades 1 to 8 (elementary and middle school): 110
Students in private schools in grades 9 to 12 (high school): 11
Students in private undergraduate colleges: 24
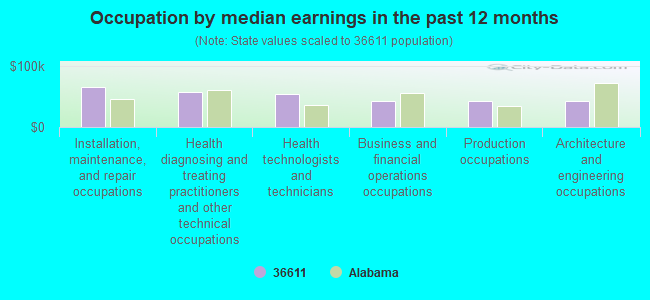
Occupation by median earnings in the past 12 months ($)
64,660 Installation, maintenance, and repair occupations 57,385 Health diagnosing and treating practitioners and other technical occupations 54,562 Health technologists and technicians 42,911 Business and financial operations occupations 42,524 Production occupations 42,304 Architecture and engineering occupations
Companies with federal contracts located in this zip code:
MARGARET J MOORE (320 VALLEY RD in CHICKASAW, AL; small business) in 14 contracts from 2000 to 2006
Contracts for Nursing Services by Army, U.S. Army Corps of Engineers - civil program financing onlySigned by year: 2000: $19,760; 2001: $62,608; 2002: $36,608; 2003: $13,200; 2004: $90,000; 2005: $92,695; 2006: $62,486.
Biggest contracts: with Army for Nursing Services. Signed on 2006-03-03. Completion date: 2004-02-13.
with U.S. Army Corps of Engineers - civil program financing only for Nursing Services. Signed on 2005-03-21. Completion date: 2004-02-13.
with Army for Nursing Services. Signed on 2005-03-21. Completion date: 2004-02-13.
, same as above. Signed on 2004-02-27. Completion date: 2004-02-13.
FILTERS FOR INDUSTRY INC (1509 TELEGRAPH RD in MOBILE, AL)
$8,475 with Army for Filters and Networks. Signed on 2005-10-11. Completion date: 2005-11-03.
Top industries in this zip code by the number of employees in 2005:
Construction: Electrical Contractors (50-99 employees: 1 establishment, 10-19 employees: 1 establishment)Wholesale Trade: Metal Service Centers and Other Metal Merchant Wholesalers (50-99: 1)Other Services (except Public Administration): Religious Organizations (10-19: 2, 5-9: 2, 1-4: 2)Construction: Highway, Street, and Bridge Construction (20-49: 1)Other Services (except Public Administration): Diet and Weight Reducing Centers (20-49: 1)
People in group quarters in 2010:
5 people in local jails and other municipal confinement facilities
People in group quarters in 2000:
5 people in local jails and other confinement facilities (including police lockups)
2 people in religious group quarters
Fatal accident statistics in 2010:
Fatal accident count: 1Vehicles involved in fatal accidents: 1Fatal accidents caused by drunken drivers: 0Fatalities: 1Persons involved in fatal accidents: 1Pedestrians involved in fatal accidents: 1
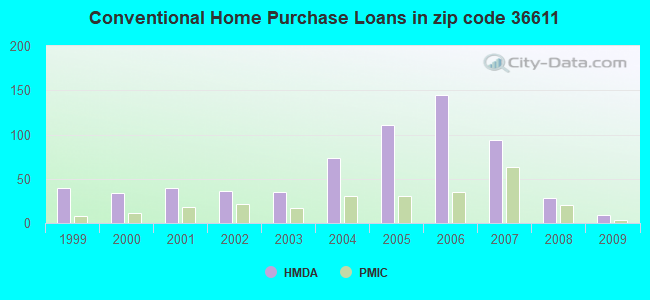
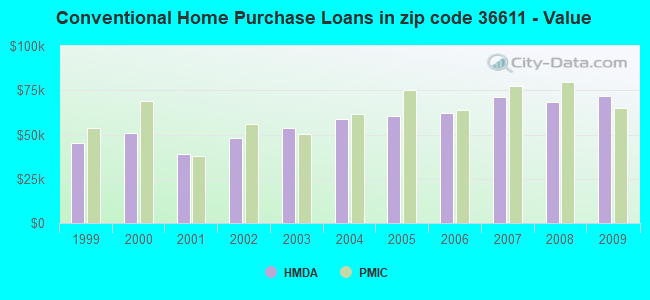
Home Mortgage Disclosure Act Aggregated Statistics For Year 2009(Based on 3 full and 2 partial tracts) A) FHA, FSA/RHS & VA B) Conventional C) Refinancings D) Home Improvement Loans F) Non-occupant Loans on G) Loans On Manufactured Number Average Value Number Average Value Number Average Value Number Average Value Number Average Value Number Average Value
LOANS ORIGINATED 32 $80,770 9 $71,571 52 $75,067 1 $6,680 9 $59,042 0 $0 APPLICATIONS APPROVED, NOT ACCEPTED 1 $86,760 1 $26,000 6 $70,217 0 $0 1 $48,540 1 $26,000 APPLICATIONS DENIED 3 $119,817 6 $60,917 29 $80,930 3 $40,820 2 $57,370 0 $0 APPLICATIONS WITHDRAWN 4 $69,522 4 $49,902 22 $79,414 2 $10,755 3 $38,490 0 $0 FILES CLOSED FOR INCOMPLETENESS 2 $135,115 0 $0 6 $115,638 0 $0 0 $0 0 $0
Aggregated Statistics For Year 2008(Based on 3 full and 2 partial tracts) A) FHA, FSA/RHS & VA B) Conventional C) Refinancings D) Home Improvement Loans F) Non-occupant Loans on G) Loans On Manufactured Number Average Value Number Average Value Number Average Value Number Average Value Number Average Value Number Average Value
LOANS ORIGINATED 32 $94,239 28 $68,613 50 $80,018 16 $29,134 21 $61,371 2 $43,870 APPLICATIONS APPROVED, NOT ACCEPTED 2 $38,990 2 $79,355 6 $84,065 2 $16,085 1 $46,010 2 $38,990 APPLICATIONS DENIED 7 $96,914 12 $74,131 84 $93,288 28 $47,291 6 $39,873 1 $49,900 APPLICATIONS WITHDRAWN 7 $108,299 6 $97,920 19 $100,579 4 $64,645 2 $50,000 0 $0 FILES CLOSED FOR INCOMPLETENESS 1 $203,770 1 $126,740 19 $107,505 1 $9,750 2 $67,985 0 $0
Aggregated Statistics For Year 2007(Based on 3 full and 2 partial tracts) A) FHA, FSA/RHS & VA B) Conventional C) Refinancings D) Home Improvement Loans F) Non-occupant Loans on G) Loans On Manufactured Number Average Value Number Average Value Number Average Value Number Average Value Number Average Value Number Average Value
LOANS ORIGINATED 33 $78,528 94 $71,327 78 $75,253 19 $42,142 32 $57,649 0 $0 APPLICATIONS APPROVED, NOT ACCEPTED 1 $116,280 18 $75,357 14 $93,044 2 $53,025 4 $67,125 1 $68,240 APPLICATIONS DENIED 5 $65,098 28 $73,073 88 $81,586 28 $36,051 19 $57,870 1 $51,990 APPLICATIONS WITHDRAWN 4 $84,408 13 $76,232 26 $84,028 6 $62,722 6 $53,362 0 $0 FILES CLOSED FOR INCOMPLETENESS 0 $0 8 $84,918 12 $110,691 1 $66,800 1 $109,190 0 $0
Aggregated Statistics For Year 2006(Based on 3 full and 2 partial tracts) A) FHA, FSA/RHS & VA B) Conventional C) Refinancings D) Home Improvement Loans F) Non-occupant Loans on G) Loans On Manufactured Number Average Value Number Average Value Number Average Value Number Average Value Number Average Value Number Average Value
LOANS ORIGINATED 21 $80,014 145 $62,224 54 $71,036 16 $43,882 54 $52,818 1 $57,990 APPLICATIONS APPROVED, NOT ACCEPTED 3 $81,960 16 $79,109 8 $75,512 2 $27,035 5 $51,864 1 $7,000 APPLICATIONS DENIED 8 $77,252 54 $65,038 70 $81,101 38 $34,110 16 $61,028 1 $47,530 APPLICATIONS WITHDRAWN 5 $98,422 27 $61,521 32 $81,718 4 $29,808 7 $47,710 0 $0 FILES CLOSED FOR INCOMPLETENESS 0 $0 12 $93,882 6 $421,852 1 $19,270 3 $54,027 0 $0
Aggregated Statistics For Year 2005(Based on 3 full and 2 partial tracts) A) FHA, FSA/RHS & VA B) Conventional C) Refinancings D) Home Improvement Loans F) Non-occupant Loans on G) Loans On Manufactured Number Average Value Number Average Value Number Average Value Number Average Value Number Average Value Number Average Value
LOANS ORIGINATED 24 $75,670 111 $60,171 60 $59,503 8 $86,838 55 $56,482 0 $0 APPLICATIONS APPROVED, NOT ACCEPTED 0 $0 19 $58,539 18 $59,131 3 $55,330 4 $42,438 1 $20,990 APPLICATIONS DENIED 4 $73,222 29 $75,419 74 $66,741 16 $34,238 8 $47,269 0 $0 APPLICATIONS WITHDRAWN 2 $61,665 42 $79,394 30 $77,076 4 $63,262 0 $0 0 $0 FILES CLOSED FOR INCOMPLETENESS 0 $0 3 $65,917 10 $56,883 0 $0 1 $34,990 0 $0
Aggregated Statistics For Year 2004(Based on 3 full and 2 partial tracts) A) FHA, FSA/RHS & VA B) Conventional C) Refinancings D) Home Improvement Loans F) Non-occupant Loans on G) Loans On Manufactured Number Average Value Number Average Value Number Average Value Number Average Value Number Average Value Number Average Value
LOANS ORIGINATED 22 $73,618 73 $58,487 74 $53,291 8 $28,516 37 $50,851 0 $0 APPLICATIONS APPROVED, NOT ACCEPTED 0 $0 12 $71,539 37 $62,411 1 $54,200 7 $46,060 1 $10,010 APPLICATIONS DENIED 3 $77,703 17 $53,944 61 $59,306 10 $41,033 8 $50,289 1 $58,110 APPLICATIONS WITHDRAWN 3 $71,457 10 $59,843 40 $65,404 3 $20,657 5 $68,330 0 $0 FILES CLOSED FOR INCOMPLETENESS 0 $0 3 $60,323 8 $88,095 1 $32,000 1 $21,020 0 $0
Aggregated Statistics For Year 2003(Based on 3 full and 2 partial tracts) A) FHA, FSA/RHS & VA B) Conventional C) Refinancings D) Home Improvement Loans F) Non-occupant Loans on Number Average Value Number Average Value Number Average Value Number Average Value Number Average Value
LOANS ORIGINATED 36 $64,266 35 $53,912 130 $60,905 7 $14,054 30 $45,741 APPLICATIONS APPROVED, NOT ACCEPTED 4 $55,740 5 $69,020 33 $57,229 0 $0 4 $61,935 APPLICATIONS DENIED 8 $68,131 8 $79,310 79 $65,094 11 $18,872 7 $43,427 APPLICATIONS WITHDRAWN 2 $51,055 5 $61,148 41 $67,521 1 $105,290 3 $52,680 FILES CLOSED FOR INCOMPLETENESS 0 $0 4 $70,422 23 $58,728 0 $0 1 $30,000
Aggregated Statistics For Year 2002(Based on 3 full and 2 partial tracts) A) FHA, FSA/RHS & VA B) Conventional C) Refinancings D) Home Improvement Loans E) Loans on Dwellings For 5+ Families F) Non-occupant Loans on Number Average Value Number Average Value Number Average Value Number Average Value Number Average Value Number Average Value
LOANS ORIGINATED 46 $63,568 36 $48,198 91 $54,571 3 $24,583 1 $7,919,210 34 $42,602 APPLICATIONS APPROVED, NOT ACCEPTED 1 $38,020 7 $43,507 20 $62,834 1 $20,420 0 $0 4 $29,490 APPLICATIONS DENIED 7 $60,469 7 $49,691 52 $58,316 17 $13,398 0 $0 8 $22,229 APPLICATIONS WITHDRAWN 1 $64,990 7 $56,446 30 $52,558 2 $54,470 0 $0 3 $41,657 FILES CLOSED FOR INCOMPLETENESS 0 $0 3 $78,270 24 $63,091 1 $32,170 0 $0 0 $0
Aggregated Statistics For Year 2001(Based on 3 full and 2 partial tracts) A) FHA, FSA/RHS & VA B) Conventional C) Refinancings D) Home Improvement Loans F) Non-occupant Loans on Number Average Value Number Average Value Number Average Value Number Average Value Number Average Value
LOANS ORIGINATED 46 $57,249 40 $38,997 82 $54,440 8 $9,050 28 $35,428 APPLICATIONS APPROVED, NOT ACCEPTED 0 $0 6 $45,572 10 $66,588 1 $4,870 0 $0 APPLICATIONS DENIED 4 $63,560 19 $47,886 49 $52,515 7 $13,119 3 $29,267 APPLICATIONS WITHDRAWN 2 $63,090 2 $51,995 23 $49,372 2 $19,500 2 $36,990 FILES CLOSED FOR INCOMPLETENESS 0 $0 2 $42,765 11 $57,322 1 $35,000 0 $0
Aggregated Statistics For Year 2000(Based on 3 full and 2 partial tracts) A) FHA, FSA/RHS & VA B) Conventional C) Refinancings D) Home Improvement Loans F) Non-occupant Loans on Number Average Value Number Average Value Number Average Value Number Average Value Number Average Value
LOANS ORIGINATED 43 $57,520 34 $50,694 42 $47,853 8 $5,569 7 $37,457 APPLICATIONS APPROVED, NOT ACCEPTED 4 $47,560 9 $32,246 8 $48,540 1 $10,290 1 $12,260 APPLICATIONS DENIED 10 $46,080 38 $44,565 34 $44,602 9 $9,272 0 $0 APPLICATIONS WITHDRAWN 3 $55,127 7 $45,741 15 $38,131 1 $16,250 0 $0 FILES CLOSED FOR INCOMPLETENESS 0 $0 0 $0 9 $49,633 0 $0 1 $27,300
Aggregated Statistics For Year 1999(Based on 3 full and 1 partial tracts) A) FHA, FSA/RHS & VA B) Conventional C) Refinancings D) Home Improvement Loans E) Loans on Dwellings For 5+ Families F) Non-occupant Loans on Number Average Value Number Average Value Number Average Value Number Average Value Number Average Value Number Average Value
LOANS ORIGINATED 48 $53,162 40 $45,080 58 $44,491 8 $21,994 1 $130,570 12 $36,478 APPLICATIONS APPROVED, NOT ACCEPTED 0 $0 10 $38,280 7 $48,037 5 $16,000 0 $0 1 $68,670 APPLICATIONS DENIED 10 $53,757 53 $49,085 40 $48,416 11 $17,132 0 $0 3 $19,987 APPLICATIONS WITHDRAWN 5 $56,904 13 $64,715 14 $50,764 0 $0 0 $0 1 $82,210 FILES CLOSED FOR INCOMPLETENESS 0 $0 1 $72,540 9 $48,123 0 $0 0 $0 0 $0
Private Mortgage Insurance Companies Aggregated Statistics For Year 2009(Based on 2 full tracts) A) Conventional B) Refinancings Number Average Value Number Average Value
LOANS ORIGINATED 3 $64,693 2 $124,010 APPLICATIONS APPROVED, NOT ACCEPTED 2 $53,995 0 $0 APPLICATIONS DENIED 0 $0 0 $0 APPLICATIONS WITHDRAWN 2 $159,920 0 $0 FILES CLOSED FOR INCOMPLETENESS 0 $0 0 $0
Aggregated Statistics For Year 2008(Based on 3 full and 1 partial tracts) A) Conventional B) Refinancings C) Non-occupant Loans on Number Average Value Number Average Value Number Average Value
LOANS ORIGINATED 20 $79,705 5 $101,704 4 $88,860 APPLICATIONS APPROVED, NOT ACCEPTED 17 $80,459 2 $116,990 4 $69,242 APPLICATIONS DENIED 2 $41,995 0 $0 2 $41,995 APPLICATIONS WITHDRAWN 0 $0 0 $0 0 $0 FILES CLOSED FOR INCOMPLETENESS 2 $67,980 1 $122,840 1 $60,990
Aggregated Statistics For Year 2007(Based on 3 full and 2 partial tracts) A) Conventional B) Refinancings C) Non-occupant Loans on Number Average Value Number Average Value Number Average Value
LOANS ORIGINATED 63 $77,592 16 $81,478 17 $57,858 APPLICATIONS APPROVED, NOT ACCEPTED 6 $79,865 2 $76,990 1 $57,990 APPLICATIONS DENIED 2 $45,980 0 $0 1 $49,980 APPLICATIONS WITHDRAWN 2 $82,325 1 $96,990 0 $0 FILES CLOSED FOR INCOMPLETENESS 0 $0 0 $0 0 $0
Aggregated Statistics For Year 2006(Based on 3 full and 2 partial tracts) A) Conventional B) Refinancings C) Non-occupant Loans on Number Average Value Number Average Value Number Average Value
LOANS ORIGINATED 35 $63,844 4 $60,475 12 $56,042 APPLICATIONS APPROVED, NOT ACCEPTED 3 $95,153 2 $78,925 1 $35,990 APPLICATIONS DENIED 0 $0 0 $0 0 $0 APPLICATIONS WITHDRAWN 1 $100,990 0 $0 1 $100,990 FILES CLOSED FOR INCOMPLETENESS 0 $0 0 $0 0 $0
Aggregated Statistics For Year 2005(Based on 3 full and 2 partial tracts) A) Conventional B) Refinancings C) Non-occupant Loans on Number Average Value Number Average Value Number Average Value
LOANS ORIGINATED 31 $75,236 10 $67,504 16 $53,357 APPLICATIONS APPROVED, NOT ACCEPTED 2 $57,910 0 $0 1 $32,990 APPLICATIONS DENIED 0 $0 0 $0 0 $0 APPLICATIONS WITHDRAWN 1 $107,240 1 $40,980 1 $40,980 FILES CLOSED FOR INCOMPLETENESS 0 $0 0 $0 0 $0
Aggregated Statistics For Year 2004(Based on 3 full and 2 partial tracts) A) Conventional B) Refinancings C) Non-occupant Loans on Number Average Value Number Average Value Number Average Value
LOANS ORIGINATED 30 $61,336 14 $55,695 17 $45,841 APPLICATIONS APPROVED, NOT ACCEPTED 3 $127,653 1 $58,810 4 $42,470 APPLICATIONS DENIED 0 $0 0 $0 0 $0 APPLICATIONS WITHDRAWN 1 $61,990 0 $0 1 $57,510 FILES CLOSED FOR INCOMPLETENESS 0 $0 0 $0 0 $0
Aggregated Statistics For Year 2003(Based on 3 full and 2 partial tracts) A) Conventional B) Refinancings C) Non-occupant Loans on Number Average Value Number Average Value Number Average Value
LOANS ORIGINATED 17 $50,139 23 $65,300 10 $42,071 APPLICATIONS APPROVED, NOT ACCEPTED 5 $40,458 5 $63,192 4 $27,740 APPLICATIONS DENIED 0 $0 1 $75,070 0 $0 APPLICATIONS WITHDRAWN 0 $0 0 $0 0 $0 FILES CLOSED FOR INCOMPLETENESS 0 $0 1 $55,990 0 $0
Aggregated Statistics For Year 2002(Based on 3 full and 2 partial tracts) A) Conventional B) Refinancings C) Non-occupant Loans on Number Average Value Number Average Value Number Average Value
LOANS ORIGINATED 21 $56,153 20 $60,282 14 $43,993 APPLICATIONS APPROVED, NOT ACCEPTED 3 $64,807 6 $66,482 1 $49,980 APPLICATIONS DENIED 0 $0 0 $0 0 $0 APPLICATIONS WITHDRAWN 4 $46,738 1 $53,990 2 $28,490 FILES CLOSED FOR INCOMPLETENESS 0 $0 0 $0 0 $0
Aggregated Statistics For Year 2001(Based on 3 full and 2 partial tracts) A) Conventional B) Refinancings C) Non-occupant Loans on Number Average Value Number Average Value Number Average Value
LOANS ORIGINATED 18 $38,110 17 $62,472 13 $32,750 APPLICATIONS APPROVED, NOT ACCEPTED 2 $33,685 0 $0 1 $43,000 APPLICATIONS DENIED 0 $0 2 $48,505 0 $0 APPLICATIONS WITHDRAWN 0 $0 0 $0 0 $0 FILES CLOSED FOR INCOMPLETENESS 0 $0 0 $0 0 $0
Aggregated Statistics For Year 2000(Based on 3 full and 2 partial tracts) A) Conventional B) Refinancings Number Average Value Number Average Value
LOANS ORIGINATED 11 $69,033 2 $56,960 APPLICATIONS APPROVED, NOT ACCEPTED 1 $53,580 2 $53,260 APPLICATIONS DENIED 0 $0 0 $0 APPLICATIONS WITHDRAWN 1 $43,870 0 $0 FILES CLOSED FOR INCOMPLETENESS 0 $0 0 $0
Aggregated Statistics For Year 1999(Based on 3 full and 1 partial tracts) A) Conventional B) Refinancings C) Non-occupant Loans on Number Average Value Number Average Value Number Average Value
LOANS ORIGINATED 8 $53,430 4 $51,468 1 $52,490 APPLICATIONS APPROVED, NOT ACCEPTED 1 $62,870 0 $0 0 $0 APPLICATIONS DENIED 1 $74,280 0 $0 0 $0 APPLICATIONS WITHDRAWN 0 $0 0 $0 0 $0 FILES CLOSED FOR INCOMPLETENESS 0 $0 0 $0 0 $0
Most common first names in zip code 36611 among deceased individuals Name Count Lived (average)
James 87 71.7 years William 77 71.5 years John 63 71.9 years Mary 60 77.9 years Robert 41 73.7 years Charles 40 73.7 years George 26 74.8 years Willie 25 74.5 years Thomas 24 69.9 years Annie 24 80.8 years
Most common last names in zip code 36611 among deceased individuals Last name Count Lived (average)
Smith 53 73.6 years Davis 27 77.4 years Williams 27 76.0 years Jones 24 71.9 years Johnson 18 75.2 years Moore 17 76.1 years Brown 14 74.4 years Taylor 13 75.6 years Thomas 13 75.5 years Thompson 12 77.9 years
Businesses in zip code 36611
Name Count Name Count
AutoZone 1 Rite Aid 1 Church's Chicken 1 Subway 1 Little Caesars Pizza 1 U-Haul 1 Pizza Hut 1

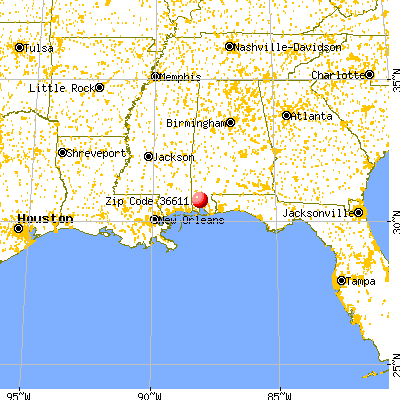

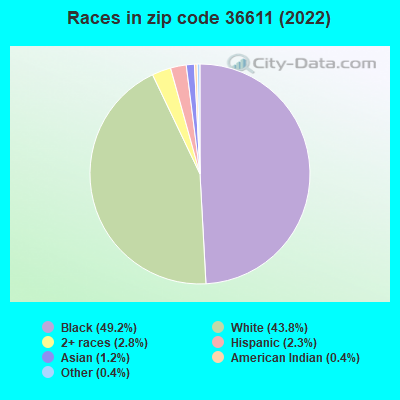


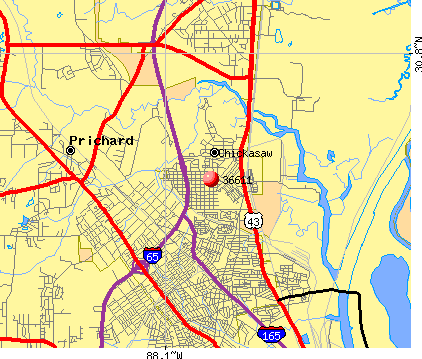 Nearest zip codes: 36610, 36612, 36616, 36617, 36607, 36602.