Averages for the 2020 tax year for zip code 35677, filed in 2021:
Average Adjusted Gross Income (AGI) in 2020: $47,063 (Individual Income Tax Returns)
Here:
$47,063
State:
$63,984
Salary/wage: $44,444 (reported on 80.3% of returns)
Here:
$44,444
State:
$52,834
(% of AGI for various income ranges: 1171.7% for AGIs below $25k, 3462.5% for AGIs $25k-50k, 6535.0% for AGIs $50k-75k, 10184.0% for AGIs $75k-100k, 21390.0% for AGIs $100k-200k)
Taxable interest for individuals: $824 (reported on 32.9% of returns)
This zip code:
$824
Alabama:
$1,615
(% of AGI for various income ranges: 31.3% for AGIs below $25k, 7.5% for AGIs $25k-50k, 95.0% for AGIs $50k-75k, 6.0% for AGIs $75k-100k, 107.5% for AGIs $100k-200k)
Ordinary dividends: $2,700 (reported on 6.6% of returns)
Here:
$2,700
State:
$7,660
(% of AGI for various income ranges: 28.7% for AGIs $25k-50k, 178.0% for AGIs $75k-100k)
Net capital gain/loss in AGI: +$1,233 (reported on 7.9% of returns)
Here:
+$1,233
State:
+$23,528
(% of AGI for various income ranges: 25.6% for AGIs $25k-50k, 66.0% for AGIs $75k-100k)
Profit/loss from business: +$6,407 (reported on 18.4% of returns)
Here:
+$6,407
State:
+$9,534
(% of AGI for various income ranges: 152.6% for AGIs below $25k, 330.0% for AGIs $25k-50k, 36.0% for AGIs $75k-100k)
Taxable individual retirement arrangement distribution: $13,633 (reported on 7.9% of returns)
35677:
$13,633
Alabama:
$19,004
(% of AGI for various income ranges: 142.2% for AGIs below $25k, 613.8% for AGIs $50k-75k)
Earned income credit: $2,671 (reported on 22.4% of returns)
Here:
$2,671
State:
$2,628
(% of AGI for various income ranges: 132.2% for AGIs below $25k, 93.8% for AGIs $25k-50k)
Percentage of individuals using paid preparers for their 2020 taxes: 94.7%
Here:
95%
State:
93%
(% for various income ranges: 96.6% for AGIs below $25k, 95.0% for AGIs $25k-50k, 91.7% for AGIs $50k-75k, 85.7% for AGIs $75k-100k, 100.0% for AGIs $100k-200k)
Averages for the 2012 tax year for zip code 35677, filed in 2013:
Average Adjusted Gross Income (AGI) in 2012: $38,680 (Individual Income Tax Returns)
Here:
$38,680
State:
$52,001
Salary/wage: $36,749 (reported on 83.1% of returns)
Here:
$36,749
State:
$43,822
(% of AGI for various income ranges: 74.5% for AGIs below $25k, 83.7% for AGIs $25k-50k, 83.0% for AGIs $50k-75k, 80.0% for AGIs $75k-100k, 70.8% for AGIs $100k-200k)
Taxable interest for individuals: $741 (reported on 31.0% of returns)
This zip code:
$741
Alabama:
$1,592
(% of AGI for various income ranges: 1.2% for AGIs below $25k, 0.4% for AGIs $25k-50k, 0.7% for AGIs $50k-75k, 0.3% for AGIs $75k-100k, 0.6% for AGIs $100k-200k)
Ordinary dividends: $1,350 (reported on 8.5% of returns)
Here:
$1,350
State:
$5,697
Net capital gain/loss in AGI: +$4,040 (reported on 7.0% of returns)
Here:
+$4,040
State:
+$13,286
Profit/loss from business: +$6,407 (reported on 21.1% of returns)
Here:
+$6,407
State:
+$9,151
(% of AGI for various income ranges: 11.6% for AGIs below $25k, 5.9% for AGIs $25k-50k, 1.4% for AGIs $50k-75k)
Taxable individual retirement arrangement distribution: $8,260 (reported on 7.0% of returns)
35677:
$8,260
Alabama:
$14,992
Total itemized deductions: $17,636 (24% of AGI, reported on 15.5% of returns)
Here:
$17,636
State:
$21,388
Here:
24.0% of AGI
State:
20.1% of AGI
(% of AGI for various income ranges: 7.9% for AGIs $25k-50k, 8.5% for AGIs $50k-75k, 18.6% for AGIs $75k-100k)
Charity contributions: $4,267 (reported on 12.7% of returns)
Here:
$4,267
State:
$5,925
(% of AGI for various income ranges: 1.6% for AGIs below $25k, 1.5% for AGIs $50k-75k, 4.7% for AGIs $75k-100k)
Taxes paid: $3,545 (reported on 15.5% of returns)
35677:
$3,545
State:
$5,272
(% of AGI for various income ranges: 0.9% for AGIs $25k-50k, 1.4% for AGIs $50k-75k, 5.2% for AGIs $75k-100k)
Earned income credit: $2,535 (reported on 28.2% of returns)
Here:
$2,535
State:
$2,646
(% of AGI for various income ranges: 9.2% for AGIs below $25k, 1.9% for AGIs $25k-50k)
Percentage of individuals using paid preparers for their 2012 taxes: 85.9%
Here:
86%
State:
60%
(% for various income ranges: 81.8% for AGIs below $25k, 88.9% for AGIs $25k-50k, 90.9% for AGIs $50k-75k, 100.0% for AGIs $75k-100k, 75.0% for AGIs $100k-200k)
Averages for the 2004 tax year for zip code 35677, filed in 2005:
Average Adjusted Gross Income (AGI) in 2004: $29,353 (Individual Income Tax Returns)
Here:
$29,353
State:
$42,302
Salary/wage: $28,883 (reported on 85.4% of returns)
Here:
$28,883
State:
$36,626
(% of AGI for various income ranges: 100.6% for AGIs below $10k, 80.6% for AGIs $10k-25k, 88.5% for AGIs $25k-50k, 86.4% for AGIs $50k-75k, 77.3% for AGIs $75k-100k, 70.1% for AGIs over 100k)
Taxable interest for individuals: $702 (reported on 42.6% of returns)
This zip code:
$702
Alabama:
$1,827
(% of AGI for various income ranges: 2.0% for AGIs below $10k, 1.3% for AGIs $10k-25k, 1.0% for AGIs $25k-50k, 0.4% for AGIs $50k-75k, 1.5% for AGIs $75k-100k, 1.1% for AGIs over 100k)
Taxable dividends: $914 (reported on 9.5% of returns)
Here:
$914
State:
$4,206
(% of AGI for various income ranges: 0.2% for AGIs $10k-25k, 0.1% for AGIs $25k-50k, 0.1% for AGIs $50k-75k, 1.7% for AGIs $75k-100k)
Net capital gain/loss: +$738 (reported on 5.7% of returns)
Here:
+$738
State:
+$13,031
Profit/loss from business: +$4,424 (reported on 23.3% of returns)
Here:
+$4,424
State:
+$8,302
(% of AGI for various income ranges: 16.1% for AGIs below $10k, 7.8% for AGIs $10k-25k, 3.7% for AGIs $25k-50k, 0.7% for AGIs $50k-75k, 0.9% for AGIs $75k-100k)
IRA payment deduction: $3,875 (reported on 2.2% of returns)
35677:
$3,875
Alabama:
$3,006
Total itemized deductions: $15,108 (28% of AGI, reported on 16.2% of returns)
Here:
$15,108
State:
$17,623
Here:
27.7% of AGI
State:
20.8% of AGI
(% of AGI for various income ranges: 8.3% for AGIs $10k-25k, 7.0% for AGIs $25k-50k, 8.3% for AGIs $50k-75k, 21.8% for AGIs $75k-100k)
Charity contributions deductions: $3,078 (6% of AGI, reported on 13.8% of returns)
Here:
$3,078
State:
$4,768
Here:
5.7% of AGI
State:
5.4% of AGI
(% of AGI for various income ranges: 1.1% for AGIs $10k-25k, 1.2% for AGIs $25k-50k, 1.2% for AGIs $50k-75k, 4.7% for AGIs $75k-100k)
Total tax: $3,248 (reported on 67.7% of returns)
35677:
$3,248
State:
$6,905
(% of AGI for various income ranges: 3.6% for AGIs below $10k, 3.7% for AGIs $10k-25k, 5.7% for AGIs $25k-50k, 8.4% for AGIs $50k-75k, 10.6% for AGIs $75k-100k, 17.1% for AGIs over 100k)
Earned income credit: $1,820 (reported on 27.1% of returns)
Here:
$1,820
State:
$2,048
Percentage of individuals using paid preparers for their 2004 taxes: 84.4%
Here:
84%
State:
65%
(% for various income ranges: 76.9% for AGIs below $10k, 83.7% for AGIs $10k-25k, 90.6% for AGIs $25k-50k, 85.5% for AGIs $50k-75k, 83.3% for AGIs $75k-100k, 85.7% for AGIs over 100k)
Likely homosexual households (counted as self-reported same-sex unmarried-partner households)
Lesbian couples: 0.9% of all households
Gay men: 0.6% of all households
Household received Food Stamps/SNAP in the past 12 months: 40 Household did not receive Food Stamps/SNAP in the past 12 months: 668
Women who had a birth in the past 12 months: 1 (1 now married, 0 unmarried) Women who did not have a birth in the past 12 months: 515 (167 now married, 348 unmarried)
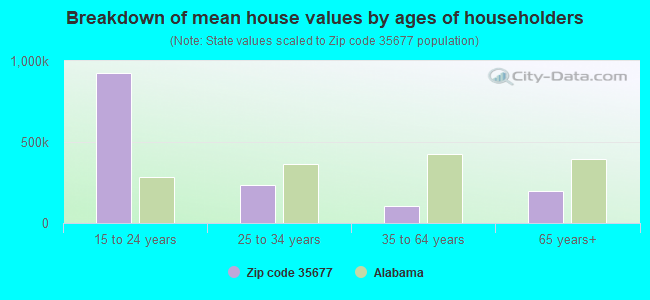
Housing units in zip code 35677 with a mortgage: 164 (38 second mortgage, 1 both second mortgage and home equity loan) Median monthly owner costs for units with a mortgage: $1,152 Median monthly owner costs for units without a mortgage: $259
Residents with income below the poverty level in 2022:
This zip code:
10.4%
Whole state:
16.2%
Residents with income below 50% of the poverty level in 2022:
This zip code:
7.6%
Whole state:
8.6%
Median number of rooms in houses and condos:
Here:
6.3
State:
6.5
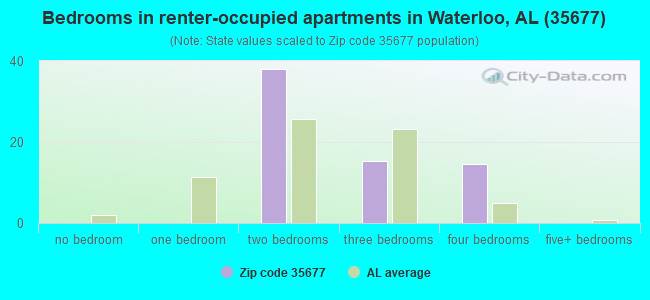
Median number of rooms in apartments:
Here:
4.6
State:
4.7
Notable locations in this zip code not listed on our city pages
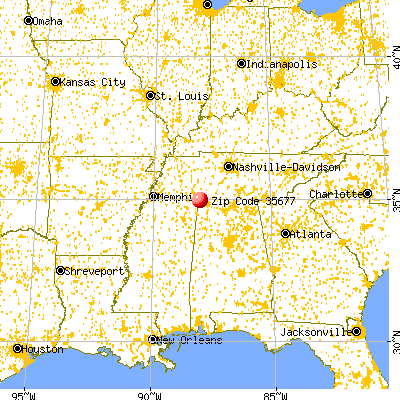
Notable locations in zip code 35677: Smith Landing (A), Thomas Landing (B), Second Creek Cabin Area (C), Waterloo Landing (D), Shellbank Landing (E), Shaw Landing (F), Robinson Landing (G), Parker Landing (H), Johnny Landing (I), Waterloo Volunteer Fire and Rescue Department Station 3 (J), Waterloo Volunteer Fire and Rescue Department Station 1 (K). Display/hide their locations on the map
Churches in zip code 35677 include: Oak Grove Church (A), Murphy Chapel (B), Mount Olive Freewill Baptist Church (C), Lambs Chapel Freewill Baptist Church (D), Bumpass Creek Church (E), First United Pentecostal Church (F), Piney Grove Church (G), Fords Mill Missionary Baptist Church (H), Youngs Church (I). Display/hide their locations on the map
Cemeteries: Scott Cemetery (1), Mount Hebron Cemetery (2), Parker Cemetery (3), Shaw Cemetery (4), Francis-King-Lucas Cemetery (5), Milford Cemetery (6), Wates Cemetery (7). Display/hide their locations on the map
Streams, rivers, and creeks: Second Creek (A), Richardson Branch (B), Potts Branch (C), Pigeon Branch (D), Panther Creek (E), Manbone Creek (F), Lindsey Branch (G), Baugh Creek (H), Dry Creek (I). Display/hide their locations on the map
Parks in zip code 35677 include: Brush Creek Park (1), Waterloo City Park (2), Threets Park (3), Second Creek Recreation Area (4), Lauderdale State Wildlife Management Area (5). Display/hide their locations on the map
Size of family households: 285 2-persons, 71 3-persons, 67 4-persons, 23 5-persons, 5 6-persons, 50 7-or-more-persons
Size of nonfamily households: 187 1-person, 15 2-persons, 4 3-persons
319 married couples with children.
9 single-parent households (2 men, 7 women).
98.8% of residents of 35677 zip code speak English at home.
0.4% of residents speak Spanish at home (100% very well).
0.3% of residents speak other Indo-European language at home (83% very well, 17% well).
0.2% of residents speak Asian or Pacific Island language at home (100% not well).
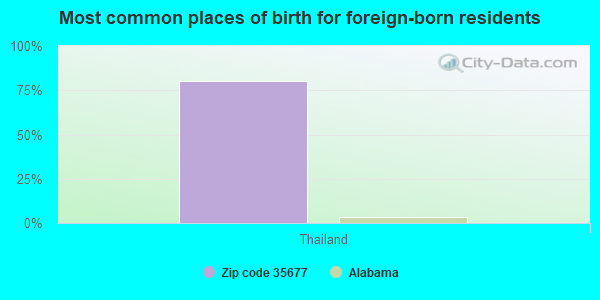
Foreign born population: 5 (0.3%) (0.0% of them are naturalized citizens)
:
0.3%
Whole state:
3.8%
80%Thailand
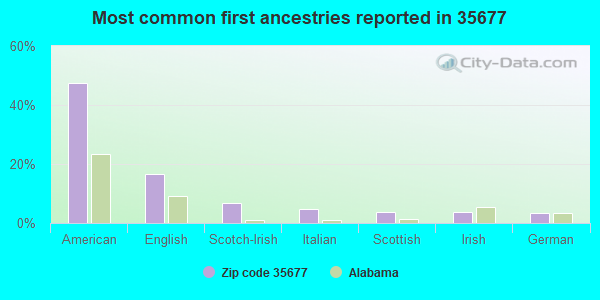
48%American
16%English
7%Scotch-Irish
5%Italian
4%Scottish
4%Irish
3%German
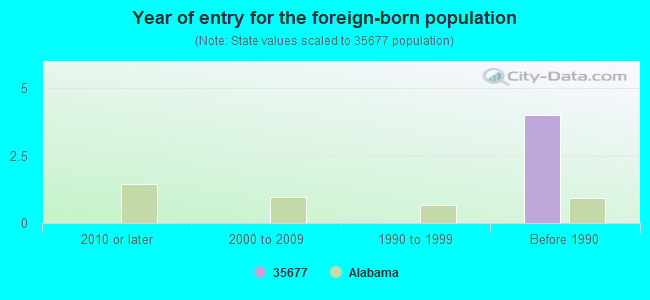
Year of entry for the foreign-born population
02010 or later
02000 to 2009
01990 to 1999
4Before 1990
Facilities with environmental interests located in this zip code:
LAKEVIEW MARKET (11709 COUNTY ROAD 14 in WATERLOO, AL)
National Pollutant Discharge Elimination System NON-MAJOR (Tracking pollutant discharge elimination systems) - permit Business SIC classification: GASOLINE SERVICE STATIONS
Housing units lacking complete plumbing facilities: 10.0% Housing units lacking complete kitchen facilities: 5.1%
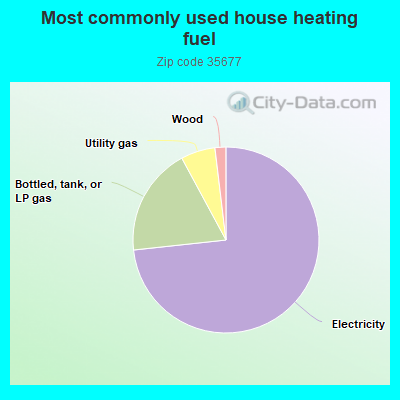
73.5%Electricity
18.9%Bottled, tank, or LP gas
6.0%Utility gas
1.9%Wood
Population in 1990: 1,899.
Place of birth for U.S.-born residents:
This state: 1,641
Northeast: 17
Midwest: 60
South: 135
West: 31
73% of the 35677 zip code residents lived in the same house 5 years ago. Out of people who lived in different houses, 80% lived in this county. Out of people who lived in different counties, 50% lived in Alabama.
94% of the 35677 zip code residents lived in the same house 1 year ago. Out of people who lived in different houses, 26% moved from this county. Out of people who lived in different houses, 8% moved from different county within same state. Out of people who lived in different houses, 74% moved from different state. Out of people who lived in different houses, 4% moved from abroad.
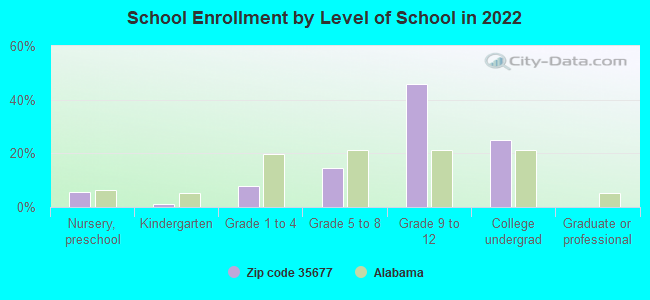
Private vs. public school enrollment:
Students in private schools in grades 1 to 8 (elementary and middle school):
Here:
0.0%
Alabama:
14.7%
Students in private schools in grades 9 to 12 (high school):
Here:
0.0%
Alabama:
16.3%
Students in private undergraduate colleges: 59
Here:
50.3%
Alabama:
14.6%
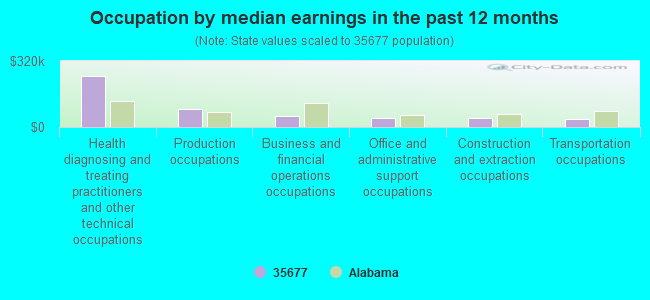
Occupation by median earnings in the past 12 months ($)
248,539Health diagnosing and treating practitioners and other technical occupations
85,953Production occupations
51,851Business and financial operations occupations
44,459Office and administrative support occupations
43,579Construction and extraction occupations
39,746Transportation occupations
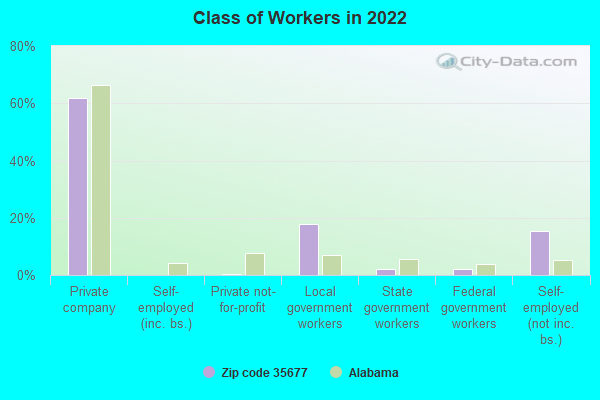
Top industries in this zip code by the number of employees in 2005:
Wholesale Trade: Motor Vehicle Supplies and New Parts Merchant Wholesalers (10-19 employees: 1 establishment)
Health Care and Social Assistance: Continuing Care Retirement Communities (5-9: 1, 1-4: 1)
Finance and Insurance: Commercial Banking (5-9: 1)
Other Services (except Public Administration): Religious Organizations (1-4: 1)
Fatal accident statistics in 2014:
Fatal accident count: 1
Vehicles involved in fatal accidents: 1
Fatal accidents caused by drunken drivers: 0
Fatalities: 1
Persons involved in fatal accidents: 1
Pedestrians involved in fatal accidents: 1
Fatal accident statistics in 2013:
Fatal accident count: 2
Vehicles involved in fatal accidents: 2
Fatal accidents caused by drunken drivers: 0
Fatalities: 2
Persons involved in fatal accidents: 3
Pedestrians involved in fatal accidents: 0
Home Mortgage Disclosure Act Aggregated Statistics For Year 2009 (Based on 2 partial tracts)
A) FHA, FSA/RHS & VA Home Purchase Loans
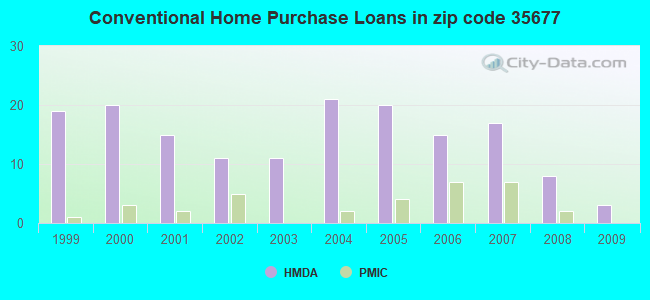
B) Conventional Home Purchase Loans
C) Refinancings
D) Home Improvement Loans
F) Non-occupant Loans on < 5 Family Dwellings (A B C & D)
G) Loans On Manufactured Home Dwelling (A B C & D)
Number
Average Value
Number
Average Value
Number
Average Value
Number
Average Value
Number
Average Value
Number
Average Value
LOANS ORIGINATED
4
$102,458
3
$131,403
20
$83,492
3
$19,090
4
$96,695
4
$67,685
APPLICATIONS APPROVED, NOT ACCEPTED
1
$102,640
1
$14,880
1
$251,400
1
$5,210
1
$14,880
1
$14,880
APPLICATIONS DENIED
1
$133,880
3
$103,883
10
$128,752
1
$8,180
1
$310,160
2
$30,495
APPLICATIONS WITHDRAWN
1
$29,010
0
$0
4
$116,962
1
$249,920
0
$0
1
$28,260
FILES CLOSED FOR INCOMPLETENESS
0
$0
1
$181,490
1
$96,690
0
$0
0
$0
0
$0
Aggregated Statistics For Year 2008 (Based on 2 partial tracts)
A) FHA, FSA/RHS & VA Home Purchase Loans
B) Conventional Home Purchase Loans
C) Refinancings
D) Home Improvement Loans
F) Non-occupant Loans on < 5 Family Dwellings (A B C & D)
G) Loans On Manufactured Home Dwelling (A B C & D)
Number
Average Value
Number
Average Value
Number
Average Value
Number
Average Value
Number
Average Value
Number
Average Value
LOANS ORIGINATED
1
$92,980
8
$115,382
22
$78,031
1
$121,240
4
$111,942
4
$51,880
APPLICATIONS APPROVED, NOT ACCEPTED
0
$0
2
$60,250
0
$0
0
$0
1
$103,390
1
$31,240
APPLICATIONS DENIED
1
$51,320
7
$57,166
4
$100,412
4
$44,815
1
$56,530
6
$34,090
APPLICATIONS WITHDRAWN
0
$0
1
$137,600
2
$171,820
0
$0
0
$0
0
$0
FILES CLOSED FOR INCOMPLETENESS
0
$0
0
$0
1
$165,120
0
$0
0
$0
0
$0
Aggregated Statistics For Year 2007 (Based on 2 partial tracts)
B) Conventional Home Purchase Loans
C) Refinancings
D) Home Improvement Loans
F) Non-occupant Loans on < 5 Family Dwellings (A B C & D)
G) Loans On Manufactured Home Dwelling (A B C & D)
Number
Average Value
Number
Average Value
Number
Average Value
Number
Average Value
Number
Average Value
LOANS ORIGINATED
17
$73,724
19
$79,547
5
$27,818
8
$95,764
4
$32,355
APPLICATIONS APPROVED, NOT ACCEPTED
4
$63,038
4
$59,132
0
$0
0
$0
2
$56,900
APPLICATIONS DENIED
8
$50,114
10
$66,719
3
$23,307
0
$0
4
$37,748
APPLICATIONS WITHDRAWN
1
$65,450
2
$57,275
1
$155,450
0
$0
0
$0
FILES CLOSED FOR INCOMPLETENESS
1
$44,630
1
$71,400
1
$73,640
0
$0
0
$0
Aggregated Statistics For Year 2006 (Based on 2 partial tracts)
A) FHA, FSA/RHS & VA Home Purchase Loans
B) Conventional Home Purchase Loans
C) Refinancings
D) Home Improvement Loans
F) Non-occupant Loans on < 5 Family Dwellings (A B C & D)
G) Loans On Manufactured Home Dwelling (A B C & D)
Number
Average Value
Number
Average Value
Number
Average Value
Number
Average Value
Number
Average Value
Number
Average Value
LOANS ORIGINATED
1
$17,110
15
$69,173
23
$58,987
4
$11,715
4
$64,338
8
$31,611
APPLICATIONS APPROVED, NOT ACCEPTED
1
$45,370
4
$132,768
4
$57,458
1
$9,670
1
$13,390
1
$58,760
APPLICATIONS DENIED
1
$50,580
3
$39,670
16
$65,548
6
$40,908
1
$11,160
2
$40,165
APPLICATIONS WITHDRAWN
0
$0
2
$96,320
7
$73,211
0
$0
0
$0
1
$58,760
FILES CLOSED FOR INCOMPLETENESS
0
$0
1
$73,640
2
$83,305
0
$0
0
$0
0
$0
Aggregated Statistics For Year 2005 (Based on 2 partial tracts)
A) FHA, FSA/RHS & VA Home Purchase Loans
B) Conventional Home Purchase Loans
C) Refinancings
D) Home Improvement Loans
F) Non-occupant Loans on < 5 Family Dwellings (A B C & D)
G) Loans On Manufactured Home Dwelling (A B C & D)
Number
Average Value
Number
Average Value
Number
Average Value
Number
Average Value
Number
Average Value
Number
Average Value
LOANS ORIGINATED
1
$35,700
20
$68,355
25
$73,190
4
$50,950
4
$118,450
8
$30,124
APPLICATIONS APPROVED, NOT ACCEPTED
0
$0
1
$15,620
7
$59,397
1
$3,720
1
$28,260
1
$15,620
APPLICATIONS DENIED
1
$33,470
10
$39,198
20
$70,178
1
$58,760
1
$22,310
11
$43,816
APPLICATIONS WITHDRAWN
0
$0
2
$75,870
3
$73,883
0
$0
0
$0
0
$0
FILES CLOSED FOR INCOMPLETENESS
0
$0
1
$54,300
3
$106,117
0
$0
0
$0
0
$0
Aggregated Statistics For Year 2004 (Based on 2 partial tracts)
A) FHA, FSA/RHS & VA Home Purchase Loans
B) Conventional Home Purchase Loans
C) Refinancings
D) Home Improvement Loans
F) Non-occupant Loans on < 5 Family Dwellings (A B C & D)
G) Loans On Manufactured Home Dwelling (A B C & D)
Number
Average Value
Number
Average Value
Number
Average Value
Number
Average Value
Number
Average Value
Number
Average Value
LOANS ORIGINATED
1
$66,200
21
$57,202
19
$68,938
4
$13,018
1
$71,400
7
$39,634
APPLICATIONS APPROVED, NOT ACCEPTED
0
$0
1
$76,610
8
$72,520
0
$0
0
$0
1
$36,450
APPLICATIONS DENIED
0
$0
7
$41,121
19
$71,170
5
$40,760
0
$0
10
$36,521
APPLICATIONS WITHDRAWN
0
$0
1
$26,030
3
$61,983
1
$5,950
0
$0
1
$38,680
FILES CLOSED FOR INCOMPLETENESS
0
$0
0
$0
5
$107,852
0
$0
0
$0
0
$0
Aggregated Statistics For Year 2003 (Based on 2 partial tracts)
A) FHA, FSA/RHS & VA Home Purchase Loans
B) Conventional Home Purchase Loans
C) Refinancings
D) Home Improvement Loans
F) Non-occupant Loans on < 5 Family Dwellings (A B C & D)
Number
Average Value
Number
Average Value
Number
Average Value
Number
Average Value
Number
Average Value
LOANS ORIGINATED
1
$44,630
11
$47,874
34
$73,680
2
$39,420
4
$70,290
APPLICATIONS APPROVED, NOT ACCEPTED
0
$0
1
$20,830
13
$55,957
0
$0
0
$0
APPLICATIONS DENIED
0
$0
22
$31,070
15
$65,455
2
$24,545
2
$31,985
APPLICATIONS WITHDRAWN
0
$0
3
$49,587
7
$98,607
0
$0
1
$205,290
FILES CLOSED FOR INCOMPLETENESS
0
$0
0
$0
1
$187,440
0
$0
1
$132,400
Aggregated Statistics For Year 2002 (Based on 2 partial tracts)
A) FHA, FSA/RHS & VA Home Purchase Loans
B) Conventional Home Purchase Loans
C) Refinancings
D) Home Improvement Loans
F) Non-occupant Loans on < 5 Family Dwellings (A B C & D)
Number
Average Value
Number
Average Value
Number
Average Value
Number
Average Value
Number
Average Value
LOANS ORIGINATED
1
$123,470
11
$54,500
22
$77,254
2
$3,720
2
$79,215
APPLICATIONS APPROVED, NOT ACCEPTED
0
$0
0
$0
7
$70,130
0
$0
0
$0
APPLICATIONS DENIED
0
$0
12
$41,901
17
$56,704
2
$22,685
1
$56,530
APPLICATIONS WITHDRAWN
0
$0
0
$0
2
$84,050
1
$73,640
0
$0
FILES CLOSED FOR INCOMPLETENESS
0
$0
0
$0
0
$0
0
$0
0
$0
Aggregated Statistics For Year 2001 (Based on 2 partial tracts)
B) Conventional Home Purchase Loans
C) Refinancings
D) Home Improvement Loans
F) Non-occupant Loans on < 5 Family Dwellings (A B C & D)
Number
Average Value
Number
Average Value
Number
Average Value
Number
Average Value
LOANS ORIGINATED
15
$39,570
18
$65,950
4
$39,980
4
$41,280
APPLICATIONS APPROVED, NOT ACCEPTED
5
$25,586
4
$41,652
0
$0
1
$33,470
APPLICATIONS DENIED
19
$38,286
11
$54,027
1
$60,990
0
$0
APPLICATIONS WITHDRAWN
2
$62,480
9
$50,909
0
$0
0
$0
FILES CLOSED FOR INCOMPLETENESS
0
$0
0
$0
0
$0
0
$0
Aggregated Statistics For Year 2000 (Based on 2 partial tracts)
A) FHA, FSA/RHS & VA Home Purchase Loans
B) Conventional Home Purchase Loans
C) Refinancings
D) Home Improvement Loans
F) Non-occupant Loans on < 5 Family Dwellings (A B C & D)
Number
Average Value
Number
Average Value
Number
Average Value
Number
Average Value
Number
Average Value
LOANS ORIGINATED
1
$62,480
20
$50,020
12
$38,678
1
$30,500
4
$34,588
APPLICATIONS APPROVED, NOT ACCEPTED
1
$45,370
4
$53,925
1
$64,710
1
$29,010
0
$0
APPLICATIONS DENIED
1
$21,570
22
$37,224
8
$46,395
0
$0
1
$40,910
APPLICATIONS WITHDRAWN
0
$0
3
$65,703
5
$43,884
0
$0
0
$0
FILES CLOSED FOR INCOMPLETENESS
0
$0
1
$47,600
3
$41,900
0
$0
0
$0
Aggregated Statistics For Year 1999 (Based on 2 partial tracts)
A) FHA, FSA/RHS & VA Home Purchase Loans
B) Conventional Home Purchase Loans
C) Refinancings
D) Home Improvement Loans
F) Non-occupant Loans on < 5 Family Dwellings (A B C & D)
Detailed PMIC statistics for the following Tracts:0113.00
2005 - 2018 National Fire Incident Reporting System (NFIRS) incidents
According to the data from the years 2005 - 2018 the average number of fires per year is 16. The highest number of reported fire incidents - 39 took place in 2006, and the least - 2 in 2013. The data has an increasing trend.
When looking into fire subcategories, the most reports belonged to: Outside Fires (60.3%), and Structure Fires (29.2%).
Fire incident types reported to NFIRS in Zip Code 35677


 Nearest zip codes: 38471, 35616, 38852, 38365, 35633, 38372.


 According to the data from the years 2005 - 2018 the average number of fires per year is 16. The highest number of reported fire incidents - 39 took place in 2006, and the least - 2 in 2013. The data has an increasing trend.
 When looking into fire subcategories, the most reports belonged to: Outside Fires (60.3%), and Structure Fires (29.2%).