Estimated zip code population in 2022: 3,438 Zip code population in 2010: 2,719 Zip code population in 2000: 1,198
Houses and condos: 1,515 Renter-occupied apartments: 74
% of renters here:
6%
State:
30%
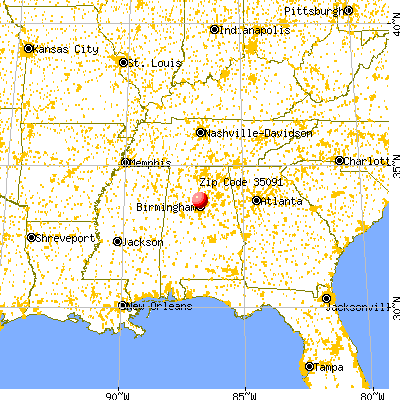
March 2022 cost of living index in zip code 35091: 82.3 (low, U.S. average is 100)
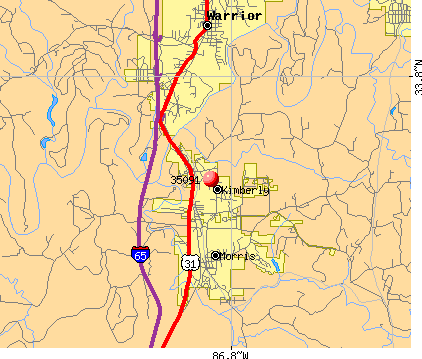
Land area: 6.6 sq. mi. Water area: 0.0 sq. mi.
Population density: 525 people per square mile
(low).
OSM Map
General Map
Google Map
MSN Map
OSM Map
General Map
Google Map
MSN Map
OSM Map
General Map
Google Map
MSN Map
OSM Map
General Map
Google Map
MSN Map
Please wait while loading the map...
Real estate property taxes paid for housing units in 2022:
This zip code:
0.5% ($1,355)
Alabama:
0.4% ($718)
Median real estate property taxes paid for housing units with mortgages in 2022: $1,417 (0.5%) Median real estate property taxes paid for housing units with no mortgage in 2022: $1,242 (0.4%)
Business Search- 14 Million verified businesses
Males: 1,702
(49.5%)
Females: 1,735
(50.5%)
For population 25 years and over in 35091:
High school or higher: 95.0%
Bachelor's degree or higher: 32.7%
Graduate or professional degree: 17.5%
Mean travel time to work (commute): 32.0 minutes
For population 15 years and over in 35091:
Never married: 14.6%
Now married: 72.4%
Separated: 0.0%
Widowed: 4.0%
Divorced: 9.0%
Zip code 35091 compared to state average:
Median household income above state average.
Unemployed percentage significantly below state average.
Black race population percentage significantly below state average.
Hispanic race population percentage significantly below state average.
Foreign-born population percentage significantly below state average.
Renting percentage significantly below state average.
Estimated median house/condo value in 2022: $295,527
35091:
$295,527
Alabama:
$200,900
According to our research of Alabama and other state lists, there was 1 registered sex offender living in 35091 zip code as of May 24, 2024. The ratio of all residents to sex offenders in zip code 35091 is 3,023 to 1. The ratio of registered sex offenders to all residents in this zip code is much lower than the state average.
Median resident age:
This zip code:
41.6 years
Alabama median age:
39.6 years
Average household size:
This zip code:
2.7 people
Alabama:
2.5 people
Averages for the 2020 tax year for zip code 35091, filed in 2021:
Average Adjusted Gross Income (AGI) in 2020: $75,164 (Individual Income Tax Returns)
Here:
$75,164
State:
$63,984
Salary/wage: $71,666 (reported on 87.4% of returns)
Here:
$71,666
State:
$52,834
(% of AGI for various income ranges: 1072.7% for AGIs below $25k, 3606.4% for AGIs $25k-50k, 6542.5% for AGIs $50k-75k, 9212.0% for AGIs $75k-100k, 17460.8% for AGIs $100k-200k)
Taxable interest for individuals: $545 (reported on 29.4% of returns)
This zip code:
$545
Alabama:
$1,615
(% of AGI for various income ranges: 19.6% for AGIs below $25k, 19.1% for AGIs $25k-50k, 10.0% for AGIs $50k-75k, 15.3% for AGIs $75k-100k, 31.9% for AGIs $100k-200k)
Ordinary dividends: $1,233 (reported on 10.5% of returns)
Here:
$1,233
State:
$7,660
(% of AGI for various income ranges: 25.9% for AGIs $25k-50k, 10.6% for AGIs $50k-75k, 10.7% for AGIs $75k-100k, 36.5% for AGIs $100k-200k)
Net capital gain/loss in AGI: +$3,754 (reported on 9.1% of returns)
Here:
+$3,754
State:
+$23,528
(% of AGI for various income ranges: 13.2% for AGIs $25k-50k, 6.7% for AGIs $75k-100k, 172.7% for AGIs $100k-200k)
Profit/loss from business: +$5,583 (reported on 16.8% of returns)
Here:
+$5,583
State:
+$9,534
(% of AGI for various income ranges: 116.2% for AGIs below $25k, 15.0% for AGIs $25k-50k, 103.1% for AGIs $50k-75k, 141.3% for AGIs $75k-100k, 241.5% for AGIs $100k-200k)
Taxable individual retirement arrangement distribution: $16,236 (reported on 7.7% of returns)
35091:
$16,236
Alabama:
$19,004
(% of AGI for various income ranges: 134.2% for AGIs below $25k, 395.0% for AGIs $50k-75k, 309.6% for AGIs $100k-200k)
Total itemized deductions: $28,085 (reported on 9.1% of returns)
Here:
$28,085
State:
$37,338
(% of AGI for various income ranges: 678.8% for AGIs $50k-75k, 652.7% for AGIs $100k-200k)
Charity contributions: $11,400 (reported on 8.4% of returns)
Here:
$11,400
State:
$18,005
(% of AGI for various income ranges: 123.1% for AGIs $50k-75k, 450.4% for AGIs $100k-200k)
Taxes paid: $6,815 (reported on 9.1% of returns)
35091:
$6,815
State:
$6,484
(% of AGI for various income ranges: 134.4% for AGIs $50k-75k, 178.1% for AGIs $100k-200k)
Earned income credit: $2,064 (reported on 9.8% of returns)
Here:
$2,064
State:
$2,628
(% of AGI for various income ranges: 55.4% for AGIs below $25k, 65.9% for AGIs $25k-50k)
Percentage of individuals using paid preparers for their 2020 taxes: 94.4%
Here:
94%
State:
93%
(% for various income ranges: 93.9% for AGIs below $25k, 92.6% for AGIs $25k-50k, 95.0% for AGIs $50k-75k, 94.7% for AGIs $75k-100k, 94.9% for AGIs $100k-200k, 100.0% for AGIs over 200k)
Averages for the 2012 tax year for zip code 35091, filed in 2013:
Average Adjusted Gross Income (AGI) in 2012: $63,015 (Individual Income Tax Returns)
Here:
$63,015
State:
$52,001
Salary/wage: $62,006 (reported on 89.5% of returns)
Here:
$62,006
State:
$43,822
(% of AGI for various income ranges: 73.8% for AGIs below $25k, 78.8% for AGIs $25k-50k, 87.4% for AGIs $50k-75k, 87.7% for AGIs $75k-100k, 92.7% for AGIs $100k-200k)
Taxable interest for individuals: $358 (reported on 34.3% of returns)
This zip code:
$358
Alabama:
$1,592
(% of AGI for various income ranges: 0.8% for AGIs below $25k, 0.4% for AGIs $25k-50k, 0.2% for AGIs $50k-75k, 0.1% for AGIs $100k-200k)
Ordinary dividends: $690 (reported on 9.5% of returns)
Here:
$690
State:
$5,697
(% of AGI for various income ranges: 0.2% for AGIs $25k-50k, 0.1% for AGIs $75k-100k, 0.1% for AGIs $100k-200k)
Net capital gain/loss in AGI: +$33 (reported on 5.7% of returns)
Here:
+$33
State:
+$13,286
Profit/loss from business: +$4,376 (reported on 16.2% of returns)
Here:
+$4,376
State:
+$9,151
(% of AGI for various income ranges: 5.8% for AGIs below $25k, 1.1% for AGIs $25k-50k, 2.5% for AGIs $50k-75k, 1.0% for AGIs $75k-100k)
Taxable individual retirement arrangement distribution: $12,900 (reported on 6.7% of returns)
35091:
$12,900
Alabama:
$14,992
Total itemized deductions: $19,161 (22% of AGI, reported on 48.6% of returns)
Here:
$19,161
State:
$21,388
Here:
21.6% of AGI
State:
20.1% of AGI
(% of AGI for various income ranges: 9.0% for AGIs below $25k, 14.6% for AGIs $25k-50k, 14.2% for AGIs $50k-75k, 14.5% for AGIs $75k-100k, 16.0% for AGIs $100k-200k)
Charity contributions: $4,319 (reported on 44.8% of returns)
Here:
$4,319
State:
$5,925
(% of AGI for various income ranges: 1.2% for AGIs below $25k, 2.1% for AGIs $25k-50k, 2.8% for AGIs $50k-75k, 2.7% for AGIs $75k-100k, 3.9% for AGIs $100k-200k)
Taxes paid: $5,084 (reported on 48.6% of returns)
35091:
$5,084
State:
$5,272
(% of AGI for various income ranges: 1.0% for AGIs below $25k, 2.3% for AGIs $25k-50k, 3.3% for AGIs $50k-75k, 3.9% for AGIs $75k-100k, 5.0% for AGIs $100k-200k)
Earned income credit: $2,038 (reported on 12.4% of returns)
Here:
$2,038
State:
$2,646
(% of AGI for various income ranges: 5.2% for AGIs below $25k, 1.2% for AGIs $25k-50k)
Percentage of individuals using paid preparers for their 2012 taxes: 60.0%
Here:
60%
State:
60%
(% for various income ranges: 53.6% for AGIs below $25k, 61.1% for AGIs $25k-50k, 61.1% for AGIs $50k-75k, 65.0% for AGIs $75k-100k, 61.9% for AGIs $100k-200k)
Averages for the 2004 tax year for zip code 35091, filed in 2005:
Average Adjusted Gross Income (AGI) in 2004: $46,517 (Individual Income Tax Returns)
Here:
$46,517
State:
$42,302
Salary/wage: $46,117 (reported on 92.0% of returns)
Here:
$46,117
State:
$36,626
(% of AGI for various income ranges: 79.1% for AGIs below $10k, 83.8% for AGIs $10k-25k, 88.7% for AGIs $25k-50k, 94.7% for AGIs $50k-75k, 91.9% for AGIs $75k-100k, 91.0% for AGIs over 100k)
Taxable interest for individuals: $574 (reported on 35.6% of returns)
This zip code:
$574
Alabama:
$1,827
(% of AGI for various income ranges: 1.8% for AGIs below $10k, 1.0% for AGIs $10k-25k, 0.4% for AGIs $25k-50k, 0.1% for AGIs $50k-75k, 0.6% for AGIs $75k-100k, 0.4% for AGIs over 100k)
Taxable dividends: $203 (reported on 9.9% of returns)
Here:
$203
State:
$4,206
(% of AGI for various income ranges: 0.3% for AGIs below $10k, 0.0% for AGIs $25k-50k, 0.0% for AGIs $50k-75k, 0.0% for AGIs $75k-100k, 0.1% for AGIs over 100k)
Profit/loss from business: +$1,824 (reported on 12.8% of returns)
Here:
+$1,824
State:
+$8,302
(% of AGI for various income ranges: 13.8% for AGIs below $10k, -0.8% for AGIs $10k-25k, -1.0% for AGIs $25k-50k, 1.1% for AGIs $50k-75k, 0.7% for AGIs $75k-100k)
Total itemized deductions: $16,091 (23% of AGI, reported on 46.8% of returns)
Here:
$16,091
State:
$17,623
Here:
23.1% of AGI
State:
20.8% of AGI
(% of AGI for various income ranges: 16.1% for AGIs $10k-25k, 13.2% for AGIs $25k-50k, 16.5% for AGIs $50k-75k, 18.7% for AGIs $75k-100k, 16.3% for AGIs over 100k)
Charity contributions deductions: $3,427 (5% of AGI, reported on 42.9% of returns)
Here:
$3,427
State:
$4,768
Here:
4.8% of AGI
State:
5.4% of AGI
(% of AGI for various income ranges: 2.7% for AGIs $10k-25k, 2.1% for AGIs $25k-50k, 2.8% for AGIs $50k-75k, 3.4% for AGIs $75k-100k, 4.8% for AGIs over 100k)
Total tax: $4,835 (reported on 76.2% of returns)
35091:
$4,835
State:
$6,905
(% of AGI for various income ranges: 2.6% for AGIs below $10k, 3.7% for AGIs $10k-25k, 5.0% for AGIs $25k-50k, 6.8% for AGIs $50k-75k, 8.5% for AGIs $75k-100k, 13.6% for AGIs over 100k)
Earned income credit: $1,694 (reported on 13.6% of returns)
Here:
$1,694
State:
$2,048
Percentage of individuals using paid preparers for their 2004 taxes: 59.2%
Here:
59%
State:
65%
(% for various income ranges: 47.7% for AGIs below $10k, 60.9% for AGIs $10k-25k, 63.7% for AGIs $25k-50k, 61.3% for AGIs $50k-75k, 58.0% for AGIs $75k-100k, 64.3% for AGIs over 100k)
Household received Food Stamps/SNAP in the past 12 months: 7 Household did not receive Food Stamps/SNAP in the past 12 months: 1,255
Women who had a birth in the past 12 months: 42 (47 now married, 0 unmarried) Women who did not have a birth in the past 12 months: 705 (537 now married, 165 unmarried)
Housing units in zip code 35091 with a mortgage: 814 (112 second mortgage, 73 both second mortgage and home equity loan) Houses without a mortgage: 28
Median monthly owner costs for units with a mortgage: $1,504 Median monthly owner costs for units without a mortgage: $561
Residents with income below the poverty level in 2022:
This zip code:
3.1%
Whole state:
16.2%
Residents with income below 50% of the poverty level in 2022:
This zip code:
2.1%
Whole state:
8.6%
Median number of rooms in houses and condos:
Here:
6.5
State:
6.5
Median number of rooms in apartments:
Here:
6.1
State:
4.7
Notable locations in this zip code not listed on our city pages
Size of family households: 380 2-persons, 427 3-persons, 154 4-persons, 73 5-persons, 19 6-persons
Size of nonfamily households: 178 1-person, 50 2-persons
810 married couples with children.
104 single-parent households (18 men, 86 women).
97.0% of residents of 35091 zip code speak English at home.
0.6% of residents speak Spanish at home (100% very well).
0.6% of residents speak other Indo-European language at home (100% very well).
1.6% of residents speak Asian or Pacific Island language at home (53% very well, 47% well).
Foreign born population: 23 (0.7%) (100.0% of them are naturalized citizens)
This zip code:
0.7%
Whole state:
3.8%
73%Japan
23%Malaysia
19%Irish
18%German
15%American
15%English
5%Scottish
4%European
0%Italian
Year of entry for the foreign-born population
02010 or later
02000 to 2009
61990 to 1999
24Before 1990
Facilities with environmental interests located in this zip code:
NORTH JEFFERSON MIDDLE SCHOOL (JEFFERSON CO BD OF EDUCATION in KIMBERLY, AL)
National Pollutant Discharge Elimination System NON-MAJOR (Tracking pollutant discharge elimination systems) - permit National Pollutant Discharge Elimination System NON-MAJOR (Tracking pollutant discharge elimination systems) - permit Business SIC classification: GENERAL CONTRACTORS-SINGLE-FAMILY HOUSES; EXCAVATION WORK Alternative names: JEFF CO BOE NO JEFF MIDDLE SCH, JEFFERSON CO BOE JEFF MID SCH
NO JEFFERSON MIDDLE SCH WWTP (JEFFERSON CNTY BD OF EDUCATION in KIMBERLY, AL)
National Pollutant Discharge Elimination System NON-MAJOR (Tracking pollutant discharge elimination systems) - permit Business SIC classification: ELEMENTARY AND SECONDARY SCHOOLS Alternative names: JEFF CO BOE NORTH JEFFERSON MS
ADOT BR 3734 101 (ALABAMA DEPARTMENT OF TRANSPOR in KIMBERLY, AL)
National Pollutant Discharge Elimination System NON-MAJOR (Tracking pollutant discharge elimination systems) - permit Business SIC classification: HIGHWAY AND STREET CONSTRUCTION, EXCEPT ELEVATED HIGHWAYS
PHARRIS LANE (WALKER COUNTY SWCDB in KIMBERLY, AL)
National Pollutant Discharge Elimination System NON-MAJOR (Tracking pollutant discharge elimination systems) - permit Business SIC classification: HEAVY CONSTRUCTION Alternative names: WALKER CO SWCDB PHARRIS LANE
PROMISE MANOR SD (G AND S DEVELOPMENT LLC in KIMBERLY, AL)
National Pollutant Discharge Elimination System NON-MAJOR (Tracking pollutant discharge elimination systems) - permit Business SIC classification: HEAVY CONSTRUCTION Alternative names: PROMISE MANOR SD G AND S DEV L
PROMISE MANOR SUBDIVISION (GAIUS GUTHRIE in KIMBERLY, AL)
National Pollutant Discharge Elimination System NON-MAJOR (Tracking pollutant discharge elimination systems) - permit Business SIC classification: HEAVY CONSTRUCTION Alternative names: PROMISE MANOR SD GAIUS GUTHRIE
ROLLING MEADOWS SECTOR 4 (TERRY WATSON in KIMBERLY, AL)
National Pollutant Discharge Elimination System NON-MAJOR (Tracking pollutant discharge elimination systems) - permit Business SIC classification: HEAVY CONSTRUCTION Alternative names: TERRY WATSON ROLLING MEADOWS
LIBERTY CROSSINGS (LIBERTY LAND DEVELOPMENT INC in KIMBERLY, AL)
National Pollutant Discharge Elimination System NON-MAJOR (Tracking pollutant discharge elimination systems) - permit Business SIC classification: HIGHWAY AND STREET CONSTRUCTION, EXCEPT ELEVATED HIGHWAYS Alternative names: LIBERTY LAND DEV LIBERTY CRSGS
Housing units lacking complete plumbing facilities: 1.8% Housing units lacking complete kitchen facilities: 3.9%
76.7%Electricity
21.4%Utility gas
2.0%Bottled, tank, or LP gas
Population in 1990: 1,045. Population change in the 1990s: +153 (+14.6%).
Place of birth for U.S.-born residents:
This state: 2,903
Northeast: 14
Midwest: 94
South: 277
West: 88
60% of the 35091 zip code residents lived in the same house 5 years ago. Out of people who lived in different houses, 80% lived in this county. Out of people who lived in different counties, 50% lived in Alabama.
96% of the 35091 zip code residents lived in the same house 1 year ago. Out of people who lived in different houses, 94% moved from this county.
Private vs. public school enrollment:
Students in private schools in grades 1 to 8 (elementary and middle school): 13
Here:
2.7%
Alabama:
14.7%
Students in private schools in grades 9 to 12 (high school):
Here:
0.0%
Alabama:
16.3%
Students in private undergraduate colleges: 22
Here:
44.7%
Alabama:
14.6%
Occupation by median earnings in the past 12 months ($)
115,713Computer and mathematical occupations
93,940Management occupations
92,365Arts, design, entertainment, sports, and media occupations
84,336Business and financial operations occupations
74,583Fire fighting and prevention, and other protective service workers including supervisors
74,484Community and social service occupations
Top industries in this zip code by the number of employees in 2005:
Construction: Commercial and Institutional Building Construction (10-19 employees: 1 establishment)
Administrative and Support and Waste Management and Remediation Services: Janitorial Services (5-9: 1)
Other Services (except Public Administration): General Automotive Repair (1-4: 1)
Construction: New Single-Family Housing Construction (except Operative Builders) (1-4: 1)
Administrative and Support and Waste Management and Remediation Services: Landscaping Services (1-4: 1)
Construction: Drywall and Insulation Contractors (1-4: 1)
Construction: Land Subdivision (1-4: 1)
Fatal accident statistics in 2010:
Fatal accident count: 1
Vehicles involved in fatal accidents: 1
Fatal accidents caused by drunken drivers: 0
Fatalities: 1
Persons involved in fatal accidents: 1
Pedestrians involved in fatal accidents: 0
Home Mortgage Disclosure Act Aggregated Statistics For Year 2009 (Based on 1 partial tract)
A) FHA, FSA/RHS & VA Home Purchase Loans
B) Conventional Home Purchase Loans
C) Refinancings
D) Home Improvement Loans
F) Non-occupant Loans on < 5 Family Dwellings (A B C & D)
G) Loans On Manufactured Home Dwelling (A B C & D)
Number
Average Value
Number
Average Value
Number
Average Value
Number
Average Value
Number
Average Value
Number
Average Value
LOANS ORIGINATED
4
$145,282
4
$122,785
15
$152,657
1
$64,440
1
$45,070
1
$36,030
APPLICATIONS APPROVED, NOT ACCEPTED
0
$0
0
$0
1
$128,660
0
$0
0
$0
0
$0
APPLICATIONS DENIED
1
$96,120
1
$72,340
4
$160,878
0
$0
0
$0
1
$51,050
APPLICATIONS WITHDRAWN
0
$0
1
$101,530
5
$191,472
0
$0
0
$0
0
$0
FILES CLOSED FOR INCOMPLETENESS
0
$0
0
$0
1
$121,400
0
$0
0
$0
0
$0
Aggregated Statistics For Year 2008 (Based on 1 partial tract)
A) FHA, FSA/RHS & VA Home Purchase Loans
B) Conventional Home Purchase Loans
C) Refinancings
D) Home Improvement Loans
F) Non-occupant Loans on < 5 Family Dwellings (A B C & D)
G) Loans On Manufactured Home Dwelling (A B C & D)
Number
Average Value
Number
Average Value
Number
Average Value
Number
Average Value
Number
Average Value
Number
Average Value
LOANS ORIGINATED
4
$151,408
5
$133,300
10
$133,165
1
$17,800
1
$69,140
1
$45,710
APPLICATIONS APPROVED, NOT ACCEPTED
0
$0
1
$66,430
1
$193,660
0
$0
0
$0
0
$0
APPLICATIONS DENIED
1
$113,140
1
$64,440
8
$141,456
2
$35,635
0
$0
1
$44,570
APPLICATIONS WITHDRAWN
0
$0
1
$57,960
3
$159,750
0
$0
0
$0
0
$0
FILES CLOSED FOR INCOMPLETENESS
0
$0
0
$0
1
$106,590
0
$0
0
$0
0
$0
Aggregated Statistics For Year 2007 (Based on 1 partial tract)
A) FHA, FSA/RHS & VA Home Purchase Loans
B) Conventional Home Purchase Loans
C) Refinancings
D) Home Improvement Loans
F) Non-occupant Loans on < 5 Family Dwellings (A B C & D)
G) Loans On Manufactured Home Dwelling (A B C & D)
Number
Average Value
Number
Average Value
Number
Average Value
Number
Average Value
Number
Average Value
Number
Average Value
LOANS ORIGINATED
1
$169,600
12
$137,090
11
$124,704
2
$39,340
1
$69,990
1
$75,040
APPLICATIONS APPROVED, NOT ACCEPTED
0
$0
1
$135,710
2
$140,870
0
$0
0
$0
0
$0
APPLICATIONS DENIED
0
$0
1
$154,360
7
$112,700
3
$48,723
0
$0
2
$53,295
APPLICATIONS WITHDRAWN
0
$0
1
$165,400
4
$139,942
1
$45,140
0
$0
0
$0
FILES CLOSED FOR INCOMPLETENESS
0
$0
1
$70,920
1
$204,340
0
$0
0
$0
0
$0
Aggregated Statistics For Year 2006 (Based on 1 partial tract)
A) FHA, FSA/RHS & VA Home Purchase Loans
B) Conventional Home Purchase Loans
C) Refinancings
D) Home Improvement Loans
F) Non-occupant Loans on < 5 Family Dwellings (A B C & D)
G) Loans On Manufactured Home Dwelling (A B C & D)
Number
Average Value
Number
Average Value
Number
Average Value
Number
Average Value
Number
Average Value
Number
Average Value
LOANS ORIGINATED
1
$153,580
18
$126,344
12
$114,994
2
$44,855
1
$66,070
1
$68,570
APPLICATIONS APPROVED, NOT ACCEPTED
0
$0
2
$113,065
2
$76,790
0
$0
0
$0
1
$37,880
APPLICATIONS DENIED
0
$0
4
$78,605
6
$130,367
2
$48,845
0
$0
2
$58,385
APPLICATIONS WITHDRAWN
0
$0
3
$86,200
5
$122,066
0
$0
0
$0
0
$0
FILES CLOSED FOR INCOMPLETENESS
0
$0
1
$82,160
2
$137,665
0
$0
0
$0
0
$0
Aggregated Statistics For Year 2005 (Based on 1 partial tract)
A) FHA, FSA/RHS & VA Home Purchase Loans
B) Conventional Home Purchase Loans
C) Refinancings
D) Home Improvement Loans
F) Non-occupant Loans on < 5 Family Dwellings (A B C & D)
G) Loans On Manufactured Home Dwelling (A B C & D)
Number
Average Value
Number
Average Value
Number
Average Value
Number
Average Value
Number
Average Value
Number
Average Value
LOANS ORIGINATED
1
$83,230
14
$118,375
10
$107,085
1
$40,580
1
$49,130
1
$77,180
APPLICATIONS APPROVED, NOT ACCEPTED
0
$0
2
$81,415
2
$68,710
0
$0
0
$0
1
$41,870
APPLICATIONS DENIED
0
$0
3
$76,517
8
$105,180
2
$51,800
0
$0
3
$58,740
APPLICATIONS WITHDRAWN
0
$0
2
$137,415
5
$130,424
1
$94,340
0
$0
0
$0
FILES CLOSED FOR INCOMPLETENESS
0
$0
0
$0
2
$123,245
0
$0
0
$0
0
$0
Aggregated Statistics For Year 2004 (Based on 1 partial tract)
A) FHA, FSA/RHS & VA Home Purchase Loans
B) Conventional Home Purchase Loans
C) Refinancings
D) Home Improvement Loans
F) Non-occupant Loans on < 5 Family Dwellings (A B C & D)
G) Loans On Manufactured Home Dwelling (A B C & D)
Number
Average Value
Number
Average Value
Number
Average Value
Number
Average Value
Number
Average Value
Number
Average Value
LOANS ORIGINATED
1
$100,180
11
$109,305
14
$108,941
2
$43,715
2
$71,095
2
$58,560
APPLICATIONS APPROVED, NOT ACCEPTED
0
$0
1
$72,770
3
$120,257
0
$0
0
$0
1
$54,400
APPLICATIONS DENIED
0
$0
3
$82,403
9
$103,453
2
$22,180
0
$0
3
$50,957
APPLICATIONS WITHDRAWN
0
$0
2
$96,225
4
$106,105
0
$0
0
$0
0
$0
FILES CLOSED FOR INCOMPLETENESS
0
$0
0
$0
3
$120,493
0
$0
0
$0
0
$0
Aggregated Statistics For Year 2003 (Based on 1 partial tract)
A) FHA, FSA/RHS & VA Home Purchase Loans
B) Conventional Home Purchase Loans
C) Refinancings
D) Home Improvement Loans
F) Non-occupant Loans on < 5 Family Dwellings (A B C & D)
Number
Average Value
Number
Average Value
Number
Average Value
Number
Average Value
Number
Average Value
LOANS ORIGINATED
2
$96,905
12
$100,730
26
$111,225
2
$24,210
1
$58,740
APPLICATIONS APPROVED, NOT ACCEPTED
0
$0
1
$90,350
5
$95,836
0
$0
0
$0
APPLICATIONS DENIED
0
$0
4
$59,932
10
$94,475
1
$23,710
0
$0
APPLICATIONS WITHDRAWN
0
$0
1
$93,980
5
$119,274
0
$0
0
$0
FILES CLOSED FOR INCOMPLETENESS
0
$0
0
$0
2
$79,565
0
$0
0
$0
Aggregated Statistics For Year 2002 (Based on 1 partial tract)
A) FHA, FSA/RHS & VA Home Purchase Loans
B) Conventional Home Purchase Loans
C) Refinancings
D) Home Improvement Loans
F) Non-occupant Loans on < 5 Family Dwellings (A B C & D)
Number
Average Value
Number
Average Value
Number
Average Value
Number
Average Value
Number
Average Value
LOANS ORIGINATED
1
$136,490
9
$97,093
19
$103,259
1
$32,040
1
$83,160
APPLICATIONS APPROVED, NOT ACCEPTED
0
$0
2
$32,715
2
$94,480
0
$0
0
$0
APPLICATIONS DENIED
0
$0
4
$36,508
7
$77,740
2
$21,465
0
$0
APPLICATIONS WITHDRAWN
0
$0
0
$0
5
$92,360
0
$0
0
$0
FILES CLOSED FOR INCOMPLETENESS
0
$0
0
$0
2
$91,955
0
$0
0
$0
Aggregated Statistics For Year 2001 (Based on 1 partial tract)
A) FHA, FSA/RHS & VA Home Purchase Loans
B) Conventional Home Purchase Loans
C) Refinancings
D) Home Improvement Loans
F) Non-occupant Loans on < 5 Family Dwellings (A B C & D)
Number
Average Value
Number
Average Value
Number
Average Value
Number
Average Value
Number
Average Value
LOANS ORIGINATED
1
$120,680
9
$92,963
16
$100,966
2
$13,100
1
$36,380
APPLICATIONS APPROVED, NOT ACCEPTED
0
$0
1
$64,150
2
$60,700
0
$0
0
$0
APPLICATIONS DENIED
0
$0
5
$39,800
6
$76,670
1
$3,920
0
$0
APPLICATIONS WITHDRAWN
0
$0
0
$0
3
$80,100
0
$0
0
$0
FILES CLOSED FOR INCOMPLETENESS
0
$0
0
$0
1
$67,430
0
$0
0
$0
Aggregated Statistics For Year 2000 (Based on 1 partial tract)
A) FHA, FSA/RHS & VA Home Purchase Loans
B) Conventional Home Purchase Loans
C) Refinancings
D) Home Improvement Loans
Number
Average Value
Number
Average Value
Number
Average Value
Number
Average Value
LOANS ORIGINATED
1
$143,330
10
$69,990
5
$72,324
2
$23,210
APPLICATIONS APPROVED, NOT ACCEPTED
0
$0
2
$46,350
1
$40,730
1
$18,160
APPLICATIONS DENIED
0
$0
8
$38,501
4
$57,655
1
$15,880
APPLICATIONS WITHDRAWN
0
$0
1
$73,830
2
$67,960
0
$0
FILES CLOSED FOR INCOMPLETENESS
0
$0
0
$0
2
$67,250
0
$0
Aggregated Statistics For Year 1999 (Based on 1 partial tract)
A) FHA, FSA/RHS & VA Home Purchase Loans
B) Conventional Home Purchase Loans
C) Refinancings
D) Home Improvement Loans
F) Non-occupant Loans on < 5 Family Dwellings (A B C & D)


 Nearest zip codes: 35116, 35180, 35071, 35172, 35119, 35126.


