Estimated zip code population in 2022: 3,399 Zip code population in 2010: 2,500 Zip code population in 2000: 2,092
Houses and condos: 1,282 Renter-occupied apartments: 225
% of renters here:
19%
State:
33%
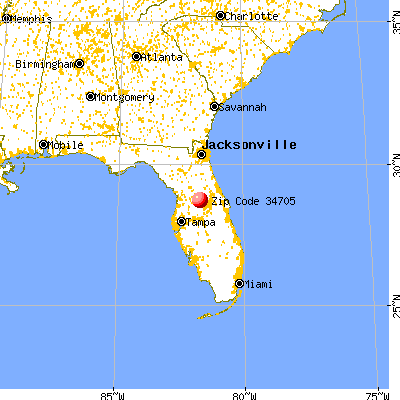
March 2022 cost of living index in zip code 34705: 89.7 (less than average, U.S. average is 100)
Land area: 17.8 sq. mi. Water area: 2.2 sq. mi.
Population density: 191 people per square mile
(very low).
OSM Map
General Map
Google Map
MSN Map
OSM Map
General Map
Google Map
MSN Map
OSM Map
General Map
Google Map
MSN Map
OSM Map
General Map
Google Map
MSN Map
Please wait while loading the map...
Real estate property taxes paid for housing units in 2022:
This zip code:
0.6% ($1,657)
Florida:
0.7% ($2,529)
Median real estate property taxes paid for housing units with mortgages in 2022: $1,854 (0.7%) Median real estate property taxes paid for housing units with no mortgage in 2022: $1,480 (0.7%)
Business Search- 14 Million verified businesses
Males: 1,784
(52.5%)
Females: 1,614
(47.5%)
For population 25 years and over in 34705:
High school or higher: 79.4%
Bachelor's degree or higher: 15.6%
Graduate or professional degree: 2.8%
Unemployed: 7.4%
Mean travel time to work (commute): 31.1 minutes
For population 15 years and over in 34705:
Never married: 35.1%
Now married: 49.4%
Separated: 0.0%
Widowed: 6.6%
Divorced: 8.9%
Zip code 34705 compared to state average:
Unemployed percentage above state average.
Black race population percentage significantly below state average.
Median age below state average.
Foreign-born population percentage significantly below state average.
Renting percentage below state average.
Length of stay since moving in significantly above state average.
Number of college students below state average.
Percentage of population with a bachelor's degree or higher significantly below state average.
Estimated median house/condo value in 2022: $259,092
34705:
$259,092
Florida:
$354,100
According to our research of Florida and other state lists, there were 4 registered sex offenders living in 34705 zip code as of May 24, 2024. The ratio of all residents to sex offenders in zip code 34705 is 686 to 1. The ratio of registered sex offenders to all residents in this zip code is near the state average.
Median resident age:
This zip code:
37.5 years
Florida median age:
42.7 years
Average household size:
This zip code:
2.9 people
Florida:
2.5 people
Averages for the 2020 tax year for zip code 34705, filed in 2021:
Average Adjusted Gross Income (AGI) in 2020: $50,106 (Individual Income Tax Returns)
Here:
$50,106
State:
$82,200
Salary/wage: $44,982 (reported on 83.0% of returns)
Here:
$44,982
State:
$58,347
(% of AGI for various income ranges: 1279.4% for AGIs below $25k, 3909.0% for AGIs $25k-50k, 6384.7% for AGIs $50k-75k, 8617.8% for AGIs $75k-100k, 23684.3% for AGIs $100k-200k)
Taxable interest for individuals: $557 (reported on 17.0% of returns)
This zip code:
$557
Florida:
$4,272
(% of AGI for various income ranges: 6.5% for AGIs below $25k, 10.3% for AGIs $25k-50k, 19.3% for AGIs $50k-75k, 64.3% for AGIs $100k-200k)
Ordinary dividends: $2,377 (reported on 9.6% of returns)
Here:
$2,377
State:
$15,863
(% of AGI for various income ranges: 17.1% for AGIs below $25k, 21.3% for AGIs $25k-50k, 61.3% for AGIs $50k-75k, 132.9% for AGIs $100k-200k)
Net capital gain/loss in AGI: +$15,623 (reported on 9.6% of returns)
Here:
+$15,623
State:
+$62,983
(% of AGI for various income ranges: 10.6% for AGIs below $25k, 31.9% for AGIs $25k-50k, 103.3% for AGIs $50k-75k, 2487.1% for AGIs $100k-200k)
Profit/loss from business: +$8,450 (reported on 14.8% of returns)
Here:
+$8,450
State:
+$9,719
(% of AGI for various income ranges: 178.8% for AGIs below $25k, 132.3% for AGIs $25k-50k, 36.0% for AGIs $50k-75k, 882.9% for AGIs $100k-200k)
Taxable individual retirement arrangement distribution: $14,900 (reported on 5.2% of returns)
34705:
$14,900
Florida:
$24,823
(% of AGI for various income ranges: 204.5% for AGIs $25k-50k, 454.4% for AGIs $75k-100k)
Total itemized deductions: $28,450 (reported on 3.0% of returns)
Here:
$28,450
State:
$45,393
(% of AGI for various income ranges: 1625.7% for AGIs $100k-200k)
Charity contributions: $11,200 (reported on 1.5% of returns)
Here:
$11,200
State:
$20,178
(% of AGI for various income ranges: 149.3% for AGIs $50k-75k)
Taxes paid: $6,400 (reported on 2.2% of returns)
34705:
$6,400
State:
$6,967
(% of AGI for various income ranges: 274.3% for AGIs $100k-200k)
Earned income credit: $2,346 (reported on 20.7% of returns)
Here:
$2,346
State:
$2,306
(% of AGI for various income ranges: 116.5% for AGIs below $25k, 84.2% for AGIs $25k-50k)
Percentage of individuals using paid preparers for their 2020 taxes: 91.1%
Here:
91%
State:
92%
(% for various income ranges: 89.4% for AGIs below $25k, 92.7% for AGIs $25k-50k, 90.5% for AGIs $50k-75k, 90.9% for AGIs $75k-100k, 92.3% for AGIs $100k-200k, 100.0% for AGIs over 200k)
Averages for the 2012 tax year for zip code 34705, filed in 2013:
Average Adjusted Gross Income (AGI) in 2012: $41,456 (Individual Income Tax Returns)
Here:
$41,456
State:
$60,316
Salary/wage: $35,701 (reported on 84.5% of returns)
Here:
$35,701
State:
$45,277
(% of AGI for various income ranges: 77.5% for AGIs below $25k, 83.8% for AGIs $25k-50k, 81.1% for AGIs $50k-75k, 80.0% for AGIs $75k-100k, 47.8% for AGIs $100k-200k)
Taxable interest for individuals: $1,000 (reported on 20.0% of returns)
This zip code:
$1,000
Florida:
$3,587
(% of AGI for various income ranges: 1.1% for AGIs below $25k, 0.5% for AGIs $25k-50k, 0.4% for AGIs $50k-75k, 0.1% for AGIs $75k-100k, 0.4% for AGIs $100k-200k)
Ordinary dividends: $2,217 (reported on 10.9% of returns)
Here:
$2,217
State:
$12,831
(% of AGI for various income ranges: 1.4% for AGIs below $25k, 0.5% for AGIs $50k-75k, 1.6% for AGIs $75k-100k)
Net capital gain/loss in AGI: +$6,560 (reported on 9.1% of returns)
Here:
+$6,560
State:
+$33,493
(% of AGI for various income ranges: 0.4% for AGIs below $25k, 0.1% for AGIs $50k-75k, 5.5% for AGIs $100k-200k)
Profit/loss from business: +$4,231 (reported on 14.5% of returns)
Here:
+$4,231
State:
+$10,012
(% of AGI for various income ranges: 7.2% for AGIs below $25k, 1.0% for AGIs $25k-50k, 0.9% for AGIs $75k-100k)
Taxable individual retirement arrangement distribution: $13,780 (reported on 9.1% of returns)
34705:
$13,780
Florida:
$21,544
(% of AGI for various income ranges: 2.8% for AGIs below $25k, 2.6% for AGIs $25k-50k, 12.2% for AGIs $75k-100k)
Total itemized deductions: $18,584 (26% of AGI, reported on 17.3% of returns)
Here:
$18,584
State:
$25,533
Here:
26.2% of AGI
State:
18.0% of AGI
(% of AGI for various income ranges: 6.1% for AGIs below $25k, 8.1% for AGIs $25k-50k, 7.7% for AGIs $50k-75k, 10.2% for AGIs $75k-100k, 6.8% for AGIs $100k-200k)
Charity contributions: $3,379 (reported on 12.7% of returns)
Here:
$3,379
State:
$5,698
(% of AGI for various income ranges: 0.9% for AGIs below $25k, 0.4% for AGIs $25k-50k, 1.3% for AGIs $50k-75k, 2.0% for AGIs $75k-100k, 0.9% for AGIs $100k-200k)
Taxes paid: $3,668 (reported on 17.3% of returns)
34705:
$3,668
State:
$6,203
(% of AGI for various income ranges: 1.1% for AGIs below $25k, 1.8% for AGIs $25k-50k, 1.3% for AGIs $50k-75k, 1.9% for AGIs $75k-100k, 1.5% for AGIs $100k-200k)
Earned income credit: $2,245 (reported on 26.4% of returns)
Here:
$2,245
State:
$2,372
(% of AGI for various income ranges: 7.0% for AGIs below $25k, 1.6% for AGIs $25k-50k)
Percentage of individuals using paid preparers for their 2012 taxes: 50.9%
Here:
51%
State:
54%
(% for various income ranges: 48.0% for AGIs below $25k, 53.3% for AGIs $25k-50k, 46.7% for AGIs $50k-75k, 55.6% for AGIs $75k-100k, 66.7% for AGIs $100k-200k)
Averages for the 2004 tax year for zip code 34705, filed in 2005:
Average Adjusted Gross Income (AGI) in 2004: $37,137 (Individual Income Tax Returns)
Here:
$37,137
State:
$50,523
Salary/wage: $31,992 (reported on 84.7% of returns)
Here:
$31,992
State:
$39,563
(% of AGI for various income ranges: 78.1% for AGIs below $10k, 80.3% for AGIs $10k-25k, 85.5% for AGIs $25k-50k, 83.7% for AGIs $50k-75k, 76.6% for AGIs $75k-100k, 43.7% for AGIs over 100k)
Taxable interest for individuals: $1,328 (reported on 29.2% of returns)
This zip code:
$1,328
Florida:
$3,211
(% of AGI for various income ranges: 2.0% for AGIs below $10k, 1.7% for AGIs $10k-25k, 0.6% for AGIs $25k-50k, 0.9% for AGIs $50k-75k, 0.8% for AGIs $75k-100k, 1.2% for AGIs over 100k)
Taxable dividends: $1,226 (reported on 13.9% of returns)
Here:
$1,226
State:
$6,129
(% of AGI for various income ranges: 3.1% for AGIs below $10k, 0.8% for AGIs $10k-25k, 0.1% for AGIs $25k-50k, 0.3% for AGIs $50k-75k, 0.3% for AGIs $75k-100k, 0.6% for AGIs over 100k)
Net capital gain/loss: +$11,139 (reported on 10.9% of returns)
Here:
+$11,139
State:
+$27,205
(% of AGI for various income ranges: 1.2% for AGIs below $10k, 0.0% for AGIs $10k-25k, 0.1% for AGIs $25k-50k, 1.2% for AGIs $50k-75k, 4.9% for AGIs $75k-100k, 9.7% for AGIs over 100k)
Profit/loss from business: +$7,382 (reported on 13.6% of returns)
Here:
+$7,382
State:
+$10,634
(% of AGI for various income ranges: 17.2% for AGIs below $10k, 5.0% for AGIs $10k-25k, 3.2% for AGIs $25k-50k, 2.9% for AGIs $50k-75k, 1.3% for AGIs $75k-100k)
Profit/loss from farming: +$222 (reported on 1.6% of returns)
Here:
+$222
State:
-$6,005
Total itemized deductions: $16,257 (23% of AGI, reported on 21.9% of returns)
Here:
$16,257
State:
$20,370
Here:
22.9% of AGI
State:
20.7% of AGI
(% of AGI for various income ranges: 9.4% for AGIs $10k-25k, 8.9% for AGIs $25k-50k, 11.6% for AGIs $50k-75k, 14.1% for AGIs $75k-100k, 7.4% for AGIs over 100k)
Charity contributions deductions: $2,595 (3% of AGI, reported on 17.0% of returns)
Here:
$2,595
State:
$4,064
Here:
3.4% of AGI
State:
3.8% of AGI
(% of AGI for various income ranges: 0.6% for AGIs $10k-25k, 1.1% for AGIs $25k-50k, 1.6% for AGIs $50k-75k, 1.8% for AGIs $75k-100k, 1.1% for AGIs over 100k)
Total tax: $5,126 (reported on 69.6% of returns)
34705:
$5,126
State:
$9,431
(% of AGI for various income ranges: 4.1% for AGIs below $10k, 3.4% for AGIs $10k-25k, 6.3% for AGIs $25k-50k, 8.6% for AGIs $50k-75k, 10.1% for AGIs $75k-100k, 18.2% for AGIs over 100k)
Earned income credit: $1,809 (reported on 21.1% of returns)
Here:
$1,809
State:
$1,808
Percentage of individuals using paid preparers for their 2004 taxes: 59.7%
Here:
60%
State:
60%
(% for various income ranges: 52.3% for AGIs below $10k, 60.2% for AGIs $10k-25k, 60.0% for AGIs $25k-50k, 61.9% for AGIs $50k-75k, 62.9% for AGIs $75k-100k, 76.6% for AGIs over 100k)
Household received Food Stamps/SNAP in the past 12 months: 197 Household did not receive Food Stamps/SNAP in the past 12 months: 993
Women who had a birth in the past 12 months: 29 (10 now married, 17 unmarried) Women who did not have a birth in the past 12 months: 760 (318 now married, 441 unmarried)
Housing units in zip code 34705 with a mortgage: 584 (3 second mortgage, 3 both second mortgage and home equity loan) Houses without a mortgage: 5
Median monthly owner costs for units with a mortgage: $1,430 Median monthly owner costs for units without a mortgage: $381
Residents with income below the poverty level in 2022:
This zip code:
12.3%
Whole state:
12.7%
Residents with income below 50% of the poverty level in 2022:
This zip code:
9.9%
Whole state:
6.6%
Median number of rooms in houses and condos:
Here:
5.8
State:
5.9
Median number of rooms in apartments:
Here:
5.4
State:
4.2
Notable locations in this zip code not listed on our city pages
Notable locations in zip code 34705: Astatula Volunteer Fire Department Station 77 (A), Astatula Police Department (B), Astatula Town Hall (C). Display/hide their locations on the map
Lakes: Little Lake Harris (A), Birdeye Lake (B), Summerall Lake (C), Saddle Bag Lake (D), Birdseye Lake (E), Lake Melton (F). Display/hide their locations on the map
Size of family households: 359 2-persons, 296 3-persons, 99 4-persons, 79 5-persons, 41 6-persons, 53 7-or-more-persons
Size of nonfamily households: 195 1-person, 63 2-persons, 13 5-persons
451 married couples with children.
150 single-parent households (99 men, 51 women).
79.9% of residents of 34705 zip code speak English at home.
19.0% of residents speak Spanish at home (53% very well, 14% well, 20% not well, 13% not at all).
0.4% of residents speak other Indo-European language at home (71% very well, 29% not well).
0.2% of residents speak Asian or Pacific Island language at home (100% very well).
Foreign born population: 261 (7.7%) (31.4% of them are naturalized citizens)
This zip code:
7.7%
Whole state:
21.7%
72%Honduras
4%Croatia
4%Uruguay
2%Netherlands
2%Singapore
2%France
1%Bolivia
42%American
7%English
6%European
3%Irish
3%Italian
2%German
1%Scotch-Irish
Year of entry for the foreign-born population
992010 or later
692000 to 2009
1071990 to 1999
66Before 1990
Facilities with environmental interests located in this zip code:
ASTATULA ELEMENTARY SCHOOL (13925 FLORIDA AVENUE in ASTATULA, FL)
(National Center for Education Statistics) - STATE ID-0271 Organizations: LAKE COUNTY SCHOOL DISTRICT (SCHOOL DISTRICT)
AEROSPACE RECYCLING (28014 US HWY 561 in ASTATULA, FL)
(Resource Conservation and Recovery Act (tracking hazardous waste)) Organizations: NON NOTIFIER (CONTACT/OWNER)
MACK CONCRETE INDUSTRIES (23902 CR 561 S in ASTATULA, FL)
CIRCLE K #7416 (13512 GEORGIA AVE in ASTATULA, FL)
(Resource Conservation and Recovery Act (tracking hazardous waste)) Organizations: STEVE BELIN, COMPLIANCE MGR (CONTACT/OWNER)
CITRUS FARMS ESTATES (END OF VAN BUREN ST BEHIND ELE in ASTATULA, FL)
National Pollutant Discharge Elimination System NON-MAJOR (Tracking pollutant discharge elimination systems) - permit Organizations: RICHARD DANCKAERT (CONTACT/OWNER)
CITRUS FARMS ESTATES PHASE 2 ( in ASTATULA, FL)
National Pollutant Discharge Elimination System NON-MAJOR (Tracking pollutant discharge elimination systems) - permit Organizations: RICHARD DANCKAERT (CONTACT/OWNER)
ROBERT YEAGER PROPERTY (15930 CR 48 in ASTATULA, FL)
Small Quantity Generators, between 100 kg and 1000 kg of hazardous waste/month (Resource Conservation and Recovery Act (tracking hazardous waste)) - notification Organizations: NON NOTIFIED (CONTACT/OWNER)
Housing units lacking complete plumbing facilities: 1.5% Housing units lacking complete kitchen facilities: 1.6%
99.5%Electricity
0.6%No fuel used
Population in 1990: 1,831. Population change in the 1990s: +261 (+14.3%).
Place of birth for U.S.-born residents:
This state: 1,879
Northeast: 319
Midwest: 378
South: 343
West: 104
62% of the 34705 zip code residents lived in the same house 5 years ago. Out of people who lived in different houses, 45% lived in this county. Out of people who lived in different counties, 50% lived in Florida.
93% of the 34705 zip code residents lived in the same house 1 year ago. Out of people who lived in different houses, 43% moved from this county. Out of people who lived in different houses, 47% moved from different county within same state. Out of people who lived in different houses, 11% moved from different state.
Private vs. public school enrollment:
Students in private schools in grades 1 to 8 (elementary and middle school): 20
Here:
8.0%
Florida:
15.8%
Students in private schools in grades 9 to 12 (high school): 147
Here:
39.4%
Florida:
12.9%
Students in private undergraduate colleges: 14
Here:
18.6%
Florida:
23.6%
Occupation by median earnings in the past 12 months ($)
58,945Management occupations
57,400Installation, maintenance, and repair occupations
54,886Material moving occupations
52,593Production occupations
50,698Education, training, and library occupations
39,630Sales and related occupations
Top industries in this zip code by the number of employees in 2005:
Administrative and Support and Waste Management and Remediation Services: Office Administrative Services (500-999 employees: 1 establishment)
Construction: New Single-Family Housing Construction (except Operative Builders) (20-49: 1, 5-9: 1)
Other Services (except Public Administration): Commercial and Industrial Machinery and Equipment (except Automotive and Electronic) Repair and Maintenance (5-9: 3, 1-4: 1)
Construction: Framing Contractors (10-19: 1)
Construction: Structural Steel and Precast Concrete Contractors (10-19: 1)
Professional, Scientific, and Technical Services: Title Abstract and Settlement Offices (5-9: 1)
Health Care and Social Assistance: Child and Youth Services (5-9: 1)
Fatal accident statistics in 2014:
Fatal accident count: 1
Vehicles involved in fatal accidents: 2
Fatal accidents caused by drunken drivers: 0
Fatalities: 1
Persons involved in fatal accidents: 2
Pedestrians involved in fatal accidents: 0
Home Mortgage Disclosure Act Aggregated Statistics For Year 2009 (Based on 2 partial tracts)
A) FHA, FSA/RHS & VA Home Purchase Loans
B) Conventional Home Purchase Loans
C) Refinancings
D) Home Improvement Loans
F) Non-occupant Loans on < 5 Family Dwellings (A B C & D)
G) Loans On Manufactured Home Dwelling (A B C & D)
Number
Average Value
Number
Average Value
Number
Average Value
Number
Average Value
Number
Average Value
Number
Average Value
LOANS ORIGINATED
18
$109,578
15
$153,822
77
$186,283
3
$155,663
9
$127,370
9
$85,169
APPLICATIONS APPROVED, NOT ACCEPTED
0
$0
2
$137,250
6
$268,743
3
$28,773
1
$181,270
3
$88,047
APPLICATIONS DENIED
3
$134,370
8
$534,969
44
$266,847
3
$39,133
1
$345,280
8
$97,218
APPLICATIONS WITHDRAWN
0
$0
6
$176,237
23
$209,607
1
$25,900
3
$118,833
4
$108,548
FILES CLOSED FOR INCOMPLETENESS
1
$102,720
0
$0
5
$146,398
0
$0
0
$0
1
$113,080
Aggregated Statistics For Year 2008 (Based on 2 partial tracts)
A) FHA, FSA/RHS & VA Home Purchase Loans
B) Conventional Home Purchase Loans
C) Refinancings
D) Home Improvement Loans
F) Non-occupant Loans on < 5 Family Dwellings (A B C & D)
G) Loans On Manufactured Home Dwelling (A B C & D)
Number
Average Value
Number
Average Value
Number
Average Value
Number
Average Value
Number
Average Value
Number
Average Value
LOANS ORIGINATED
11
$160,241
30
$241,149
82
$194,062
6
$72,940
6
$191,055
18
$112,552
APPLICATIONS APPROVED, NOT ACCEPTED
0
$0
7
$145,634
13
$214,605
0
$0
0
$0
3
$77,113
APPLICATIONS DENIED
3
$194,220
6
$218,677
55
$269,742
11
$125,635
1
$138,110
14
$110,489
APPLICATIONS WITHDRAWN
2
$100,565
2
$103,585
23
$185,250
0
$0
3
$351,323
3
$96,680
FILES CLOSED FOR INCOMPLETENESS
2
$108,330
0
$0
9
$277,471
1
$340,960
1
$340,960
1
$123,440
Aggregated Statistics For Year 2007 (Based on 2 partial tracts)
A) FHA, FSA/RHS & VA Home Purchase Loans
B) Conventional Home Purchase Loans
C) Refinancings
D) Home Improvement Loans
F) Non-occupant Loans on < 5 Family Dwellings (A B C & D)
G) Loans On Manufactured Home Dwelling (A B C & D)
Number
Average Value
Number
Average Value
Number
Average Value
Number
Average Value
Number
Average Value
Number
Average Value
LOANS ORIGINATED
15
$150,312
91
$246,458
148
$194,366
23
$85,457
23
$206,905
40
$128,940
APPLICATIONS APPROVED, NOT ACCEPTED
0
$0
15
$227,079
28
$191,538
4
$46,612
3
$150,773
4
$150,198
APPLICATIONS DENIED
1
$148,470
13
$222,374
100
$240,790
13
$77,422
8
$290,251
17
$104,092
APPLICATIONS WITHDRAWN
1
$107,900
6
$252,198
38
$257,506
5
$122,056
5
$127,580
3
$111,927
FILES CLOSED FOR INCOMPLETENESS
0
$0
6
$273,203
13
$210,355
1
$107,900
3
$201,990
2
$149,765
Aggregated Statistics For Year 2006 (Based on 2 partial tracts)
A) FHA, FSA/RHS & VA Home Purchase Loans
B) Conventional Home Purchase Loans
C) Refinancings
D) Home Improvement Loans
F) Non-occupant Loans on < 5 Family Dwellings (A B C & D)
G) Loans On Manufactured Home Dwelling (A B C & D)
Number
Average Value
Number
Average Value
Number
Average Value
Number
Average Value
Number
Average Value
Number
Average Value
LOANS ORIGINATED
12
$171,418
173
$193,716
157
$172,887
19
$83,548
55
$183,924
47
$119,269
APPLICATIONS APPROVED, NOT ACCEPTED
0
$0
14
$206,613
24
$146,456
9
$81,812
3
$143,580
5
$97,886
APPLICATIONS DENIED
0
$0
40
$187,206
99
$180,261
23
$56,220
13
$210,156
29
$106,173
APPLICATIONS WITHDRAWN
0
$0
20
$197,284
72
$188,094
5
$93,052
8
$169,402
5
$92,018
FILES CLOSED FOR INCOMPLETENESS
0
$0
3
$239,107
9
$167,844
0
$0
2
$132,070
0
$0
Aggregated Statistics For Year 2005 (Based on 2 partial tracts)
A) FHA, FSA/RHS & VA Home Purchase Loans
B) Conventional Home Purchase Loans
C) Refinancings
D) Home Improvement Loans
F) Non-occupant Loans on < 5 Family Dwellings (A B C & D)
G) Loans On Manufactured Home Dwelling (A B C & D)
Number
Average Value
Number
Average Value
Number
Average Value
Number
Average Value
Number
Average Value
Number
Average Value
LOANS ORIGINATED
3
$134,370
210
$175,431
148
$164,632
23
$80,540
57
$160,328
50
$109,160
APPLICATIONS APPROVED, NOT ACCEPTED
0
$0
20
$169,058
33
$176,328
2
$86,750
6
$146,600
7
$108,270
APPLICATIONS DENIED
1
$90,640
37
$195,223
79
$185,009
18
$102,146
9
$227,981
25
$105,966
APPLICATIONS WITHDRAWN
1
$149,330
19
$165,053
71
$170,087
8
$88,478
5
$131,380
13
$78,618
FILES CLOSED FOR INCOMPLETENESS
0
$0
3
$246,300
9
$196,618
2
$66,900
0
$0
0
$0
Aggregated Statistics For Year 2004 (Based on 2 partial tracts)
A) FHA, FSA/RHS & VA Home Purchase Loans
B) Conventional Home Purchase Loans
C) Refinancings
D) Home Improvement Loans
F) Non-occupant Loans on < 5 Family Dwellings (A B C & D)
G) Loans On Manufactured Home Dwelling (A B C & D)
Number
Average Value
Number
Average Value
Number
Average Value
Number
Average Value
Number
Average Value
Number
Average Value
LOANS ORIGINATED
15
$124,876
195
$132,464
98
$162,431
9
$37,981
40
$129,674
34
$75,073
APPLICATIONS APPROVED, NOT ACCEPTED
1
$122,570
22
$164,244
19
$151,605
2
$24,600
3
$166,597
7
$93,966
APPLICATIONS DENIED
2
$108,765
31
$110,685
70
$147,632
16
$58,050
3
$140,127
26
$78,485
APPLICATIONS WITHDRAWN
0
$0
10
$153,045
55
$144,672
3
$16,977
0
$0
7
$95,569
FILES CLOSED FOR INCOMPLETENESS
0
$0
1
$74,240
9
$119,026
0
$0
1
$74,240
0
$0
Aggregated Statistics For Year 2003 (Based on 2 partial tracts)
A) FHA, FSA/RHS & VA Home Purchase Loans
B) Conventional Home Purchase Loans
C) Refinancings
D) Home Improvement Loans
F) Non-occupant Loans on < 5 Family Dwellings (A B C & D)
Number
Average Value
Number
Average Value
Number
Average Value
Number
Average Value
Number
Average Value
LOANS ORIGINATED
23
$116,307
116
$132,754
171
$126,027
7
$54,011
15
$142,773
APPLICATIONS APPROVED, NOT ACCEPTED
0
$0
9
$164,200
22
$140,113
3
$31,077
2
$66,035
APPLICATIONS DENIED
3
$124,877
28
$102,782
58
$142,666
7
$20,347
3
$51,503
APPLICATIONS WITHDRAWN
0
$0
6
$108,332
52
$115,204
1
$77,690
0
$0
FILES CLOSED FOR INCOMPLETENESS
1
$90,640
0
$0
6
$115,237
0
$0
0
$0
Aggregated Statistics For Year 2002 (Based on 2 partial tracts)
A) FHA, FSA/RHS & VA Home Purchase Loans
B) Conventional Home Purchase Loans
C) Refinancings
D) Home Improvement Loans
F) Non-occupant Loans on < 5 Family Dwellings (A B C & D)
Number
Average Value
Number
Average Value
Number
Average Value
Number
Average Value
Number
Average Value
LOANS ORIGINATED
21
$104,406
69
$143,892
126
$128,014
9
$50,641
12
$109,842
APPLICATIONS APPROVED, NOT ACCEPTED
1
$110,490
10
$94,175
32
$132,852
6
$62,870
2
$93,225
APPLICATIONS DENIED
3
$73,660
19
$93,180
58
$113,288
11
$91,499
3
$98,403
APPLICATIONS WITHDRAWN
1
$89,770
6
$173,935
44
$132,501
1
$25,900
4
$50,712
FILES CLOSED FOR INCOMPLETENESS
0
$0
1
$35,390
7
$118,751
0
$0
0
$0
Aggregated Statistics For Year 2001 (Based on 2 partial tracts)
A) FHA, FSA/RHS & VA Home Purchase Loans
B) Conventional Home Purchase Loans
C) Refinancings
D) Home Improvement Loans
F) Non-occupant Loans on < 5 Family Dwellings (A B C & D)
Number
Average Value
Number
Average Value
Number
Average Value
Number
Average Value
Number
Average Value
LOANS ORIGINATED
19
$92,953
77
$112,485
93
$114,137
15
$39,822
8
$66,466
APPLICATIONS APPROVED, NOT ACCEPTED
2
$141,565
13
$96,479
19
$86,320
3
$24,457
1
$31,940
APPLICATIONS DENIED
1
$81,140
16
$116,909
59
$85,018
14
$28,362
1
$75,960
APPLICATIONS WITHDRAWN
3
$86,897
4
$102,505
28
$105,465
1
$64,740
2
$60,425
FILES CLOSED FOR INCOMPLETENESS
0
$0
2
$99,270
5
$93,744
1
$129,480
0
$0
Aggregated Statistics For Year 2000 (Based on 2 partial tracts)
A) FHA, FSA/RHS & VA Home Purchase Loans
B) Conventional Home Purchase Loans
C) Refinancings
D) Home Improvement Loans
F) Non-occupant Loans on < 5 Family Dwellings (A B C & D)
Number
Average Value
Number
Average Value
Number
Average Value
Number
Average Value
Number
Average Value
LOANS ORIGINATED
11
$86,163
73
$118,294
33
$76,145
16
$15,915
9
$95,528
APPLICATIONS APPROVED, NOT ACCEPTED
1
$75,100
11
$87,497
13
$57,369
6
$25,177
1
$41,430
APPLICATIONS DENIED
1
$34,530
30
$70,984
34
$53,493
9
$34,144
3
$44,887
APPLICATIONS WITHDRAWN
1
$65,600
5
$223,914
15
$63,129
3
$44,887
2
$67,760
FILES CLOSED FOR INCOMPLETENESS
1
$67,330
2
$98,405
3
$125,163
2
$20,285
0
$0
Aggregated Statistics For Year 1999 (Based on 1 partial tract)
A) FHA, FSA/RHS & VA Home Purchase Loans
B) Conventional Home Purchase Loans
C) Refinancings
D) Home Improvement Loans
F) Non-occupant Loans on < 5 Family Dwellings (A B C & D)
Detailed PMIC statistics for the following Tracts:0310.00
2002 - 2018 National Fire Incident Reporting System (NFIRS) incidents
According to the data from the years 2002 - 2018 the average number of fires per year is 9. The highest number of fires - 20 took place in 2006, and the least - 4 in 2018. The data has a decreasing trend.
When looking into fire subcategories, the most reports belonged to: Outside Fires (57.3%), and Structure Fires (25.5%).
Fire incident types reported to NFIRS in Zip Code 34705


+$222
-$6,005
 Nearest zip codes: 34715, 32778, 34737, 32757, 34797, 34756.


 According to the data from the years 2002 - 2018 the average number of fires per year is 9. The highest number of fires - 20 took place in 2006, and the least - 4 in 2018. The data has a decreasing trend.
 When looking into fire subcategories, the most reports belonged to: Outside Fires (57.3%), and Structure Fires (25.5%).