Estimated zip code population in 2022: 19,891 Zip code population in 2010: 16,315 Zip code population in 2000: 14,014
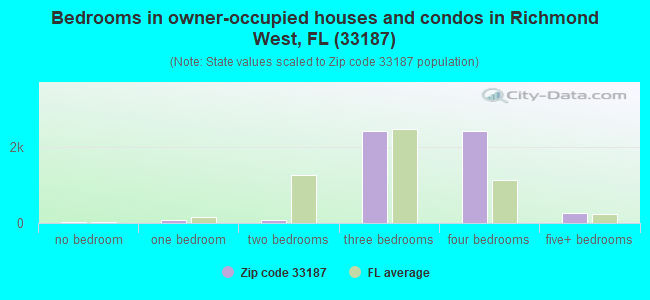
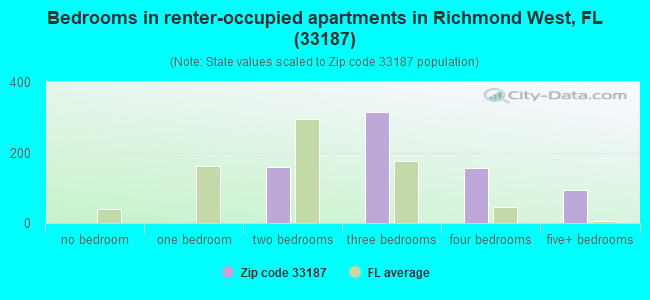
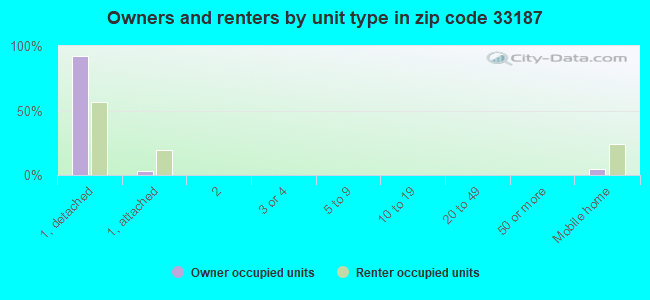
Houses and condos: 6,033 Renter-occupied apartments: 735
% of renters here:
12%
State:
33%
March 2022 cost of living index in zip code 33187: 104.9 (near average, U.S. average is 100)
Land area: 39.6 sq. mi. Water area: 0.2 sq. mi.
Population density: 503 people per square mile
(low).
OSM Map
General Map
Google Map
MSN Map
OSM Map
General Map
Google Map
MSN Map
OSM Map
General Map
Google Map
MSN Map
OSM Map
General Map
Google Map
MSN Map
Please wait while loading the map...
Real estate property taxes paid for housing units in 2022:
This zip code:
0.7% ($4,145)
Florida:
0.7% ($2,529)
Median real estate property taxes paid for housing units with mortgages in 2022: $4,336 (0.8%) Median real estate property taxes paid for housing units with no mortgage in 2022: $3,612 (0.7%)
Business Search- 14 Million verified businesses
Males: 9,703
(48.8%)
Females: 10,187
(51.2%)
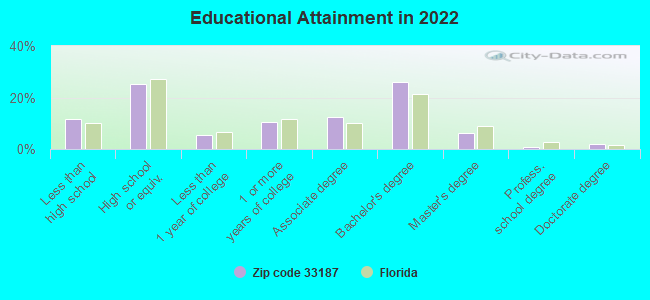
For population 25 years and over in 33187:
High school or higher: 88.4%
Bachelor's degree or higher: 35.0%
Graduate or professional degree: 8.9%
Unemployed: 2.8%
Mean travel time to work (commute): 46.2 minutes
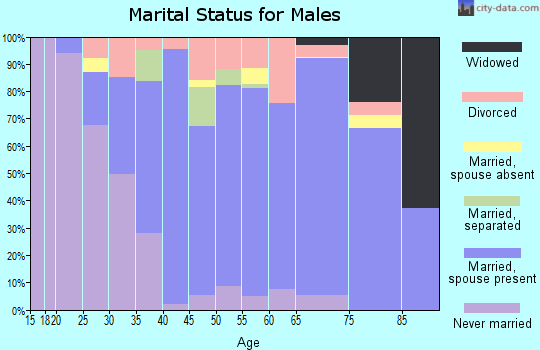
For population 15 years and over in 33187:
Never married: 30.1%
Now married: 51.2%
Separated: 1.7%
Widowed: 5.9%
Divorced: 11.2%
Zip code 33187 compared to state average:
Median household income above state average.
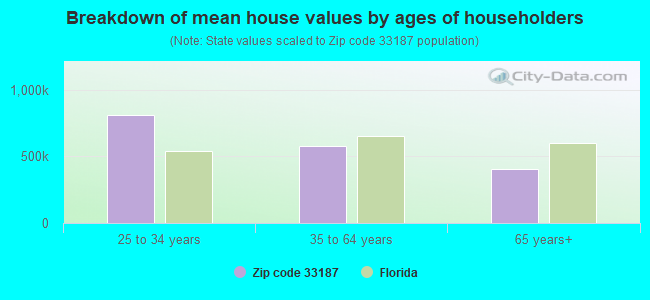
Median house value above state average.
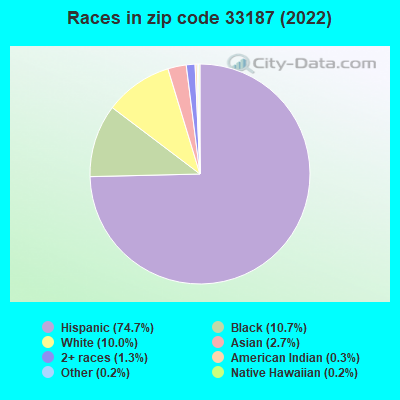
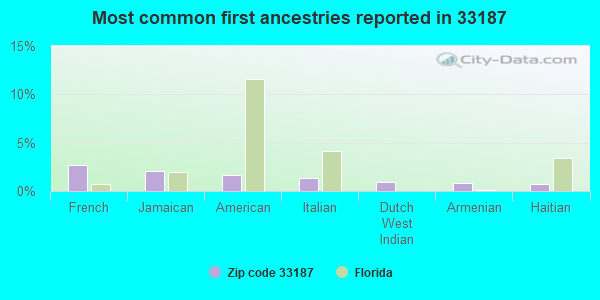
Hispanic race population percentage above state average.
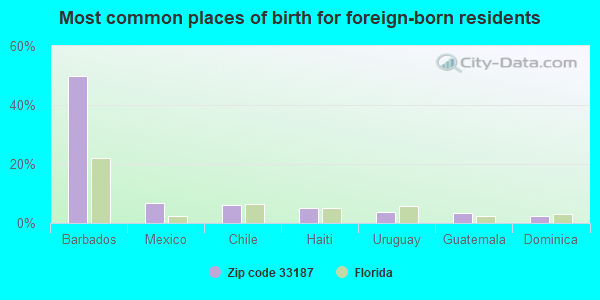
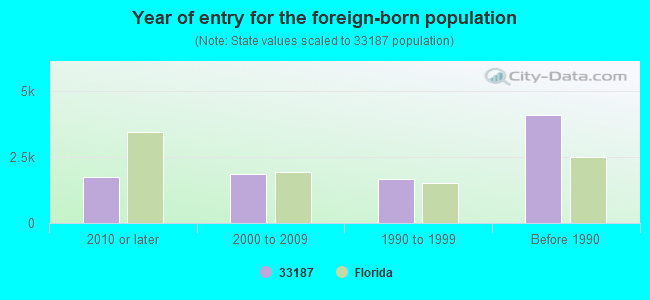
Foreign-born population percentage significantly above state average.
Renting percentage significantly below state average.
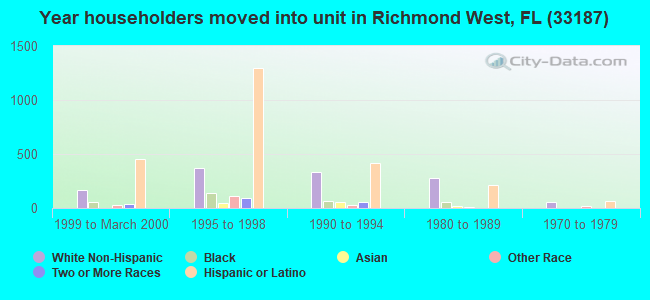
Length of stay since moving in significantly above state average.
Averages for the 2020 tax year for zip code 33187, filed in 2021:
Average Adjusted Gross Income (AGI) in 2020: $58,859 (Individual Income Tax Returns)
Here:
$58,859
State:
$82,200
Salary/wage: $55,561 (reported on 76.4% of returns)
Here:
$55,561
State:
$58,347
(% of AGI for various income ranges: 1114.8% for AGIs below $25k, 3814.0% for AGIs $25k-50k, 7113.8% for AGIs $50k-75k, 10017.8% for AGIs $75k-100k, 18780.8% for AGIs $100k-200k, 59085.8% for AGIs over 200k)
Taxable interest for individuals: $1,203 (reported on 15.3% of returns)
This zip code:
$1,203
Florida:
$4,272
(% of AGI for various income ranges: 7.5% for AGIs below $25k, 9.0% for AGIs $25k-50k, 21.0% for AGIs $50k-75k, 21.4% for AGIs $75k-100k, 67.3% for AGIs $100k-200k, 555.8% for AGIs over 200k)
Ordinary dividends: $7,354 (reported on 8.0% of returns)
Here:
$7,354
State:
$15,863
(% of AGI for various income ranges: 7.8% for AGIs below $25k, 14.9% for AGIs $25k-50k, 29.5% for AGIs $50k-75k, 26.2% for AGIs $75k-100k, 125.7% for AGIs $100k-200k, 3455.0% for AGIs over 200k)
Net capital gain/loss in AGI: +$33,949 (reported on 9.7% of returns)
Here:
+$33,949
State:
+$62,983
(% of AGI for various income ranges: 1.9% for AGIs below $25k, 33.6% for AGIs $25k-50k, 58.5% for AGIs $50k-75k, 146.2% for AGIs $75k-100k, 412.7% for AGIs $100k-200k, 23717.5% for AGIs over 200k)
Profit/loss from business: +$6,800 (reported on 37.3% of returns)
Here:
+$6,800
State:
+$9,719
(% of AGI for various income ranges: 379.5% for AGIs below $25k, 230.7% for AGIs $25k-50k, 266.0% for AGIs $50k-75k, 223.4% for AGIs $75k-100k, 382.4% for AGIs $100k-200k, 2907.5% for AGIs over 200k)
Taxable individual retirement arrangement distribution: $19,150 (reported on 2.7% of returns)
33187:
$19,150
Florida:
$24,823
(% of AGI for various income ranges: 13.1% for AGIs below $25k, 31.0% for AGIs $25k-50k, 80.8% for AGIs $50k-75k, 194.8% for AGIs $75k-100k, 229.6% for AGIs $100k-200k, 772.5% for AGIs over 200k)
Total itemized deductions: $30,244 (reported on 11.0% of returns)
Here:
$30,244
State:
$45,393
(% of AGI for various income ranges: 51.4% for AGIs below $25k, 281.3% for AGIs $25k-50k, 594.4% for AGIs $50k-75k, 901.8% for AGIs $75k-100k, 1501.0% for AGIs $100k-200k, 4852.5% for AGIs over 200k)
Charity contributions: $6,595 (reported on 8.2% of returns)
Here:
$6,595
State:
$20,178
(% of AGI for various income ranges: 2.1% for AGIs below $25k, 31.3% for AGIs $25k-50k, 87.9% for AGIs $50k-75k, 123.8% for AGIs $75k-100k, 239.6% for AGIs $100k-200k, 1382.5% for AGIs over 200k)
Taxes paid: $7,975 (reported on 10.8% of returns)
33187:
$7,975
State:
$6,967
(% of AGI for various income ranges: 9.9% for AGIs below $25k, 79.2% for AGIs $25k-50k, 166.8% for AGIs $50k-75k, 230.4% for AGIs $75k-100k, 382.0% for AGIs $100k-200k, 1215.0% for AGIs over 200k)
Earned income credit: $2,169 (reported on 25.8% of returns)
Here:
$2,169
State:
$2,306
(% of AGI for various income ranges: 139.8% for AGIs below $25k, 75.0% for AGIs $25k-50k)
Percentage of individuals using paid preparers for their 2020 taxes: 89.0%
Here:
89%
State:
92%
(% for various income ranges: 87.7% for AGIs below $25k, 89.7% for AGIs $25k-50k, 90.7% for AGIs $50k-75k, 88.7% for AGIs $75k-100k, 90.2% for AGIs $100k-200k, 91.4% for AGIs over 200k)
Averages for the 2012 tax year for zip code 33187, filed in 2013:
Average Adjusted Gross Income (AGI) in 2012: $47,000 (Individual Income Tax Returns)
Here:
$47,000
State:
$60,316
Salary/wage: $45,707 (reported on 81.8% of returns)
Here:
$45,707
State:
$45,277
(% of AGI for various income ranges: 72.3% for AGIs below $25k, 86.7% for AGIs $25k-50k, 87.8% for AGIs $50k-75k, 85.6% for AGIs $75k-100k, 85.7% for AGIs $100k-200k, 58.8% for AGIs over 200k)
Taxable interest for individuals: $953 (reported on 18.9% of returns)
This zip code:
$953
Florida:
$3,587
(% of AGI for various income ranges: 0.3% for AGIs below $25k, 0.4% for AGIs $25k-50k, 0.4% for AGIs $50k-75k, 0.3% for AGIs $75k-100k, 0.3% for AGIs $100k-200k, 0.6% for AGIs over 200k)
Ordinary dividends: $4,090 (reported on 7.6% of returns)
Here:
$4,090
State:
$12,831
(% of AGI for various income ranges: 1.3% for AGIs below $25k, 0.6% for AGIs $25k-50k, 0.4% for AGIs $50k-75k, 0.2% for AGIs $75k-100k, 0.5% for AGIs $100k-200k, 1.0% for AGIs over 200k)
Net capital gain/loss in AGI: +$11,100 (reported on 6.1% of returns)
Here:
+$11,100
State:
+$33,493
(% of AGI for various income ranges: 0.2% for AGIs $25k-50k, 0.3% for AGIs $50k-75k, 0.8% for AGIs $75k-100k, 0.3% for AGIs $100k-200k, 6.6% for AGIs over 200k)
Profit/loss from business: +$7,820 (reported on 28.0% of returns)
Here:
+$7,820
State:
+$10,012
(% of AGI for various income ranges: 20.6% for AGIs below $25k, 4.4% for AGIs $25k-50k, 2.0% for AGIs $50k-75k, 2.0% for AGIs $75k-100k, 1.5% for AGIs $100k-200k, 1.8% for AGIs over 200k)
Taxable individual retirement arrangement distribution: $20,892 (reported on 3.1% of returns)
33187:
$20,892
Florida:
$21,544
(% of AGI for various income ranges: 0.8% for AGIs below $25k, 1.5% for AGIs $25k-50k, 1.0% for AGIs $50k-75k, 0.7% for AGIs $75k-100k, 3.1% for AGIs $100k-200k)
Self-employment retirement plans: $4,267 (reported on 0.4% of returns)
33187:
$4,267
Florida:
$20,611
Total itemized deductions: $25,077 (28% of AGI, reported on 30.7% of returns)
Here:
$25,077
State:
$25,533
Here:
27.9% of AGI
State:
18.0% of AGI
(% of AGI for various income ranges: 8.2% for AGIs below $25k, 17.7% for AGIs $25k-50k, 18.7% for AGIs $50k-75k, 18.3% for AGIs $75k-100k, 13.6% for AGIs $100k-200k, 21.9% for AGIs over 200k)
Charity contributions: $4,135 (reported on 24.6% of returns)
Here:
$4,135
State:
$5,698
(% of AGI for various income ranges: 0.4% for AGIs below $25k, 1.5% for AGIs $25k-50k, 1.8% for AGIs $50k-75k, 1.8% for AGIs $75k-100k, 1.4% for AGIs $100k-200k, 5.8% for AGIs over 200k)
Taxes paid: $4,396 (reported on 29.6% of returns)
33187:
$4,396
State:
$6,203
(% of AGI for various income ranges: 1.5% for AGIs below $25k, 3.2% for AGIs $25k-50k, 3.7% for AGIs $50k-75k, 3.7% for AGIs $75k-100k, 3.1% for AGIs $100k-200k, 1.6% for AGIs over 200k)
Earned income credit: $2,367 (reported on 29.1% of returns)
Here:
$2,367
State:
$2,372
(% of AGI for various income ranges: 9.4% for AGIs below $25k, 1.4% for AGIs $25k-50k)
Percentage of individuals using paid preparers for their 2012 taxes: 67.3%
Here:
67%
State:
54%
(% for various income ranges: 65.6% for AGIs below $25k, 70.6% for AGIs $25k-50k, 68.2% for AGIs $50k-75k, 66.7% for AGIs $75k-100k, 66.7% for AGIs $100k-200k, 73.3% for AGIs over 200k)
Averages for the 2004 tax year for zip code 33187, filed in 2005:
Average Adjusted Gross Income (AGI) in 2004: $45,048 (Individual Income Tax Returns)
Here:
$45,048
State:
$50,523
Salary/wage: $43,162 (reported on 85.2% of returns)
Here:
$43,162
State:
$39,563
(% of AGI for various income ranges: 91.1% for AGIs below $10k, 79.5% for AGIs $10k-25k, 89.3% for AGIs $25k-50k, 89.0% for AGIs $50k-75k, 88.7% for AGIs $75k-100k, 70.6% for AGIs over 100k)
Taxable interest for individuals: $1,067 (reported on 32.7% of returns)
This zip code:
$1,067
Florida:
$3,211
(% of AGI for various income ranges: 2.5% for AGIs below $10k, 0.8% for AGIs $10k-25k, 0.9% for AGIs $25k-50k, 0.6% for AGIs $50k-75k, 0.3% for AGIs $75k-100k, 0.9% for AGIs over 100k)
Taxable dividends: $1,366 (reported on 11.0% of returns)
Here:
$1,366
State:
$6,129
(% of AGI for various income ranges: 1.5% for AGIs below $10k, 0.2% for AGIs $10k-25k, 0.2% for AGIs $25k-50k, 0.3% for AGIs $50k-75k, 0.4% for AGIs $75k-100k, 0.4% for AGIs over 100k)
Net capital gain/loss: +$20,362 (reported on 9.9% of returns)
Here:
+$20,362
State:
+$27,205
(% of AGI for various income ranges: -1.5% for AGIs below $10k, 0.4% for AGIs $10k-25k, 0.4% for AGIs $25k-50k, 0.9% for AGIs $50k-75k, 1.6% for AGIs $75k-100k, 11.1% for AGIs over 100k)
Profit/loss from business: +$9,457 (reported on 24.5% of returns)
Here:
+$9,457
State:
+$10,634
(% of AGI for various income ranges: 31.3% for AGIs below $10k, 16.6% for AGIs $10k-25k, 4.9% for AGIs $25k-50k, 2.9% for AGIs $50k-75k, 1.4% for AGIs $75k-100k, 3.8% for AGIs over 100k)
IRA payment deduction: $3,254 (reported on 2.3% of returns)
33187:
$3,254
Florida:
$3,082
(% of AGI for various income ranges: 0.2% for AGIs $10k-25k, 0.2% for AGIs $25k-50k, 0.2% for AGIs $50k-75k, 0.2% for AGIs $75k-100k, 0.1% for AGIs over 100k)
Total itemized deductions: $20,173 (28% of AGI, reported on 44.9% of returns)
Here:
$20,173
State:
$20,370
Here:
28.3% of AGI
State:
20.7% of AGI
(% of AGI for various income ranges: 13.6% for AGIs below $10k, 18.1% for AGIs $10k-25k, 27.3% for AGIs $25k-50k, 25.0% for AGIs $50k-75k, 20.4% for AGIs $75k-100k, 14.6% for AGIs over 100k)
Charity contributions deductions: $2,429 (3% of AGI, reported on 38.5% of returns)
Here:
$2,429
State:
$4,064
Here:
3.2% of AGI
State:
3.8% of AGI
(% of AGI for various income ranges: 0.4% for AGIs below $10k, 0.9% for AGIs $10k-25k, 2.0% for AGIs $25k-50k, 2.2% for AGIs $50k-75k, 2.2% for AGIs $75k-100k, 2.4% for AGIs over 100k)
Total tax: $5,953 (reported on 74.3% of returns)
33187:
$5,953
State:
$9,431
(% of AGI for various income ranges: 6.9% for AGIs below $10k, 4.6% for AGIs $10k-25k, 4.9% for AGIs $25k-50k, 6.8% for AGIs $50k-75k, 8.9% for AGIs $75k-100k, 15.9% for AGIs over 100k)
Earned income credit: $1,838 (reported on 22.7% of returns)
Here:
$1,838
State:
$1,808
Percentage of individuals using paid preparers for their 2004 taxes: 68.9%
Here:
69%
State:
60%
(% for various income ranges: 64.3% for AGIs below $10k, 71.5% for AGIs $10k-25k, 69.7% for AGIs $25k-50k, 68.2% for AGIs $50k-75k, 68.9% for AGIs $75k-100k, 70.4% for AGIs over 100k)
Likely homosexual households (counted as self-reported same-sex unmarried-partner households)
Lesbian couples: 0.5% of all households
Gay men: 0.6% of all households
Household received Food Stamps/SNAP in the past 12 months: 800 Household did not receive Food Stamps/SNAP in the past 12 months: 5,171
Women who had a birth in the past 12 months: 211 (106 now married, 100 unmarried) Women who did not have a birth in the past 12 months: 4,492 (1,937 now married, 2,555 unmarried)
Housing units in zip code 33187 with a mortgage: 3,401 (139 second mortgage, 29 home equity loan, 76 both second mortgage and home equity loan) Median monthly owner costs for units with a mortgage: $2,646 Median monthly owner costs for units without a mortgage: $796
Residents with income below the poverty level in 2022:
This zip code:
6.5%
Whole state:
12.7%
Residents with income below 50% of the poverty level in 2022:
This zip code:
4.9%
Whole state:
6.6%
Median number of rooms in houses and condos:
Here:
6.1
State:
5.9
Median number of rooms in apartments:
Here:
5.2
State:
4.2
Notable locations in this zip code not listed on our city pages
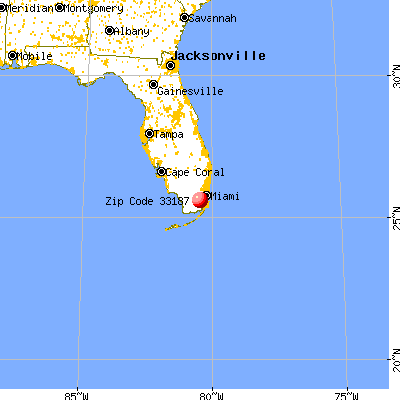
Notable locations in zip code 33187: Quail Roost Plaza (A), Miami-Everglades Kampground (B), Miller Plaza (C), Rem Learning Center (D), Carratala Day Care Center (E), Everglades National Park East Everglades Station (F). Display/hide their locations on the map
In group quarters: 64 (-1 institutionalized population)
Size of family households: 1,066 2-persons, 1,130 3-persons, 1,392 4-persons, 907 5-persons, 484 6-persons, 117 7-or-more-persons
Size of nonfamily households: 611 1-person, 258 2-persons
2,371 married couples with children.
766 single-parent households (259 men, 507 women).
25.2% of residents of 33187 zip code speak English at home.
72.0% of residents speak Spanish at home (59% very well, 15% well, 16% not well, 10% not at all).
1.3% of residents speak other Indo-European language at home (86% very well, 14% well).
0.9% of residents speak Asian or Pacific Island language at home (24% very well, 67% well, 9% not well).
0.4% of residents speak other language at home (74% very well, 26% well).
Foreign born population: 9,413 (47.3%) (70.4% of them are naturalized citizens)
Facilities with environmental interests located in this zip code:
8.5 MILE (16650 SW 205TH AVE in MIAMI, FL)
Large Quantity Generators, more that 1000 kg of hazardous waste/month (Resource Conservation and Recovery Act (tracking hazardous waste)) Organizations: USACE (CONTACT/OWNER)
Housing units lacking complete plumbing facilities: 0.2% Housing units lacking complete kitchen facilities: 0.2%
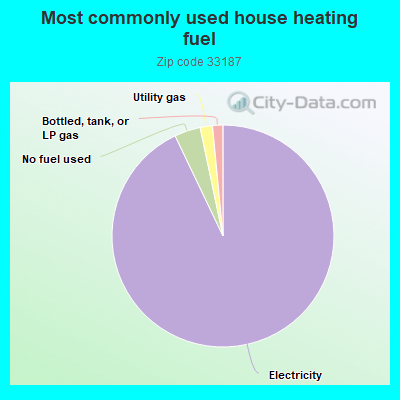
93.0%Electricity
3.8%No fuel used
1.8%Utility gas
1.5%Bottled, tank, or LP gas
Population in 1990: 6,882. Population change in the 1990s: +7,132 (+103.6%).
Place of birth for U.S.-born residents:
This state: 7,509
Northeast: 1,647
Midwest: 441
South: 401
West: 119
48% of the 33187 zip code residents lived in the same house 5 years ago. Out of people who lived in different houses, 83% lived in this county. Out of people who lived in different counties, 50% lived in Florida.
94% of the 33187 zip code residents lived in the same house 1 year ago. Out of people who lived in different houses, 72% moved from this county. Out of people who lived in different houses, 9% moved from different county within same state. Out of people who lived in different houses, 17% moved from abroad.
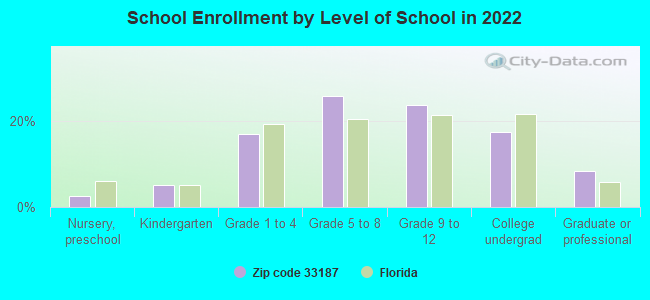
Private vs. public school enrollment:
Students in private schools in grades 1 to 8 (elementary and middle school): 313
Here:
15.4%
Florida:
15.8%
Students in private schools in grades 9 to 12 (high school): 111
Here:
9.9%
Florida:
12.9%
Students in private undergraduate colleges: 137
Here:
16.8%
Florida:
23.6%
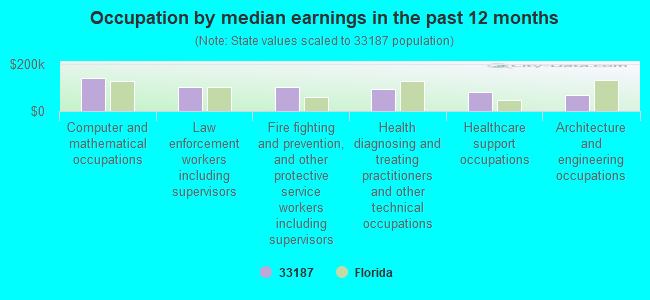
Occupation by median earnings in the past 12 months ($)
140,528Computer and mathematical occupations
102,870Law enforcement workers including supervisors
101,255Fire fighting and prevention, and other protective service workers including supervisors
93,440Health diagnosing and treating practitioners and other technical occupations
81,289Healthcare support occupations
69,006Architecture and engineering occupations
Companies with federal contracts located in this zip code:
WORLD WIDE PRIMATES INC (16450 SW 180TH ST in MIAMI, FL; small business) : $362,855 in 5 contractsfrom 2002 to 2006
Contracts for Live Animals, Not Raised for Food, Laboratory Equipment and Supplies by Army, Centers for Disease Control and Prevention, National Institutes of Health Signed by year:2000: $0; 2001: $0; 2002: $42,000; 2003: $0; 2004: $37,145; 2005: $282,120; 2006: $1,590.
Biggest contracts:
$232,500 with Army for Live Animals, Not Raised for Food. Signed on 2005-08-12. Completion date: 2005-10-17.
$49,620 with Centers for Disease Control and Prevention for Live Animals, Not Raised for Food. Signed on 2005-12-22. Completion date: 2006-03-20.
$42,000 with National Institutes of Health for Live Animals, Not Raised for Food. Taking place in MT. Signed on 2002-08-15. Completion date: 2002-11-15.
$37,145 with National Institutes of Health for Live Animals, Not Raised for Food. Signed on 2004-04-15. Completion date: 2004-05-05.
REM LEARNING CENTER SOUTH, INC (16400 SW 147 AVE in MIAMI, FL; small business) : $16,224 in 14 contractsfrom 2003 to 2005
Contracts for Other Social Services, Operation of Government-Owned Facilities -- Other Educational Buildings by Army Signed by year:2000: $0; 2001: $0; 2002: $0; 2003: $2,978; 2004: $9,335; 2005: $3,911; 2006: $0.
Biggest contracts:
$2,520 with Army for Other Social Services. Signed on 2004-06-25. Completion date: 2004-05-28.
$1,736, same as above.Signed on 2004-03-11. Completion date: 2004-02-28.
$1,470, same as above.Signed on 2004-04-28. Completion date: 2004-04-04.
$1,404 with Army for Operation of Government-Owned Facilities -- Other Educational Buildings. Signed on 2005-09-14. Completion date: 2005-08-05.
Top industries in this zip code by the number of employees in 2005:
Health Care and Social Assistance: Home Health Care Services (20-49: 1, 1-4: 1)
Other Services (except Public Administration): Other Similar Organizations (except Business, Professional, Labor, and Political Organizations) (20-49: 1)
People in group quarters in 2010:
19 people in nursing facilities/skilled-nursing facilities
13 people in group homes intended for adults
People in group quarters in 2000:
7 people in nursing homes
2 people in agriculture workers' dormitories on farms
Fatal accident statistics in 2014:
Fatal accident count: 5
Vehicles involved in fatal accidents: 7
Fatal accidents caused by drunken drivers: 0
Fatalities: 5
Persons involved in fatal accidents: 11
Pedestrians involved in fatal accidents: 1
Fatal accident statistics in 2013:
Fatal accident count: 3
Vehicles involved in fatal accidents: 7
Fatal accidents caused by drunken drivers: 1
Fatalities: 3
Persons involved in fatal accidents: 9
Pedestrians involved in fatal accidents: 0
Home Mortgage Disclosure Act Aggregated Statistics For Year 2009 (Based on 2 full and 8 partial tracts)
A) FHA, FSA/RHS & VA Home Purchase Loans
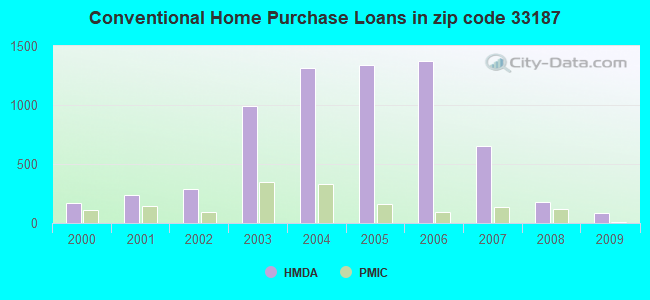
B) Conventional Home Purchase Loans
C) Refinancings
D) Home Improvement Loans
F) Non-occupant Loans on < 5 Family Dwellings (A B C & D)
G) Loans On Manufactured Home Dwelling (A B C & D)
Number
Average Value
Number
Average Value
Number
Average Value
Number
Average Value
Number
Average Value
Number
Average Value
LOANS ORIGINATED
145
$208,242
85
$193,616
212
$199,872
13
$70,295
18
$185,584
0
$0
APPLICATIONS APPROVED, NOT ACCEPTED
6
$209,715
21
$227,347
33
$201,145
1
$6,620
3
$257,967
1
$76,060
APPLICATIONS DENIED
47
$232,860
49
$219,345
221
$232,396
20
$132,788
15
$282,245
3
$79,867
APPLICATIONS WITHDRAWN
15
$217,195
16
$245,269
115
$227,581
9
$133,326
2
$173,720
0
$0
FILES CLOSED FOR INCOMPLETENESS
7
$221,647
6
$189,493
24
$256,369
2
$225,575
2
$206,605
0
$0
Aggregated Statistics For Year 2008 (Based on 2 full and 8 partial tracts)
A) FHA, FSA/RHS & VA Home Purchase Loans
B) Conventional Home Purchase Loans
C) Refinancings
D) Home Improvement Loans
F) Non-occupant Loans on < 5 Family Dwellings (A B C & D)
G) Loans On Manufactured Home Dwelling (A B C & D)
Number
Average Value
Number
Average Value
Number
Average Value
Number
Average Value
Number
Average Value
Number
Average Value
LOANS ORIGINATED
58
$254,298
178
$264,791
409
$249,005
28
$113,281
35
$269,988
5
$51,414
APPLICATIONS APPROVED, NOT ACCEPTED
8
$215,058
46
$290,678
109
$263,979
22
$56,847
5
$201,238
2
$102,645
APPLICATIONS DENIED
37
$208,705
157
$324,460
475
$292,228
80
$141,363
47
$250,841
12
$76,998
APPLICATIONS WITHDRAWN
14
$235,626
44
$243,473
148
$267,618
6
$198,372
11
$210,265
0
$0
FILES CLOSED FOR INCOMPLETENESS
4
$219,880
27
$277,747
61
$288,231
5
$183,430
5
$206,010
1
$87,470
Aggregated Statistics For Year 2007 (Based on 2 full and 8 partial tracts)
A) FHA, FSA/RHS & VA Home Purchase Loans
B) Conventional Home Purchase Loans
C) Refinancings
D) Home Improvement Loans
F) Non-occupant Loans on < 5 Family Dwellings (A B C & D)
G) Loans On Manufactured Home Dwelling (A B C & D)
Number
Average Value
Number
Average Value
Number
Average Value
Number
Average Value
Number
Average Value
Number
Average Value
LOANS ORIGINATED
14
$197,589
649
$300,585
1,055
$273,060
122
$167,058
47
$293,123
17
$89,754
APPLICATIONS APPROVED, NOT ACCEPTED
1
$254,850
161
$279,504
238
$301,753
33
$132,928
15
$373,868
5
$77,166
APPLICATIONS DENIED
3
$133,880
418
$319,227
814
$323,296
133
$156,216
46
$270,550
17
$89,601
APPLICATIONS WITHDRAWN
2
$181,570
93
$298,320
300
$290,852
47
$215,459
14
$329,254
3
$112,697
FILES CLOSED FOR INCOMPLETENESS
0
$0
27
$293,013
121
$302,922
15
$147,186
6
$327,215
1
$95,560
Aggregated Statistics For Year 2006 (Based on 2 full and 8 partial tracts)
A) FHA, FSA/RHS & VA Home Purchase Loans
B) Conventional Home Purchase Loans
C) Refinancings
D) Home Improvement Loans
F) Non-occupant Loans on < 5 Family Dwellings (A B C & D)
G) Loans On Manufactured Home Dwelling (A B C & D)
Number
Average Value
Number
Average Value
Number
Average Value
Number
Average Value
Number
Average Value
Number
Average Value
LOANS ORIGINATED
15
$159,547
1,369
$243,117
1,476
$254,568
173
$170,992
97
$263,115
13
$103,528
APPLICATIONS APPROVED, NOT ACCEPTED
0
$0
213
$244,849
280
$247,213
42
$108,263
20
$253,480
6
$65,787
APPLICATIONS DENIED
6
$194,972
581
$265,881
770
$270,893
147
$131,568
59
$273,936
15
$101,885
APPLICATIONS WITHDRAWN
4
$106,252
234
$245,993
504
$275,678
54
$156,616
30
$223,796
4
$111,005
FILES CLOSED FOR INCOMPLETENESS
0
$0
60
$251,592
172
$267,460
8
$155,139
6
$272,127
1
$79,870
Aggregated Statistics For Year 2005 (Based on 2 full and 8 partial tracts)
A) FHA, FSA/RHS & VA Home Purchase Loans
B) Conventional Home Purchase Loans
C) Refinancings
D) Home Improvement Loans
F) Non-occupant Loans on < 5 Family Dwellings (A B C & D)
G) Loans On Manufactured Home Dwelling (A B C & D)
Number
Average Value
Number
Average Value
Number
Average Value
Number
Average Value
Number
Average Value
Number
Average Value
LOANS ORIGINATED
5
$208,416
1,343
$214,700
1,570
$225,209
161
$134,727
122
$223,841
6
$74,322
APPLICATIONS APPROVED, NOT ACCEPTED
0
$0
140
$231,636
262
$215,277
42
$83,910
23
$228,263
0
$0
APPLICATIONS DENIED
6
$170,905
469
$214,856
784
$226,010
174
$85,404
64
$197,416
24
$72,648
APPLICATIONS WITHDRAWN
0
$0
235
$205,769
555
$221,379
79
$171,568
44
$198,869
7
$108,053
FILES CLOSED FOR INCOMPLETENESS
0
$0
67
$247,677
371
$220,522
11
$135,310
9
$345,533
2
$87,235
Aggregated Statistics For Year 2004 (Based on 2 full and 8 partial tracts)
A) FHA, FSA/RHS & VA Home Purchase Loans
B) Conventional Home Purchase Loans
C) Refinancings
D) Home Improvement Loans
F) Non-occupant Loans on < 5 Family Dwellings (A B C & D)
G) Loans On Manufactured Home Dwelling (A B C & D)
Number
Average Value
Number
Average Value
Number
Average Value
Number
Average Value
Number
Average Value
Number
Average Value
LOANS ORIGINATED
23
$177,630
1,311
$204,166
1,694
$180,336
151
$107,282
134
$201,203
10
$114,235
APPLICATIONS APPROVED, NOT ACCEPTED
0
$0
240
$213,721
284
$179,907
28
$75,311
20
$188,712
7
$58,726
APPLICATIONS DENIED
5
$118,028
308
$200,389
970
$184,108
183
$64,771
42
$178,773
22
$52,793
APPLICATIONS WITHDRAWN
2
$142,195
203
$204,407
546
$182,821
52
$122,804
24
$178,847
3
$69,090
FILES CLOSED FOR INCOMPLETENESS
2
$119,940
41
$213,632
344
$188,186
17
$88,559
3
$186,427
1
$65,130
Aggregated Statistics For Year 2003 (Based on 2 full and 8 partial tracts)
A) FHA, FSA/RHS & VA Home Purchase Loans
B) Conventional Home Purchase Loans
C) Refinancings
D) Home Improvement Loans
F) Non-occupant Loans on < 5 Family Dwellings (A B C & D)
Number
Average Value
Number
Average Value
Number
Average Value
Number
Average Value
Number
Average Value
LOANS ORIGINATED
43
$159,642
993
$177,343
2,577
$150,365
55
$48,255
84
$155,835
APPLICATIONS APPROVED, NOT ACCEPTED
3
$172,407
146
$180,764
415
$143,541
33
$29,921
19
$177,601
APPLICATIONS DENIED
11
$169,586
227
$169,332
1,086
$157,272
101
$38,315
36
$158,211
APPLICATIONS WITHDRAWN
1
$121,080
125
$189,593
634
$151,379
14
$51,261
20
$159,019
FILES CLOSED FOR INCOMPLETENESS
4
$155,995
37
$220,175
140
$156,351
8
$35,340
8
$160,296
Aggregated Statistics For Year 2002 (Based on 4 partial tracts)
A) FHA, FSA/RHS & VA Home Purchase Loans
B) Conventional Home Purchase Loans
C) Refinancings
D) Home Improvement Loans
F) Non-occupant Loans on < 5 Family Dwellings (A B C & D)
Number
Average Value
Number
Average Value
Number
Average Value
Number
Average Value
Number
Average Value
LOANS ORIGINATED
23
$104,375
288
$158,469
265
$155,176
11
$82,045
22
$142,035
APPLICATIONS APPROVED, NOT ACCEPTED
0
$0
45
$140,449
58
$148,638
4
$18,205
9
$104,903
APPLICATIONS DENIED
7
$89,536
58
$144,923
172
$125,939
18
$21,614
10
$94,053
APPLICATIONS WITHDRAWN
1
$50,870
26
$166,917
88
$140,569
2
$80,185
1
$117,420
FILES CLOSED FOR INCOMPLETENESS
0
$0
3
$169,710
22
$158,067
0
$0
0
$0
Aggregated Statistics For Year 2001 (Based on 4 partial tracts)
A) FHA, FSA/RHS & VA Home Purchase Loans
B) Conventional Home Purchase Loans
C) Refinancings
D) Home Improvement Loans
F) Non-occupant Loans on < 5 Family Dwellings (A B C & D)
Number
Average Value
Number
Average Value
Number
Average Value
Number
Average Value
Number
Average Value
LOANS ORIGINATED
27
$106,121
237
$138,207
194
$143,059
16
$26,426
19
$158,534
APPLICATIONS APPROVED, NOT ACCEPTED
2
$97,575
32
$154,144
44
$152,029
4
$21,878
1
$286,590
APPLICATIONS DENIED
7
$129,330
60
$137,183
154
$127,903
25
$26,282
5
$94,236
APPLICATIONS WITHDRAWN
2
$61,565
25
$130,397
63
$108,189
5
$61,576
1
$359,880
FILES CLOSED FOR INCOMPLETENESS
2
$63,530
10
$145,289
28
$124,880
4
$29,060
0
$0
Aggregated Statistics For Year 2000 (Based on 4 partial tracts)
A) FHA, FSA/RHS & VA Home Purchase Loans
B) Conventional Home Purchase Loans
C) Refinancings
D) Home Improvement Loans
F) Non-occupant Loans on < 5 Family Dwellings (A B C & D)
2008 - 2018 National Fire Incident Reporting System (NFIRS) incidents
Based on the data from the years 2008 - 2018 the average number of fires per year is 134. The highest number of fire incidents - 180 took place in 2012, and the least - 88 in 2015. The data has a decreasing trend.
When looking into fire subcategories, the most incidents belonged to: Outside Fires (72.8%), and Mobile Property/Vehicle Fires (13.9%).
Fire incident types reported to NFIRS in Zip Code 33187


 Nearest zip codes: 33170, 33196, 33031, 33177, 33030, 33186.
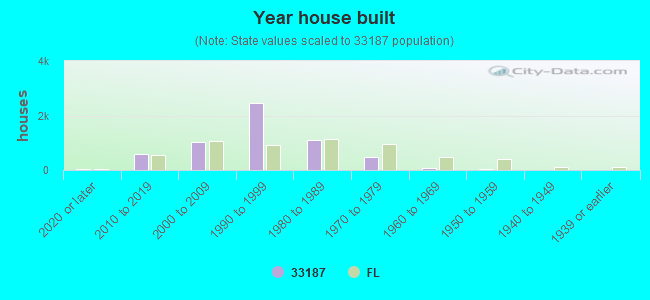


 Based on the data from the years 2008 - 2018 the average number of fires per year is 134. The highest number of fire incidents - 180 took place in 2012, and the least - 88 in 2015. The data has a decreasing trend.
 When looking into fire subcategories, the most incidents belonged to: Outside Fires (72.8%), and Mobile Property/Vehicle Fires (13.9%).