Estimated zip code population in 2022: 690 Zip code population in 2010: 1,003 Zip code population in 2000: 1,126
Houses and condos: 380 Renter-occupied apartments: 136
% of renters here:
51%
State:
28%
March 2022 cost of living index in zip code 29828: 87.2 (less than average, U.S. average is 100)
Land area: 0.7 sq. mi. Water area: 0.0 sq. mi.
Population density: 1,024 people per square mile
(low).
OSM Map
General Map
Google Map
MSN Map
OSM Map
General Map
Google Map
MSN Map
OSM Map
General Map
Google Map
MSN Map
OSM Map
General Map
Google Map
MSN Map
Please wait while loading the map...
Real estate property taxes paid for housing units in 2022:
This zip code:
0.8% ($506)
South Carolina:
0.5% ($1,185)
Median real estate property taxes paid for housing units with mortgages in 2022: $720 (0.6%) Median real estate property taxes paid for housing units with no mortgage in 2022: $286 (0.4%)
Business Search- 14 Million verified businesses
Males: 328
(47.6%)
Females: 361
(52.4%)
For population 25 years and over in 29828:
High school or higher: 74.6%
Bachelor's degree or higher: 7.1%
Graduate or professional degree: 0.2%
Unemployed: 14.5%
Mean travel time to work (commute): 19.5 minutes
For population 15 years and over in 29828:
Never married: 30.7%
Now married: 36.3%
Separated: 9.6%
Widowed: 6.0%
Divorced: 17.4%
Zip code 29828 compared to state average:
Median household income below state average.
Median house value significantly below state average.
Unemployed percentage significantly above state average.
Hispanic race population percentage below state average.
Median age above state average.
Foreign-born population percentage below state average.
Renting percentage above state average.
Length of stay since moving in significantly above state average.
Number of rooms per house below state average.
House age above state average.
Number of college students significantly below state average.
Percentage of population with a bachelor's degree or higher significantly below state average.
Estimated median house/condo value in 2022: $66,771
29828:
$66,771
South Carolina:
$254,600
Median resident age:
This zip code:
46.0 years
South Carolina median age:
40.5 years
Average household size:
This zip code:
2.5 people
South Carolina:
2.4 people
Averages for the 2020 tax year for zip code 29828, filed in 2021:
Average Adjusted Gross Income (AGI) in 2020: $35,070 (Individual Income Tax Returns)
Here:
$35,070
State:
$65,754
Salary/wage: $32,232 (reported on 83.8% of returns)
Here:
$32,232
State:
$52,566
(% of AGI for various income ranges: 1067.1% for AGIs below $25k, 3280.0% for AGIs $25k-50k, 5870.0% for AGIs $50k-75k, 11753.3% for AGIs $75k-100k)
Taxable interest for individuals: $120 (reported on 13.5% of returns)
This zip code:
$120
South Carolina:
$1,749
(% of AGI for various income ranges: 2.1% for AGIs below $25k, 7.5% for AGIs $50k-75k)
Profit/loss from business: +$7,525 (reported on 10.8% of returns)
Here:
+$7,525
State:
+$11,253
(% of AGI for various income ranges: 215.0% for AGIs below $25k)
Earned income credit: $2,960 (reported on 27.0% of returns)
Here:
$2,960
State:
$2,397
(% of AGI for various income ranges: 156.4% for AGIs below $25k, 96.2% for AGIs $25k-50k)
Percentage of individuals using paid preparers for their 2020 taxes: 100.0%
Here:
100%
State:
93%
(% for various income ranges: 100.0% for AGIs below $25k, 100.0% for AGIs $25k-50k, 100.0% for AGIs $50k-75k, 100.0% for AGIs $75k-100k)
Averages for the 2012 tax year for zip code 29828, filed in 2013:
Average Adjusted Gross Income (AGI) in 2012: $29,909 (Individual Income Tax Returns)
Here:
$29,909
State:
$51,133
Salary/wage: $27,600 (reported on 84.1% of returns)
Here:
$27,600
State:
$42,173
(% of AGI for various income ranges: 73.4% for AGIs below $25k, 77.9% for AGIs $25k-50k, 81.4% for AGIs $50k-75k, 78.1% for AGIs $75k-100k)
Taxable interest for individuals: $160 (reported on 11.4% of returns)
This zip code:
$160
South Carolina:
$1,468
(% of AGI for various income ranges: 0.1% for AGIs below $25k)
Ordinary dividends: $233 (reported on 6.8% of returns)
Here:
$233
State:
$6,511
Profit/loss from business: +$6,257 (reported on 15.9% of returns)
Here:
+$6,257
State:
+$10,167
(% of AGI for various income ranges: 11.3% for AGIs below $25k, 1.5% for AGIs $25k-50k)
Taxable individual retirement arrangement distribution: $10,567 (reported on 6.8% of returns)
29828:
$10,567
South Carolina:
$17,019
Total itemized deductions: $14,225 (22% of AGI, reported on 9.1% of returns)
Here:
$14,225
State:
$22,890
Here:
22.2% of AGI
State:
21.4% of AGI
Charity contributions: $2,900 (reported on 6.8% of returns)
Here:
$2,900
State:
$5,169
Taxes paid: $4,275 (reported on 9.1% of returns)
29828:
$4,275
State:
$7,644
Earned income credit: $2,747 (reported on 38.6% of returns)
Here:
$2,747
State:
$2,418
(% of AGI for various income ranges: 11.7% for AGIs below $25k, 2.0% for AGIs $25k-50k)
Percentage of individuals using paid preparers for their 2012 taxes: 65.9%
Here:
66%
State:
57%
(% for various income ranges: 61.5% for AGIs below $25k, 60.0% for AGIs $25k-50k, 80.0% for AGIs $50k-75k, 100.0% for AGIs $75k-100k)
Averages for the 2004 tax year for zip code 29828, filed in 2005:
Average Adjusted Gross Income (AGI) in 2004: $26,845 (Individual Income Tax Returns)
Here:
$26,845
State:
$41,965
Salary/wage: $26,394 (reported on 88.8% of returns)
Here:
$26,394
State:
$35,695
(% of AGI for various income ranges: 88.8% for AGIs below $10k, 86.3% for AGIs $10k-25k, 87.7% for AGIs $25k-50k, 87.5% for AGIs $50k-75k, 87.7% for AGIs $75k-100k)
Taxable interest for individuals: $306 (reported on 21.1% of returns)
This zip code:
$306
South Carolina:
$1,623
(% of AGI for various income ranges: 0.3% for AGIs below $10k, 0.2% for AGIs $10k-25k, 0.2% for AGIs $25k-50k, 0.3% for AGIs $50k-75k, 0.1% for AGIs $75k-100k)
Taxable dividends: $560 (reported on 4.9% of returns)
Here:
$560
State:
$3,999
Net capital gain/loss: +$1,438 (reported on 3.1% of returns)
Here:
+$1,438
State:
+$13,100
Profit/loss from business: +$3,468 (reported on 12.1% of returns)
Here:
+$3,468
State:
+$9,144
Total itemized deductions: $13,153 (23% of AGI, reported on 11.5% of returns)
Here:
$13,153
State:
$19,039
Here:
22.7% of AGI
State:
22.8% of AGI
Charity contributions deductions: $2,920 (5% of AGI, reported on 9.8% of returns)
Here:
$2,920
State:
$4,305
Here:
5.0% of AGI
State:
5.0% of AGI
Total tax: $2,933 (reported on 61.3% of returns)
29828:
$2,933
State:
$6,497
(% of AGI for various income ranges: 2.6% for AGIs below $10k, 3.2% for AGIs $10k-25k, 5.3% for AGIs $25k-50k, 8.8% for AGIs $50k-75k, 11.4% for AGIs $75k-100k)
Earned income credit: $2,136 (reported on 36.0% of returns)
Here:
$2,136
State:
$1,882
Percentage of individuals using paid preparers for their 2004 taxes: 80.6%
Here:
81%
State:
66%
(% for various income ranges: 70.5% for AGIs below $10k, 81.7% for AGIs $10k-25k, 89.5% for AGIs $25k-50k, 83.6% for AGIs $50k-75k, 79.2% for AGIs $75k-100k)
Household received Food Stamps/SNAP in the past 12 months: 25 Household did not receive Food Stamps/SNAP in the past 12 months: 245
Women who did not have a birth in the past 12 months: 167 (26 now married, 139 unmarried)
Housing units in zip code 29828 with a mortgage: 59 Median monthly owner costs for units with a mortgage: $859 Median monthly owner costs for units without a mortgage: $586
Residents with income below the poverty level in 2022:
This zip code:
26.7%
Whole state:
14.0%
Residents with income below 50% of the poverty level in 2022:
This zip code:
19.6%
Whole state:
7.3%
Median number of rooms in houses and condos:
Here:
5.3
State:
6.4
Median number of rooms in apartments:
Here:
3.7
State:
4.5
Notable locations in this zip code not listed on our city pages
Churches in zip code 29828 include: Southside Church (A), Gloverville Pentecostal Holiness Church (B), Langley Pentecostal Holiness Church (C), Glover Grove Baptist Church (D). Display/hide their locations on the map
In group quarters: 5 (-1 institutionalized population)
Size of family households: 80 2-persons, 16 3-persons, 15 4-persons, 36 5-persons
Size of nonfamily households: 120 1-person
96.3% of residents of 29828 zip code speak English at home.
3.0% of residents speak Spanish at home (100% not well).
Foreign born population: 20 (3.0%) (0.0% of them are naturalized citizens)
:
3.0%
Whole state:
5.2%
91%Honduras
51%American
22%Irish
2%French
0%German
Year of entry for the foreign-born population
252010 or later
02000 to 2009
01990 to 1999
0Before 1990
Facilities with environmental interests located in this zip code:
CHARLIE ADKISON PAINTING INC (PINE ST in GLOVERVILLE, SC)
(Resource Conservation and Recovery Act (tracking hazardous waste)) Organizations: ALLEN CLAXTON (CONTACT/OWNER)
Alternative names: CHARLIE ADKISON PAINTING INCORPORATED , CHARLIE ADKISON PAINTING INCORPORATED DEACT
Housing units lacking complete plumbing facilities: 6.4% Housing units lacking complete kitchen facilities: 10.8%
92.7%Electricity
7.4%Utility gas
Place of birth for U.S.-born residents:
This state: 343
Northeast: 107
Midwest: 41
South: 174
62% of the 29828 zip code residents lived in the same house 5 years ago. Out of people who lived in different houses, 78% lived in this county. Out of people who lived in different counties, 50% lived in South Carolina.
94% of the 29828 zip code residents lived in the same house 1 year ago. Out of people who lived in different houses, 67% moved from this county. Out of people who lived in different houses, 24% moved from different state.
Private vs. public school enrollment:
Students in private schools in grades 1 to 8 (elementary and middle school):
Here:
0.0%
South Carolina:
14.4%
Students in private schools in grades 9 to 12 (high school):
Here:
0.0%
South Carolina:
11.1%
Top industries in this zip code by the number of employees in 2005:
Accommodation and Food Services: Full-Service Restaurants (5-9 employees: 2 establishments)
Administrative and Support and Waste Management and Remediation Services: Septic Tank and Related Services (5-9: 1)
Other Services (except Public Administration): Commercial and Industrial Machinery and Equipment (except Automotive and Electronic) Repair and Maintenance (1-4: 1)
Construction: Roofing Contractors (1-4: 1)
Accommodation and Food Services: Drinking Places (Alcoholic Beverages) (1-4: 1)
Other Services (except Public Administration): Voluntary Health Organizations (1-4: 1)
Other Services (except Public Administration): Religious Organizations (1-4: 1)
People in group quarters in 2010:
3 people in other noninstitutional facilities
People in group quarters in 2000:
4 people in religious group quarters
Home Mortgage Disclosure Act Aggregated Statistics For Year 2009 (Based on 2 partial tracts)
A) FHA, FSA/RHS & VA Home Purchase Loans
B) Conventional Home Purchase Loans
C) Refinancings
D) Home Improvement Loans
F) Non-occupant Loans on < 5 Family Dwellings (A B C & D)
G) Loans On Manufactured Home Dwelling (A B C & D)
Number
Average Value
Number
Average Value
Number
Average Value
Number
Average Value
Number
Average Value
Number
Average Value
LOANS ORIGINATED
7
$168,940
5
$136,420
13
$141,912
0
$0
1
$67,930
1
$24,140
APPLICATIONS APPROVED, NOT ACCEPTED
1
$94,650
1
$56,460
1
$48,440
0
$0
0
$0
0
$0
APPLICATIONS DENIED
2
$116,930
1
$55,770
3
$152,777
1
$18,100
0
$0
1
$33,530
APPLICATIONS WITHDRAWN
0
$0
1
$130,420
3
$202,743
0
$0
0
$0
0
$0
FILES CLOSED FOR INCOMPLETENESS
0
$0
0
$0
2
$129,345
0
$0
0
$0
0
$0
Aggregated Statistics For Year 2008 (Based on 2 partial tracts)
A) FHA, FSA/RHS & VA Home Purchase Loans
B) Conventional Home Purchase Loans
C) Refinancings
D) Home Improvement Loans
F) Non-occupant Loans on < 5 Family Dwellings (A B C & D)
G) Loans On Manufactured Home Dwelling (A B C & D)
Number
Average Value
Number
Average Value
Number
Average Value
Number
Average Value
Number
Average Value
Number
Average Value
LOANS ORIGINATED
5
$159,246
6
$163,522
6
$103,483
1
$21,890
1
$40,950
2
$55,170
APPLICATIONS APPROVED, NOT ACCEPTED
1
$86,370
1
$158,440
1
$74,560
0
$0
0
$0
0
$0
APPLICATIONS DENIED
1
$147,230
1
$128,960
3
$123,523
2
$48,920
0
$0
2
$44,480
APPLICATIONS WITHDRAWN
1
$111,540
0
$0
2
$127,060
0
$0
0
$0
0
$0
FILES CLOSED FOR INCOMPLETENESS
0
$0
0
$0
0
$0
0
$0
0
$0
0
$0
Aggregated Statistics For Year 2007 (Based on 2 partial tracts)
A) FHA, FSA/RHS & VA Home Purchase Loans
B) Conventional Home Purchase Loans
C) Refinancings
D) Home Improvement Loans
F) Non-occupant Loans on < 5 Family Dwellings (A B C & D)
G) Loans On Manufactured Home Dwelling (A B C & D)
Number
Average Value
Number
Average Value
Number
Average Value
Number
Average Value
Number
Average Value
Number
Average Value
LOANS ORIGINATED
2
$133,910
11
$130,898
7
$86,336
1
$34,390
1
$149,820
1
$67,060
APPLICATIONS APPROVED, NOT ACCEPTED
0
$0
2
$119,945
1
$122,150
0
$0
0
$0
0
$0
APPLICATIONS DENIED
0
$0
2
$85,210
5
$105,560
3
$46,607
0
$0
2
$34,955
APPLICATIONS WITHDRAWN
0
$0
1
$132,490
3
$95,137
0
$0
0
$0
0
$0
FILES CLOSED FOR INCOMPLETENESS
0
$0
0
$0
1
$29,910
0
$0
0
$0
0
$0
Aggregated Statistics For Year 2006 (Based on 2 partial tracts)
A) FHA, FSA/RHS & VA Home Purchase Loans
B) Conventional Home Purchase Loans
C) Refinancings
D) Home Improvement Loans
F) Non-occupant Loans on < 5 Family Dwellings (A B C & D)
G) Loans On Manufactured Home Dwelling (A B C & D)
Number
Average Value
Number
Average Value
Number
Average Value
Number
Average Value
Number
Average Value
Number
Average Value
LOANS ORIGINATED
2
$144,945
11
$101,904
7
$81,189
1
$49,390
1
$79,300
1
$70,170
APPLICATIONS APPROVED, NOT ACCEPTED
0
$0
1
$129,300
1
$108,960
1
$6,810
0
$0
0
$0
APPLICATIONS DENIED
0
$0
2
$81,630
6
$63,127
2
$33,015
1
$18,190
1
$59,560
APPLICATIONS WITHDRAWN
0
$0
1
$44,220
3
$74,907
0
$0
0
$0
0
$0
FILES CLOSED FOR INCOMPLETENESS
0
$0
0
$0
1
$139,640
0
$0
0
$0
0
$0
Aggregated Statistics For Year 2005 (Based on 2 partial tracts)
A) FHA, FSA/RHS & VA Home Purchase Loans
B) Conventional Home Purchase Loans
C) Refinancings
D) Home Improvement Loans
F) Non-occupant Loans on < 5 Family Dwellings (A B C & D)
G) Loans On Manufactured Home Dwelling (A B C & D)
Number
Average Value
Number
Average Value
Number
Average Value
Number
Average Value
Number
Average Value
Number
Average Value
LOANS ORIGINATED
2
$122,060
7
$85,794
6
$90,208
1
$22,070
1
$30,510
1
$37,840
APPLICATIONS APPROVED, NOT ACCEPTED
0
$0
1
$57,150
2
$60,855
0
$0
0
$0
0
$0
APPLICATIONS DENIED
0
$0
2
$75,640
4
$78,485
2
$26,335
0
$0
2
$57,020
APPLICATIONS WITHDRAWN
0
$0
1
$106,890
2
$91,930
1
$72,060
0
$0
0
$0
FILES CLOSED FOR INCOMPLETENESS
0
$0
0
$0
1
$102,840
0
$0
0
$0
0
$0
Aggregated Statistics For Year 2004 (Based on 2 partial tracts)
A) FHA, FSA/RHS & VA Home Purchase Loans
B) Conventional Home Purchase Loans
C) Refinancings
D) Home Improvement Loans
F) Non-occupant Loans on < 5 Family Dwellings (A B C & D)
G) Loans On Manufactured Home Dwelling (A B C & D)
Number
Average Value
Number
Average Value
Number
Average Value
Number
Average Value
Number
Average Value
Number
Average Value
LOANS ORIGINATED
2
$72,970
5
$76,804
6
$81,128
1
$43,960
1
$44,820
1
$48,880
APPLICATIONS APPROVED, NOT ACCEPTED
0
$0
1
$49,480
2
$62,105
1
$20,430
0
$0
1
$17,330
APPLICATIONS DENIED
0
$0
2
$57,150
5
$80,166
1
$18,530
0
$0
2
$27,065
APPLICATIONS WITHDRAWN
0
$0
1
$69,390
4
$102,945
0
$0
0
$0
0
$0
FILES CLOSED FOR INCOMPLETENESS
0
$0
0
$0
1
$81,110
0
$0
0
$0
0
$0
Aggregated Statistics For Year 2003 (Based on 2 partial tracts)
A) FHA, FSA/RHS & VA Home Purchase Loans
B) Conventional Home Purchase Loans
C) Refinancings
D) Home Improvement Loans
F) Non-occupant Loans on < 5 Family Dwellings (A B C & D)
Number
Average Value
Number
Average Value
Number
Average Value
Number
Average Value
Number
Average Value
LOANS ORIGINATED
1
$110,250
5
$96,682
13
$79,311
1
$17,580
1
$69,130
APPLICATIONS APPROVED, NOT ACCEPTED
0
$0
0
$0
2
$89,605
0
$0
0
$0
APPLICATIONS DENIED
0
$0
3
$54,767
7
$74,563
1
$5,690
0
$0
APPLICATIONS WITHDRAWN
0
$0
1
$76,890
2
$96,370
0
$0
0
$0
FILES CLOSED FOR INCOMPLETENESS
0
$0
0
$0
0
$0
0
$0
0
$0
Aggregated Statistics For Year 2002 (Based on 2 partial tracts)
A) FHA, FSA/RHS & VA Home Purchase Loans
B) Conventional Home Purchase Loans
C) Refinancings
D) Home Improvement Loans
F) Non-occupant Loans on < 5 Family Dwellings (A B C & D)
Number
Average Value
Number
Average Value
Number
Average Value
Number
Average Value
Number
Average Value
LOANS ORIGINATED
1
$103,780
5
$75,924
7
$74,846
1
$5,260
1
$43,790
APPLICATIONS APPROVED, NOT ACCEPTED
0
$0
1
$55,430
1
$89,130
0
$0
0
$0
APPLICATIONS DENIED
0
$0
2
$50,685
5
$60,634
1
$5,860
0
$0
APPLICATIONS WITHDRAWN
0
$0
1
$58,190
4
$87,752
0
$0
0
$0
FILES CLOSED FOR INCOMPLETENESS
0
$0
0
$0
1
$33,360
0
$0
0
$0
Aggregated Statistics For Year 2001 (Based on 2 partial tracts)
A) FHA, FSA/RHS & VA Home Purchase Loans
B) Conventional Home Purchase Loans
C) Refinancings
D) Home Improvement Loans
F) Non-occupant Loans on < 5 Family Dwellings (A B C & D)
Number
Average Value
Number
Average Value
Number
Average Value
Number
Average Value
Number
Average Value
LOANS ORIGINATED
2
$61,505
5
$66,408
7
$61,584
1
$35,690
1
$51,030
APPLICATIONS APPROVED, NOT ACCEPTED
0
$0
2
$44,740
2
$53,015
0
$0
0
$0
APPLICATIONS DENIED
0
$0
5
$43,134
5
$54,288
1
$12,760
0
$0
APPLICATIONS WITHDRAWN
0
$0
0
$0
3
$65,397
0
$0
0
$0
FILES CLOSED FOR INCOMPLETENESS
0
$0
0
$0
1
$39,310
0
$0
0
$0
Aggregated Statistics For Year 2000 (Based on 2 partial tracts)
A) FHA, FSA/RHS & VA Home Purchase Loans
B) Conventional Home Purchase Loans
C) Refinancings
D) Home Improvement Loans
F) Non-occupant Loans on < 5 Family Dwellings (A B C & D)
Number
Average Value
Number
Average Value
Number
Average Value
Number
Average Value
Number
Average Value
LOANS ORIGINATED
1
$89,910
6
$54,062
3
$46,663
2
$18,880
1
$35,860
APPLICATIONS APPROVED, NOT ACCEPTED
0
$0
3
$41,030
2
$53,400
0
$0
0
$0
APPLICATIONS DENIED
1
$18,790
8
$41,990
6
$48,790
1
$10,260
0
$0
APPLICATIONS WITHDRAWN
0
$0
1
$45,080
3
$53,043
0
$0
0
$0
FILES CLOSED FOR INCOMPLETENESS
0
$0
0
$0
1
$38,960
0
$0
0
$0
Aggregated Statistics For Year 1999 (Based on 1 partial tract)
Detailed PMIC statistics for the following Tracts:0211.00
2003 - 2018 National Fire Incident Reporting System (NFIRS) incidents
Based on the data from the years 2003 - 2018 the average number of fires per year is 10. The highest number of reported fires - 24 took place in 2015, and the least - 0 in 2004. The data has a growing trend.
When looking into fire subcategories, the most reports belonged to: Structure Fires (54.2%), and Outside Fires (36.7%).
Fire incident types reported to NFIRS in Zip Code 29828

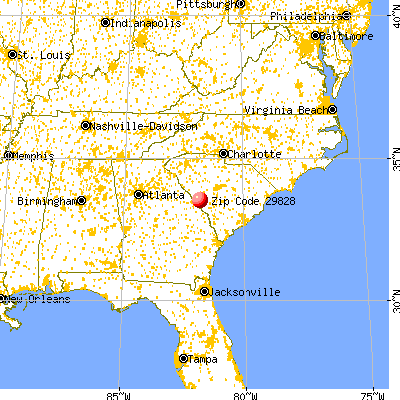


 Nearest zip codes: 29851, 29834, 29816, 29829, 29803, 29842.


 Based on the data from the years 2003 - 2018 the average number of fires per year is 10. The highest number of reported fires - 24 took place in 2015, and the least - 0 in 2004. The data has a growing trend.
 When looking into fire subcategories, the most reports belonged to: Structure Fires (54.2%), and Outside Fires (36.7%).