Estimated zip code population in 2022: 1,606 Zip code population in 2010: 1,251 Zip code population in 2000: 1,213
Houses and condos: 726 Renter-occupied apartments: 185
% of renters here:
29%
State:
28%
March 2022 cost of living index in zip code 29717: 80.5 (low, U.S. average is 100)
Land area: 38.3 sq. mi. Water area: 0.4 sq. mi.
Population density: 42 people per square mile
(very low).
OSM Map
General Map
Google Map
MSN Map
OSM Map
General Map
Google Map
MSN Map
OSM Map
General Map
Google Map
MSN Map
OSM Map
General Map
Google Map
MSN Map
Please wait while loading the map...
Real estate property taxes paid for housing units in 2022:
This zip code:
0.4% ($719)
South Carolina:
0.5% ($1,185)
Median real estate property taxes paid for housing units with mortgages in 2022: $887 (0.4%) Median real estate property taxes paid for housing units with no mortgage in 2022: $647 (0.4%)
Business Search- 14 Million verified businesses
Males: 810
(50.5%)
Females: 795
(49.5%)
For population 25 years and over in 29717:
High school or higher: 86.9%
Bachelor's degree or higher: 17.3%
Graduate or professional degree: 2.0%
Unemployed: 0.7%
Mean travel time to work (commute): 39.3 minutes
For population 15 years and over in 29717:
Never married: 30.3%
Now married: 51.8%
Separated: 1.8%
Widowed: 7.3%
Divorced: 8.8%
Zip code 29717 compared to state average:
Unemployed percentage significantly below state average.
Hispanic race population percentage significantly below state average.
Median age above state average.
Foreign-born population percentage significantly below state average.
Length of stay since moving in significantly above state average.
Percentage of population with a bachelor's degree or higher below state average.
Estimated median house/condo value in 2022: $170,636
29717:
$170,636
South Carolina:
$254,600
According to our research of South Carolina and other state lists, there was 1 registered sex offender living in 29717 zip code as of May 24, 2024. The ratio of all residents to sex offenders in zip code 29717 is 1,302 to 1. The ratio of registered sex offenders to all residents in this zip code is near the state average.
Median resident age:
This zip code:
45.5 years
South Carolina median age:
40.5 years
Average household size:
This zip code:
2.5 people
South Carolina:
2.4 people
Averages for the 2020 tax year for zip code 29717, filed in 2021:
Average Adjusted Gross Income (AGI) in 2020: $53,380 (Individual Income Tax Returns)
Here:
$53,380
State:
$65,754
Salary/wage: $49,053 (reported on 85.0% of returns)
Here:
$49,053
State:
$52,566
(% of AGI for various income ranges: 1195.3% for AGIs below $25k, 4132.5% for AGIs $25k-50k, 7690.0% for AGIs $50k-75k, 9812.5% for AGIs $75k-100k, 19452.0% for AGIs $100k-200k)
Taxable interest for individuals: $755 (reported on 18.3% of returns)
This zip code:
$755
South Carolina:
$1,749
(% of AGI for various income ranges: 10.7% for AGIs below $25k, 9.2% for AGIs $25k-50k, 33.3% for AGIs $50k-75k, 72.0% for AGIs $100k-200k)
Ordinary dividends: $2,475 (reported on 6.7% of returns)
Here:
$2,475
State:
$8,783
(% of AGI for various income ranges: 10.7% for AGIs below $25k, 207.5% for AGIs $75k-100k)
Net capital gain/loss in AGI: +$5,420 (reported on 8.3% of returns)
Here:
+$5,420
State:
+$24,194
(% of AGI for various income ranges: 39.3% for AGIs below $25k, 424.0% for AGIs $100k-200k)
Profit/loss from business: +$5,086 (reported on 11.7% of returns)
Here:
+$5,086
State:
+$11,253
(% of AGI for various income ranges: 96.0% for AGIs below $25k, 179.2% for AGIs $25k-50k)
Taxable individual retirement arrangement distribution: $8,275 (reported on 6.7% of returns)
29717:
$8,275
South Carolina:
$21,604
(% of AGI for various income ranges: 275.8% for AGIs $25k-50k)
Earned income credit: $2,645 (reported on 18.3% of returns)
Here:
$2,645
State:
$2,397
(% of AGI for various income ranges: 130.0% for AGIs below $25k, 80.0% for AGIs $25k-50k)
Percentage of individuals using paid preparers for their 2020 taxes: 91.7%
Here:
92%
State:
93%
(% for various income ranges: 95.0% for AGIs below $25k, 94.1% for AGIs $25k-50k, 88.9% for AGIs $50k-75k, 83.3% for AGIs $75k-100k, 87.5% for AGIs $100k-200k)
Averages for the 2012 tax year for zip code 29717, filed in 2013:
Average Adjusted Gross Income (AGI) in 2012: $44,820 (Individual Income Tax Returns)
Here:
$44,820
State:
$51,133
Salary/wage: $42,562 (reported on 83.9% of returns)
Here:
$42,562
State:
$42,173
(% of AGI for various income ranges: 74.1% for AGIs below $25k, 83.5% for AGIs $25k-50k, 85.7% for AGIs $50k-75k, 85.6% for AGIs $75k-100k, 72.1% for AGIs $100k-200k)
Taxable interest for individuals: $546 (reported on 23.2% of returns)
This zip code:
$546
South Carolina:
$1,468
(% of AGI for various income ranges: 0.6% for AGIs below $25k, 0.4% for AGIs $25k-50k, 0.2% for AGIs $50k-75k, 0.3% for AGIs $100k-200k)
Ordinary dividends: $1,260 (reported on 8.9% of returns)
Here:
$1,260
State:
$6,511
Net capital gain/loss in AGI: +$975 (reported on 7.1% of returns)
Here:
+$975
State:
+$13,061
Profit/loss from business: +$2,167 (reported on 10.7% of returns)
Here:
+$2,167
State:
+$10,167
Taxable individual retirement arrangement distribution: $5,660 (reported on 8.9% of returns)
29717:
$5,660
South Carolina:
$17,019
Total itemized deductions: $18,608 (20% of AGI, reported on 23.2% of returns)
Here:
$18,608
State:
$22,890
Here:
19.5% of AGI
State:
21.4% of AGI
(% of AGI for various income ranges: 6.8% for AGIs $25k-50k, 11.8% for AGIs $50k-75k, 12.6% for AGIs $75k-100k, 12.1% for AGIs $100k-200k)
Charity contributions: $4,064 (reported on 19.6% of returns)
Here:
$4,064
State:
$5,169
(% of AGI for various income ranges: 2.1% for AGIs below $25k, 2.1% for AGIs $50k-75k, 2.7% for AGIs $75k-100k, 2.4% for AGIs $100k-200k)
Taxes paid: $6,669 (reported on 23.2% of returns)
29717:
$6,669
State:
$7,644
(% of AGI for various income ranges: 1.1% for AGIs $25k-50k, 3.5% for AGIs $50k-75k, 4.7% for AGIs $75k-100k, 5.7% for AGIs $100k-200k)
Earned income credit: $2,400 (reported on 23.2% of returns)
Here:
$2,400
State:
$2,418
(% of AGI for various income ranges: 9.0% for AGIs below $25k, 1.3% for AGIs $25k-50k)
Percentage of individuals using paid preparers for their 2012 taxes: 69.6%
Here:
70%
State:
57%
(% for various income ranges: 61.9% for AGIs below $25k, 70.6% for AGIs $25k-50k, 75.0% for AGIs $50k-75k, 80.0% for AGIs $75k-100k, 80.0% for AGIs $100k-200k)
Averages for the 2004 tax year for zip code 29717, filed in 2005:
Average Adjusted Gross Income (AGI) in 2004: $35,485 (Individual Income Tax Returns)
Here:
$35,485
State:
$41,965
Salary/wage: $34,919 (reported on 89.6% of returns)
Here:
$34,919
State:
$35,695
(% of AGI for various income ranges: 78.7% for AGIs below $10k, 86.1% for AGIs $10k-25k, 88.3% for AGIs $25k-50k, 93.3% for AGIs $50k-75k, 93.2% for AGIs $75k-100k, 79.6% for AGIs over 100k)
Taxable interest for individuals: $657 (reported on 30.2% of returns)
This zip code:
$657
South Carolina:
$1,623
(% of AGI for various income ranges: 1.8% for AGIs below $10k, 1.3% for AGIs $10k-25k, 0.6% for AGIs $25k-50k, 0.5% for AGIs $50k-75k, 0.1% for AGIs $75k-100k, 0.3% for AGIs over 100k)
Taxable dividends: $619 (reported on 11.5% of returns)
Here:
$619
State:
$3,999
(% of AGI for various income ranges: 0.3% for AGIs $10k-25k, 0.0% for AGIs $25k-50k, 0.1% for AGIs $50k-75k, 0.7% for AGIs $75k-100k)
Net capital gain/loss: +$837 (reported on 7.8% of returns)
Here:
+$837
State:
+$13,100
Profit/loss from business: +$1,926 (reported on 12.4% of returns)
Here:
+$1,926
State:
+$9,144
(% of AGI for various income ranges: -8.2% for AGIs below $10k, 3.1% for AGIs $10k-25k, 0.5% for AGIs $25k-50k, 1.0% for AGIs $50k-75k)
Total itemized deductions: $14,906 (21% of AGI, reported on 25.1% of returns)
Here:
$14,906
State:
$19,039
Here:
21.3% of AGI
State:
22.8% of AGI
(% of AGI for various income ranges: 6.9% for AGIs $10k-25k, 6.9% for AGIs $25k-50k, 11.3% for AGIs $50k-75k, 17.9% for AGIs $75k-100k, 13.4% for AGIs over 100k)
Charity contributions deductions: $3,405 (5% of AGI, reported on 21.1% of returns)
Here:
$3,405
State:
$4,305
Here:
4.8% of AGI
State:
5.0% of AGI
(% of AGI for various income ranges: 1.2% for AGIs $10k-25k, 1.5% for AGIs $25k-50k, 2.4% for AGIs $50k-75k, 3.6% for AGIs $75k-100k, 2.0% for AGIs over 100k)
Total tax: $4,142 (reported on 70.5% of returns)
29717:
$4,142
State:
$6,497
(% of AGI for various income ranges: 5.0% for AGIs below $10k, 3.0% for AGIs $10k-25k, 5.8% for AGIs $25k-50k, 8.1% for AGIs $50k-75k, 8.5% for AGIs $75k-100k, 17.6% for AGIs over 100k)
Earned income credit: $1,697 (reported on 24.0% of returns)
Here:
$1,697
State:
$1,882
Percentage of individuals using paid preparers for their 2004 taxes: 75.1%
Here:
75%
State:
66%
(% for various income ranges: 66.0% for AGIs below $10k, 78.3% for AGIs $10k-25k, 74.5% for AGIs $25k-50k, 80.0% for AGIs $50k-75k, 72.2% for AGIs $75k-100k, 85.0% for AGIs over 100k)
Likely homosexual households (counted as self-reported same-sex unmarried-partner households)
Lesbian couples: 0.0% of all households
Gay men: 0.1% of all households
Household received Food Stamps/SNAP in the past 12 months: 60 Household did not receive Food Stamps/SNAP in the past 12 months: 587
Women who had a birth in the past 12 months: 53 (56 now married, 0 unmarried) Women who did not have a birth in the past 12 months: 303 (116 now married, 185 unmarried)
Housing units in zip code 29717 with a mortgage: 158 (8 second mortgage, 8 both second mortgage and home equity loan) Houses without a mortgage: 1
Median monthly owner costs for units with a mortgage: $914 Median monthly owner costs for units without a mortgage: $282
Residents with income below the poverty level in 2022:
This zip code:
22.4%
Whole state:
14.0%
Residents with income below 50% of the poverty level in 2022:
This zip code:
5.0%
Whole state:
7.3%
Median number of rooms in houses and condos:
Here:
6.0
State:
6.4
Median number of rooms in apartments:
Here:
5.6
State:
4.5
Notable locations in this zip code not listed on our city pages
Churches in zip code 29717 include: Holiness Church (A), Mount Zion Number 2 African Methodist Episcopal Zion Church (B), Mount Vernon United Methodist Church (C), Unity Baptist Church (D), Saint Pauls Baptist Church (E), Saint James African Methodist Episcopal Church (F). Display/hide their locations on the map
Streams, rivers, and creeks: Beaverdam Creek (A), Mud Creek (B), Smith Creek (C), Mountain Branch (D), Kings Creek (E), McDaniel Branch (F), Loves Creek (G), Guyonmoore Creek (H). Display/hide their locations on the map
Size of family households: 134 2-persons, 130 3-persons, 69 4-persons, 50 5-persons, 6 6-persons, 13 7-or-more-persons
Size of nonfamily households: 224 1-person, 14 2-persons
182 married couples with children.
68 single-parent households (68 women).
99.9% of residents of 29717 zip code speak English at home.
Foreign born population: 1 (0.1%) (0.0% of them are naturalized citizens)
:
0.1%
Whole state:
5.2%
100%France
50%American
15%English
5%Scotch-Irish
4%Swedish
4%European
2%Irish
2%German
Year of entry for the foreign-born population
02010 or later
22000 to 2009
01990 to 1999
1Before 1990
Facilities with environmental interests located in this zip code:
HICKSON CORPORATION (1010 PEACHTREE EXTENSION, HWY. 211 in HICKORY GROVE, SC)
Conditionally Exempt Small Quantity Generators, less than 100 kg/month of hazardous waste (Resource Conservation and Recovery Act (tracking hazardous waste)) - notification STATE MASTER (South Carolina database) - AIR PROGRAM, TRI REPORTER, HAZARDOUS WASTE PROGRAM TRI REPORTER (Tracking of toxic chemicals releasing facilities) Business SIC classification: INDUSTRIAL INORGANIC CHEMICALS Organizations: OPERNAME (CONTACT/OPERATOR)
, HIGKORY GROVE INCORPORATED (CONTACT/OWNER)
Alternative names: HICKSON CORP-CLOSED
HICKORY GROVE-SHARON ELEM (4901 HICKORY GROVE ROAD in HICKORY GROVE, SC)
(National Center for Education Statistics) - STATE ID-4601045 Organizations: YORK COUNTY SCHOOL DISTRICT 01 (SCHOOL DISTRICT)
HICKSON CORP-CLOSED (HWY 211 in HICKORY GROVE, SC)
AIR MINOR (AIRS/AFS) Business SIC classification: INDUSTRIAL INORGANIC CHEMICALS
Housing units lacking complete plumbing facilities: 4.3% Housing units lacking complete kitchen facilities: 7.7%
72.5%Electricity
9.3%Wood
8.2%No fuel used
4.1%Utility gas
4.1%Fuel oil, kerosene, etc.
2.3%Bottled, tank, or LP gas
Population in 1990: 932. Population change in the 1990s: +281 (+30.2%).
Place of birth for U.S.-born residents:
This state: 986
Northeast: 184
Midwest: 30
South: 388
72% of the 29717 zip code residents lived in the same house 5 years ago. Out of people who lived in different houses, 74% lived in this county. Out of people who lived in different counties, 50% lived in South Carolina.
79% of the 29717 zip code residents lived in the same house 1 year ago. Out of people who lived in different houses, 52% moved from this county. Out of people who lived in different houses, 46% moved from different state.
Private vs. public school enrollment:
Students in private schools in grades 1 to 8 (elementary and middle school): 25
Here:
17.7%
South Carolina:
14.4%
Students in private schools in grades 9 to 12 (high school): 6
Here:
27.6%
South Carolina:
11.1%
Students in private undergraduate colleges: 4
Here:
7.2%
South Carolina:
21.9%
Occupation by median earnings in the past 12 months ($)
108,065Architecture and engineering occupations
70,067Installation, maintenance, and repair occupations
66,364Management occupations
64,737Fire fighting and prevention, and other protective service workers including supervisors
59,151Transportation occupations
58,991Health diagnosing and treating practitioners and other technical occupations
Companies with federal contracts located in this zip code:
ROBERT DAGNALL (5885 S HIGHWAY 97 RD in HICKORY GROVE, SC; small business) : $39,456 in 4 contractsfrom 2003 to 2006
$12,450 with U.S. Army Corps of Engineers - civil program financing only for Miscellaneous Service and Trade Equipment. Taking place in KY. Signed on 2003-02-06. Completion date: 2003-04-01.
$9,280 with Army for Vending and Coin Operated Machines. Taking place in KY. Signed on 2006-02-27. Completion date: 2006-03-31.
$8,951 with Army for Miscellaneous Service and Trade Equipment. Taking place in KY. Signed on 2005-03-18. Completion date: 2004-04-01.
$8,775, same as above.Signed on 2004-02-26. Completion date: 2004-04-01.
Top industries in this zip code by the number of employees in 2005:
Accommodation and Food Services: Full-Service Restaurants (5-9: 1)
Other Services (except Public Administration): Commercial and Industrial Machinery and Equipment (except Automotive and Electronic) Repair and Maintenance (5-9: 1)
Other Services (except Public Administration): Religious Organizations (1-4: 1)
Construction: Plumbing, Heating, and Air-Conditioning Contractors (1-4: 1)
Fatal accident statistics in 2014:
Fatal accident count: 1
Vehicles involved in fatal accidents: 2
Fatal accidents caused by drunken drivers: 1
Fatalities: 1
Persons involved in fatal accidents: 2
Pedestrians involved in fatal accidents: 0
Fatal accident statistics in 2010:
Fatal accident count: 1
Vehicles involved in fatal accidents: 1
Fatal accidents caused by drunken drivers: 1
Fatalities: 1
Persons involved in fatal accidents: 1
Pedestrians involved in fatal accidents: 0
Home Mortgage Disclosure Act Aggregated Statistics For Year 2009 (Based on 2 partial tracts)
A) FHA, FSA/RHS & VA Home Purchase Loans
B) Conventional Home Purchase Loans
C) Refinancings
D) Home Improvement Loans
F) Non-occupant Loans on < 5 Family Dwellings (A B C & D)
G) Loans On Manufactured Home Dwelling (A B C & D)
Number
Average Value
Number
Average Value
Number
Average Value
Number
Average Value
Number
Average Value
Number
Average Value
LOANS ORIGINATED
5
$136,030
7
$89,879
37
$141,485
3
$27,693
4
$108,298
5
$61,654
APPLICATIONS APPROVED, NOT ACCEPTED
1
$98,560
1
$63,030
5
$133,394
1
$141,530
0
$0
1
$63,030
APPLICATIONS DENIED
1
$157,000
3
$149,553
23
$126,658
2
$30,940
0
$0
6
$70,478
APPLICATIONS WITHDRAWN
2
$104,570
2
$78,500
15
$145,351
0
$0
0
$0
2
$115,175
FILES CLOSED FOR INCOMPLETENESS
0
$0
1
$8,590
3
$141,150
0
$0
0
$0
1
$31,510
Aggregated Statistics For Year 2008 (Based on 2 partial tracts)
A) FHA, FSA/RHS & VA Home Purchase Loans
B) Conventional Home Purchase Loans
C) Refinancings
D) Home Improvement Loans
F) Non-occupant Loans on < 5 Family Dwellings (A B C & D)
G) Loans On Manufactured Home Dwelling (A B C & D)
Number
Average Value
Number
Average Value
Number
Average Value
Number
Average Value
Number
Average Value
Number
Average Value
LOANS ORIGINATED
5
$158,950
11
$95,378
31
$136,134
6
$38,868
5
$82,282
8
$49,851
APPLICATIONS APPROVED, NOT ACCEPTED
0
$0
2
$96,550
6
$98,938
1
$10,890
1
$62,460
3
$59,210
APPLICATIONS DENIED
2
$120,905
5
$41,944
23
$138,865
3
$65,323
1
$63,030
7
$62,620
APPLICATIONS WITHDRAWN
0
$0
2
$169,895
8
$134,870
1
$2,860
1
$63,030
1
$47,560
FILES CLOSED FOR INCOMPLETENESS
0
$0
1
$11,460
1
$38,390
1
$19,480
0
$0
0
$0
Aggregated Statistics For Year 2007 (Based on 2 partial tracts)
A) FHA, FSA/RHS & VA Home Purchase Loans
B) Conventional Home Purchase Loans
C) Refinancings
D) Home Improvement Loans
F) Non-occupant Loans on < 5 Family Dwellings (A B C & D)
G) Loans On Manufactured Home Dwelling (A B C & D)
Number
Average Value
Number
Average Value
Number
Average Value
Number
Average Value
Number
Average Value
Number
Average Value
LOANS ORIGINATED
3
$156,620
21
$107,479
42
$122,458
10
$45,783
7
$65,567
15
$60,661
APPLICATIONS APPROVED, NOT ACCEPTED
0
$0
4
$115,890
4
$162,302
1
$5,730
1
$40,110
2
$78,785
APPLICATIONS DENIED
2
$83,370
17
$130,475
35
$107,806
7
$28,404
3
$215,640
10
$70,765
APPLICATIONS WITHDRAWN
1
$83,660
5
$143,136
11
$126,320
1
$57,300
0
$0
1
$118,610
FILES CLOSED FOR INCOMPLETENESS
1
$82,510
2
$278,190
2
$321,165
0
$0
0
$0
1
$72,200
Aggregated Statistics For Year 2006 (Based on 2 partial tracts)
A) FHA, FSA/RHS & VA Home Purchase Loans
B) Conventional Home Purchase Loans
C) Refinancings
D) Home Improvement Loans
F) Non-occupant Loans on < 5 Family Dwellings (A B C & D)
G) Loans On Manufactured Home Dwelling (A B C & D)
Number
Average Value
Number
Average Value
Number
Average Value
Number
Average Value
Number
Average Value
Number
Average Value
LOANS ORIGINATED
5
$130,758
26
$92,231
36
$117,768
7
$47,559
3
$49,087
15
$63,832
APPLICATIONS APPROVED, NOT ACCEPTED
0
$0
2
$163,305
9
$101,548
2
$26,070
0
$0
2
$42,975
APPLICATIONS DENIED
1
$64,750
10
$98,384
38
$113,514
6
$47,463
3
$144,970
11
$71,208
APPLICATIONS WITHDRAWN
2
$94,260
5
$69,218
17
$132,599
0
$0
1
$57,300
3
$97,600
FILES CLOSED FOR INCOMPLETENESS
0
$0
0
$0
3
$160,057
1
$28,650
0
$0
1
$28,650
Aggregated Statistics For Year 2005 (Based on 2 partial tracts)
A) FHA, FSA/RHS & VA Home Purchase Loans
B) Conventional Home Purchase Loans
C) Refinancings
D) Home Improvement Loans
F) Non-occupant Loans on < 5 Family Dwellings (A B C & D)
G) Loans On Manufactured Home Dwelling (A B C & D)
Number
Average Value
Number
Average Value
Number
Average Value
Number
Average Value
Number
Average Value
Number
Average Value
LOANS ORIGINATED
3
$96,837
29
$80,971
40
$108,125
8
$20,485
8
$71,052
16
$47,380
APPLICATIONS APPROVED, NOT ACCEPTED
0
$0
7
$133,017
9
$144,841
0
$0
1
$112,880
2
$52,430
APPLICATIONS DENIED
2
$75,065
15
$92,329
42
$104,272
6
$33,617
2
$71,340
19
$77,265
APPLICATIONS WITHDRAWN
1
$181,640
3
$71,243
21
$129,116
2
$67,615
1
$13,750
3
$100,083
FILES CLOSED FOR INCOMPLETENESS
1
$44,690
3
$163,303
6
$86,905
0
$0
1
$67,040
2
$45,840
Aggregated Statistics For Year 2004 (Based on 2 partial tracts)
A) FHA, FSA/RHS & VA Home Purchase Loans
B) Conventional Home Purchase Loans
C) Refinancings
D) Home Improvement Loans
F) Non-occupant Loans on < 5 Family Dwellings (A B C & D)
G) Loans On Manufactured Home Dwelling (A B C & D)
Number
Average Value
Number
Average Value
Number
Average Value
Number
Average Value
Number
Average Value
Number
Average Value
LOANS ORIGINATED
1
$65,890
21
$84,149
44
$95,548
9
$13,943
3
$61,503
14
$54,926
APPLICATIONS APPROVED, NOT ACCEPTED
1
$67,610
3
$73,343
9
$108,361
1
$14,320
1
$36,100
5
$68,302
APPLICATIONS DENIED
2
$71,340
11
$86,002
44
$101,786
3
$35,717
1
$22,920
18
$68,824
APPLICATIONS WITHDRAWN
0
$0
4
$133,795
15
$112,919
1
$24,070
1
$134,660
3
$78,883
FILES CLOSED FOR INCOMPLETENESS
0
$0
1
$70,480
2
$96,835
0
$0
1
$30,940
1
$48,700
Aggregated Statistics For Year 2003 (Based on 2 partial tracts)
A) FHA, FSA/RHS & VA Home Purchase Loans
B) Conventional Home Purchase Loans
C) Refinancings
D) Home Improvement Loans
F) Non-occupant Loans on < 5 Family Dwellings (A B C & D)
Number
Average Value
Number
Average Value
Number
Average Value
Number
Average Value
Number
Average Value
LOANS ORIGINATED
1
$52,720
23
$97,709
78
$100,040
13
$19,614
3
$216,783
APPLICATIONS APPROVED, NOT ACCEPTED
0
$0
6
$90,057
13
$97,058
1
$9,170
2
$124,625
APPLICATIONS DENIED
1
$118,040
14
$54,149
38
$99,792
4
$26,072
1
$21,770
APPLICATIONS WITHDRAWN
0
$0
1
$115,750
14
$101,708
0
$0
1
$29,800
FILES CLOSED FOR INCOMPLETENESS
0
$0
0
$0
3
$164,643
0
$0
0
$0
Aggregated Statistics For Year 2002 (Based on 2 partial tracts)
A) FHA, FSA/RHS & VA Home Purchase Loans
B) Conventional Home Purchase Loans
C) Refinancings
D) Home Improvement Loans
F) Non-occupant Loans on < 5 Family Dwellings (A B C & D)
Number
Average Value
Number
Average Value
Number
Average Value
Number
Average Value
Number
Average Value
LOANS ORIGINATED
3
$101,993
25
$65,758
51
$94,758
8
$13,752
6
$52,907
APPLICATIONS APPROVED, NOT ACCEPTED
0
$0
5
$35,412
17
$84,602
1
$14,320
1
$12,610
APPLICATIONS DENIED
1
$47,560
13
$53,950
43
$84,857
3
$5,347
2
$58,730
APPLICATIONS WITHDRAWN
0
$0
1
$22,920
12
$70,766
0
$0
0
$0
FILES CLOSED FOR INCOMPLETENESS
0
$0
1
$63,030
6
$79,838
0
$0
0
$0
Aggregated Statistics For Year 2001 (Based on 2 partial tracts)
A) FHA, FSA/RHS & VA Home Purchase Loans
B) Conventional Home Purchase Loans
C) Refinancings
D) Home Improvement Loans
F) Non-occupant Loans on < 5 Family Dwellings (A B C & D)
Number
Average Value
Number
Average Value
Number
Average Value
Number
Average Value
Number
Average Value
LOANS ORIGINATED
3
$60,930
24
$71,362
66
$87,600
7
$12,687
5
$26,932
APPLICATIONS APPROVED, NOT ACCEPTED
0
$0
11
$69,281
9
$67,932
1
$2,290
0
$0
APPLICATIONS DENIED
0
$0
27
$51,846
41
$72,981
2
$13,465
0
$0
APPLICATIONS WITHDRAWN
0
$0
5
$83,888
17
$92,759
1
$6,880
0
$0
FILES CLOSED FOR INCOMPLETENESS
0
$0
0
$0
4
$42,688
0
$0
0
$0
Aggregated Statistics For Year 2000 (Based on 2 partial tracts)
A) FHA, FSA/RHS & VA Home Purchase Loans
B) Conventional Home Purchase Loans
C) Refinancings
D) Home Improvement Loans
F) Non-occupant Loans on < 5 Family Dwellings (A B C & D)
Number
Average Value
Number
Average Value
Number
Average Value
Number
Average Value
Number
Average Value
LOANS ORIGINATED
5
$79,188
28
$66,141
37
$68,837
14
$11,869
1
$26,360
APPLICATIONS APPROVED, NOT ACCEPTED
0
$0
9
$59,592
14
$54,926
2
$13,180
1
$16,040
APPLICATIONS DENIED
0
$0
37
$52,701
55
$65,937
7
$14,407
1
$40,680
APPLICATIONS WITHDRAWN
1
$32,090
5
$95,348
21
$68,678
0
$0
1
$76,780
FILES CLOSED FOR INCOMPLETENESS
1
$65,890
1
$34,950
3
$63,413
0
$0
0
$0
Aggregated Statistics For Year 1999 (Based on 1 partial tract)
A) FHA, FSA/RHS & VA Home Purchase Loans
B) Conventional Home Purchase Loans
C) Refinancings
D) Home Improvement Loans
F) Non-occupant Loans on < 5 Family Dwellings (A B C & D)

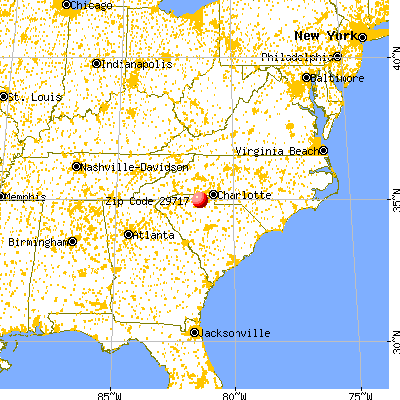


 Nearest zip codes: 29743, 29742, 29340, 29702, 29364, 29726.


