Estimated zip code population in 2022: 22,353 Zip code population in 2010: 18,578 Zip code population in 2000: 15,980
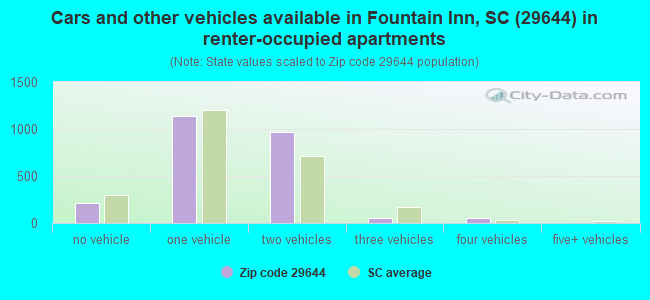
Houses and condos: 9,475 Renter-occupied apartments: 2,436
% of renters here:
27%
State:
28%
March 2022 cost of living index in zip code 29644: 81.5 (low, U.S. average is 100)
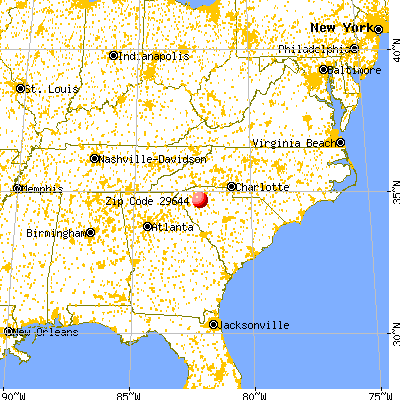
Land area: 82.0 sq. mi. Water area: 0.5 sq. mi.
Population density: 273 people per square mile
(very low).
OSM Map
General Map
Google Map
MSN Map
OSM Map
General Map
Google Map
MSN Map
OSM Map
General Map
Google Map
MSN Map
OSM Map
General Map
Google Map
MSN Map
Please wait while loading the map...
Real estate property taxes paid for housing units in 2022:
This zip code:
0.5% ($1,212)
South Carolina:
0.5% ($1,185)
Median real estate property taxes paid for housing units with mortgages in 2022: $1,307 (0.5%) Median real estate property taxes paid for housing units with no mortgage in 2022: $854 (0.4%)
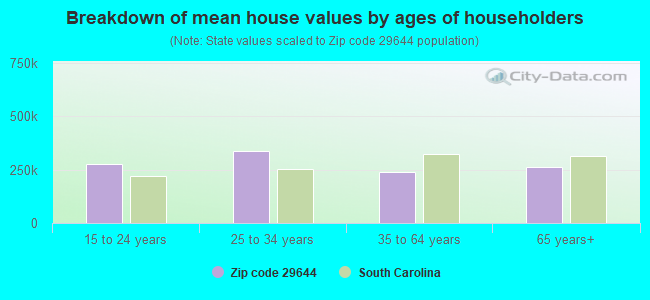
Estimated median house/condo value in 2022: $228,221
29644:
$228,221
South Carolina:
$254,600
According to our research of South Carolina and other state lists, there was 1 registered sex offender living in 29644 zip code as of May 19, 2024. The ratio of all residents to sex offenders in zip code 29644 is 20,132 to 1. The ratio of registered sex offenders to all residents in this zip code is much lower than the state average.
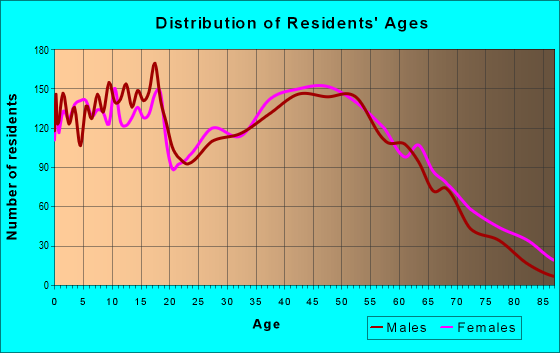
Median resident age:
This zip code:
38.3 years
South Carolina median age:
40.5 years
Average household size:
This zip code:
2.5 people
South Carolina:
2.4 people
Averages for the 2020 tax year for zip code 29644, filed in 2021:
Average Adjusted Gross Income (AGI) in 2020: $57,799 (Individual Income Tax Returns)
Here:
$57,799
State:
$65,754
Salary/wage: $50,592 (reported on 85.8% of returns)
Here:
$50,592
State:
$52,566
(% of AGI for various income ranges: 1280.4% for AGIs below $25k, 4003.2% for AGIs $25k-50k, 7554.1% for AGIs $50k-75k, 10482.5% for AGIs $75k-100k, 19682.9% for AGIs $100k-200k, 55784.0% for AGIs over 200k)
Taxable interest for individuals: $1,360 (reported on 18.9% of returns)
This zip code:
$1,360
South Carolina:
$1,749
(% of AGI for various income ranges: 7.4% for AGIs below $25k, 12.2% for AGIs $25k-50k, 23.0% for AGIs $50k-75k, 33.4% for AGIs $75k-100k, 78.1% for AGIs $100k-200k, 1254.0% for AGIs over 200k)
Ordinary dividends: $5,454 (reported on 12.9% of returns)
Here:
$5,454
State:
$8,783
(% of AGI for various income ranges: 18.2% for AGIs below $25k, 26.8% for AGIs $25k-50k, 42.8% for AGIs $50k-75k, 122.9% for AGIs $75k-100k, 200.6% for AGIs $100k-200k, 3714.0% for AGIs over 200k)
Net capital gain/loss in AGI: +$15,428 (reported on 11.3% of returns)
Here:
+$15,428
State:
+$24,194
(% of AGI for various income ranges: 4.6% for AGIs below $25k, 17.4% for AGIs $25k-50k, 52.7% for AGIs $50k-75k, 172.2% for AGIs $75k-100k, 442.8% for AGIs $100k-200k, 13128.0% for AGIs over 200k)
Profit/loss from business: +$8,076 (reported on 16.2% of returns)
Here:
+$8,076
State:
+$11,253
(% of AGI for various income ranges: 66.9% for AGIs below $25k, 110.8% for AGIs $25k-50k, 157.3% for AGIs $50k-75k, 461.5% for AGIs $75k-100k, 525.3% for AGIs $100k-200k, 1556.0% for AGIs over 200k)
Taxable individual retirement arrangement distribution: $17,728 (reported on 7.5% of returns)
29644:
$17,728
South Carolina:
$21,604
(% of AGI for various income ranges: 48.0% for AGIs below $25k, 96.4% for AGIs $25k-50k, 195.6% for AGIs $50k-75k, 336.6% for AGIs $75k-100k, 669.6% for AGIs $100k-200k, 1895.0% for AGIs over 200k)
Total itemized deductions: $32,810 (reported on 5.9% of returns)
Here:
$32,810
State:
$35,199
(% of AGI for various income ranges: 19.1% for AGIs below $25k, 86.1% for AGIs $25k-50k, 230.2% for AGIs $50k-75k, 414.4% for AGIs $75k-100k, 865.6% for AGIs $100k-200k, 6899.0% for AGIs over 200k)
Charity contributions: $13,928 (reported on 5.1% of returns)
Here:
$13,928
State:
$14,319
(% of AGI for various income ranges: 21.4% for AGIs $25k-50k, 44.0% for AGIs $50k-75k, 92.7% for AGIs $75k-100k, 302.6% for AGIs $100k-200k, 3845.0% for AGIs over 200k)
Taxes paid: $7,230 (reported on 5.9% of returns)
29644:
$7,230
State:
$7,486
(% of AGI for various income ranges: 2.5% for AGIs below $25k, 11.6% for AGIs $25k-50k, 51.3% for AGIs $50k-75k, 112.4% for AGIs $75k-100k, 254.0% for AGIs $100k-200k, 1166.0% for AGIs over 200k)
Earned income credit: $2,265 (reported on 19.8% of returns)
Here:
$2,265
State:
$2,397
(% of AGI for various income ranges: 112.0% for AGIs below $25k, 80.3% for AGIs $25k-50k, 2.4% for AGIs $50k-75k)
Percentage of individuals using paid preparers for their 2020 taxes: 93.2%
Here:
93%
State:
93%
(% for various income ranges: 92.1% for AGIs below $25k, 92.8% for AGIs $25k-50k, 93.5% for AGIs $50k-75k, 94.7% for AGIs $75k-100k, 94.5% for AGIs $100k-200k, 96.4% for AGIs over 200k)
Averages for the 2012 tax year for zip code 29644, filed in 2013:
Average Adjusted Gross Income (AGI) in 2012: $46,851 (Individual Income Tax Returns)
Here:
$46,851
State:
$51,133
Salary/wage: $41,054 (reported on 88.3% of returns)
Here:
$41,054
State:
$42,173
(% of AGI for various income ranges: 79.3% for AGIs below $25k, 85.0% for AGIs $25k-50k, 84.3% for AGIs $50k-75k, 81.2% for AGIs $75k-100k, 82.0% for AGIs $100k-200k, 42.3% for AGIs over 200k)
Taxable interest for individuals: $1,136 (reported on 21.2% of returns)
This zip code:
$1,136
South Carolina:
$1,468
(% of AGI for various income ranges: 0.4% for AGIs below $25k, 0.4% for AGIs $25k-50k, 0.4% for AGIs $50k-75k, 0.3% for AGIs $75k-100k, 0.5% for AGIs $100k-200k, 1.2% for AGIs over 200k)
Ordinary dividends: $4,620 (reported on 13.3% of returns)
Here:
$4,620
State:
$6,511
(% of AGI for various income ranges: 0.9% for AGIs below $25k, 0.5% for AGIs $25k-50k, 0.7% for AGIs $50k-75k, 1.0% for AGIs $75k-100k, 1.2% for AGIs $100k-200k, 4.5% for AGIs over 200k)
Net capital gain/loss in AGI: +$8,904 (reported on 9.0% of returns)
Here:
+$8,904
State:
+$13,061
(% of AGI for various income ranges: 0.3% for AGIs $25k-50k, 0.4% for AGIs $50k-75k, 0.7% for AGIs $75k-100k, 1.2% for AGIs $100k-200k, 9.3% for AGIs over 200k)
Profit/loss from business: +$8,881 (reported on 13.5% of returns)
Here:
+$8,881
State:
+$10,167
(% of AGI for various income ranges: 6.8% for AGIs below $25k, 2.5% for AGIs $25k-50k, 1.4% for AGIs $50k-75k, 1.8% for AGIs $75k-100k, 2.1% for AGIs $100k-200k, 2.1% for AGIs over 200k)
Taxable individual retirement arrangement distribution: $12,961 (reported on 7.2% of returns)
29644:
$12,961
South Carolina:
$17,019
(% of AGI for various income ranges: 2.7% for AGIs below $25k, 1.8% for AGIs $25k-50k, 1.9% for AGIs $50k-75k, 2.3% for AGIs $75k-100k, 3.0% for AGIs $100k-200k)
Total itemized deductions: $20,125 (21% of AGI, reported on 28.0% of returns)
Here:
$20,125
State:
$22,890
Here:
21.5% of AGI
State:
21.4% of AGI
(% of AGI for various income ranges: 6.0% for AGIs below $25k, 8.6% for AGIs $25k-50k, 11.4% for AGIs $50k-75k, 14.9% for AGIs $75k-100k, 16.4% for AGIs $100k-200k, 12.9% for AGIs over 200k)
Charity contributions: $4,899 (reported on 23.4% of returns)
Here:
$4,899
State:
$5,169
(% of AGI for various income ranges: 0.8% for AGIs below $25k, 1.4% for AGIs $25k-50k, 2.0% for AGIs $50k-75k, 2.8% for AGIs $75k-100k, 3.4% for AGIs $100k-200k, 4.2% for AGIs over 200k)
Taxes paid: $6,368 (reported on 28.0% of returns)
29644:
$6,368
State:
$7,644
(% of AGI for various income ranges: 0.7% for AGIs below $25k, 1.9% for AGIs $25k-50k, 3.2% for AGIs $50k-75k, 4.6% for AGIs $75k-100k, 6.3% for AGIs $100k-200k, 5.4% for AGIs over 200k)
Earned income credit: $2,312 (reported on 25.4% of returns)
Here:
$2,312
State:
$2,418
(% of AGI for various income ranges: 8.4% for AGIs below $25k, 1.5% for AGIs $25k-50k)
Percentage of individuals using paid preparers for their 2012 taxes: 54.0%
Here:
54%
State:
57%
(% for various income ranges: 51.6% for AGIs below $25k, 52.9% for AGIs $25k-50k, 56.2% for AGIs $50k-75k, 59.1% for AGIs $75k-100k, 57.8% for AGIs $100k-200k, 72.7% for AGIs over 200k)
Averages for the 2004 tax year for zip code 29644, filed in 2005:
Average Adjusted Gross Income (AGI) in 2004: $40,079 (Individual Income Tax Returns)
Here:
$40,079
State:
$41,965
Salary/wage: $35,385 (reported on 90.3% of returns)
Here:
$35,385
State:
$35,695
(% of AGI for various income ranges: 122.6% for AGIs below $10k, 84.0% for AGIs $10k-25k, 87.5% for AGIs $25k-50k, 85.7% for AGIs $50k-75k, 86.8% for AGIs $75k-100k, 56.1% for AGIs over 100k)
Taxable interest for individuals: $1,462 (reported on 28.7% of returns)
This zip code:
$1,462
South Carolina:
$1,623
(% of AGI for various income ranges: 3.8% for AGIs below $10k, 1.3% for AGIs $10k-25k, 0.6% for AGIs $25k-50k, 0.6% for AGIs $50k-75k, 0.6% for AGIs $75k-100k, 1.9% for AGIs over 100k)
Taxable dividends: $4,866 (reported on 14.6% of returns)
Here:
$4,866
State:
$3,999
(% of AGI for various income ranges: 2.7% for AGIs below $10k, 0.9% for AGIs $10k-25k, 0.5% for AGIs $25k-50k, 0.7% for AGIs $50k-75k, 0.8% for AGIs $75k-100k, 5.1% for AGIs over 100k)
Net capital gain/loss: +$14,033 (reported on 11.3% of returns)
Here:
+$14,033
State:
+$13,100
(% of AGI for various income ranges: -0.0% for AGIs below $10k, 0.2% for AGIs $10k-25k, 0.3% for AGIs $25k-50k, 1.1% for AGIs $50k-75k, 1.0% for AGIs $75k-100k, 14.3% for AGIs over 100k)
Profit/loss from business: +$5,489 (reported on 14.3% of returns)
Here:
+$5,489
State:
+$9,144
(% of AGI for various income ranges: 4.0% for AGIs below $10k, 2.9% for AGIs $10k-25k, 2.3% for AGIs $25k-50k, 1.1% for AGIs $50k-75k, 1.9% for AGIs $75k-100k, 1.9% for AGIs over 100k)
IRA payment deduction: $3,062 (reported on 1.6% of returns)
29644:
$3,062
South Carolina:
$2,972
(% of AGI for various income ranges: 0.6% for AGIs below $10k, 0.1% for AGIs $25k-50k, 0.1% for AGIs $50k-75k, 0.1% for AGIs $75k-100k, 0.1% for AGIs over 100k)
Self-employed pension: $4,000 (reported on 0.2% of returns)
Here:
$4,000
South Carolina:
$15,117
Total itemized deductions: $16,417 (23% of AGI, reported on 35.1% of returns)
Here:
$16,417
State:
$19,039
Here:
23.2% of AGI
State:
22.8% of AGI
(% of AGI for various income ranges: 11.9% for AGIs below $10k, 8.4% for AGIs $10k-25k, 12.9% for AGIs $25k-50k, 16.2% for AGIs $50k-75k, 18.2% for AGIs $75k-100k, 14.9% for AGIs over 100k)
Charity contributions deductions: $4,109 (6% of AGI, reported on 30.4% of returns)
Here:
$4,109
State:
$4,305
Here:
5.6% of AGI
State:
5.0% of AGI
(% of AGI for various income ranges: 1.2% for AGIs below $10k, 1.5% for AGIs $10k-25k, 2.1% for AGIs $25k-50k, 2.8% for AGIs $50k-75k, 3.5% for AGIs $75k-100k, 5.2% for AGIs over 100k)
Total tax: $5,254 (reported on 71.0% of returns)
29644:
$5,254
State:
$6,497
(% of AGI for various income ranges: 2.9% for AGIs below $10k, 3.5% for AGIs $10k-25k, 5.9% for AGIs $25k-50k, 8.0% for AGIs $50k-75k, 9.5% for AGIs $75k-100k, 17.3% for AGIs over 100k)
Earned income credit: $1,803 (reported on 21.4% of returns)
Here:
$1,803
State:
$1,882
Percentage of individuals using paid preparers for their 2004 taxes: 62.8%
Here:
63%
State:
66%
(% for various income ranges: 56.9% for AGIs below $10k, 66.1% for AGIs $10k-25k, 63.8% for AGIs $25k-50k, 62.3% for AGIs $50k-75k, 60.5% for AGIs $75k-100k, 66.8% for AGIs over 100k)
Likely homosexual households (counted as self-reported same-sex unmarried-partner households)
Lesbian couples: 0.3% of all households
Gay men: 0.0% of all households
Household received Food Stamps/SNAP in the past 12 months: 922 Household did not receive Food Stamps/SNAP in the past 12 months: 8,049
Women who had a birth in the past 12 months: 466 (380 now married, 98 unmarried) Women who did not have a birth in the past 12 months: 4,789 (2,490 now married, 2,315 unmarried)
Housing units in zip code 29644 with a mortgage: 3,856 (302 second mortgage, 283 both second mortgage and home equity loan) Houses without a mortgage: 39
Median monthly owner costs for units with a mortgage: $1,230 Median monthly owner costs for units without a mortgage: $404
Residents with income below the poverty level in 2022:
This zip code:
15.5%
Whole state:
14.0%
Residents with income below 50% of the poverty level in 2022:
This zip code:
8.7%
Whole state:
7.3%
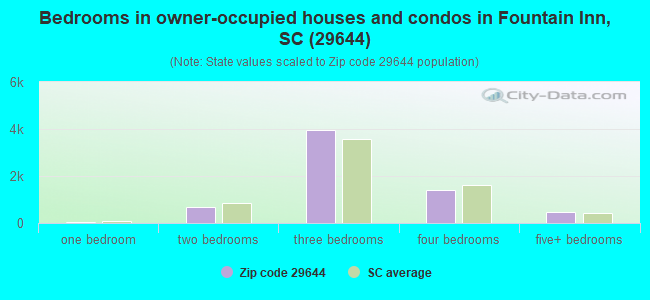
Median number of rooms in houses and condos:
Here:
6.2
State:
6.4
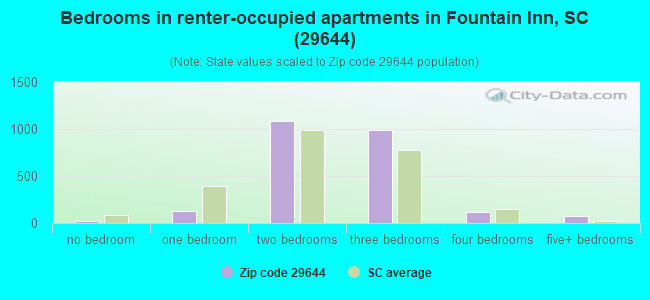
Median number of rooms in apartments:
Here:
4.8
State:
4.5
Notable locations in this zip code not listed on our city pages
Notable locations in zip code 29644: Fox Run Country Club (A), Canebreak Fire Department Headquarters (B), Laurens County Fire Department Durbin Creek (C), Dunklin Fire Department Station 2 (D), Fountain Inn Fire Department Headquarters (E), Laurens County Fire Department Durbin Creek Substation (F), Laurens County Fire Department Greenpond (G). Display/hide their locations on the map
Churches in zip code 29644 include: Shady Oak Church (A), New Liberty Church (B), New Harmony Church (C), New Durbin Church (D), Cedar Grove Church (E), Pine Grove Church (F), Pleasant Grove Church (G), Faith Church (H), Fairview Presbyterian Church (I). Display/hide their locations on the map
Cemeteries: Babb Cemetery (1), Unity Cemetery (2), Shady Oak Cemetery (3), Bethany Cemetery (4), Beulah Cemetery (5), Hillside Cemetery (6), Cedar Grove Cemetery (7). Display/hide their locations on the map
Streams, rivers, and creeks: Payne Branch (A), Martin Creek (B), Wilson Creek (C), Little Durbin Creek (D), Little Creek (E), Howard Branch (F), Buzzard Spring Branch (G), Arnold Creek (H). Display/hide their locations on the map
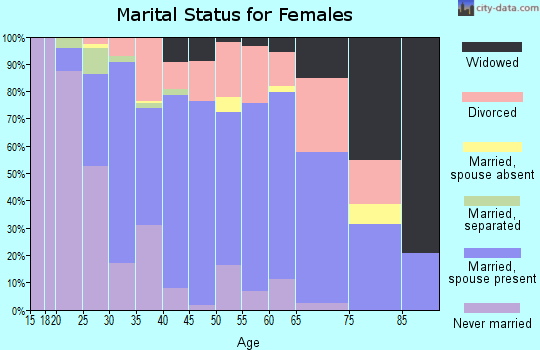
3,718 married couples with children.
1,350 single-parent households (132 men, 1,218 women).
89.5% of residents of 29644 zip code speak English at home.
8.1% of residents speak Spanish at home (69% very well, 15% well, 16% not well).
0.6% of residents speak other Indo-European language at home (78% very well, 5% well, 17% not well).
0.9% of residents speak Asian or Pacific Island language at home (13% very well, 87% well).
0.4% of residents speak other language at home (89% very well, 11% well).
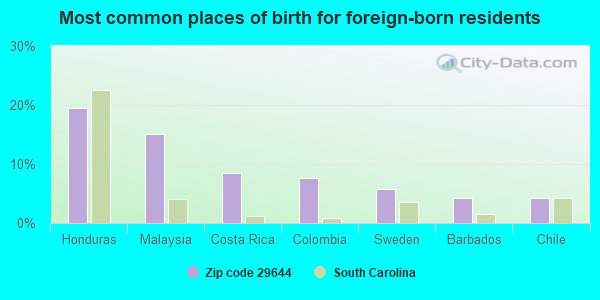
Foreign born population: 1,241 (5.6%) (66.3% of them are naturalized citizens)
This zip code:
5.6%
Whole state:
5.2%
20%Honduras
15%Malaysia
9%Costa Rica
8%Colombia
6%Sweden
4%Barbados
4%Chile
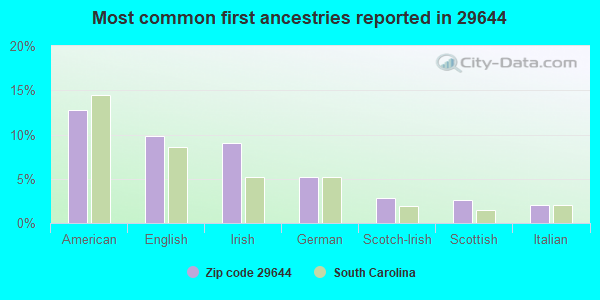
13%American
10%English
9%Irish
5%German
3%Scotch-Irish
3%Scottish
2%Italian
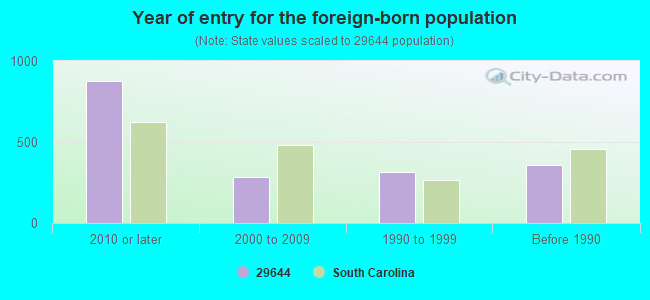
Year of entry for the foreign-born population
8742010 or later
2872000 to 2009
3141990 to 1999
355Before 1990
Major facilities with environmental interests located in this zip code:
FLOWERS BAKING COMPANY (1405 MAIN STREET in FOUNTAIN INN, SC)
AIR MINOR (AIRS/AFS) National Pollutant Discharge Elimination System NON-MAJOR (Tracking pollutant discharge elimination systems) - permit (Resource Conservation and Recovery Act (tracking hazardous waste)) STATE MASTER (South Carolina database) - AIR PROGRAM STATE MASTER (South Carolina database) - HAZARDOUS WASTE PROGRAM STATE MASTER (South Carolina database) - LABORATORY CERTIFICATION STATE MASTER (South Carolina database) - UNDERGROUND STORAGE TANK PROGRAM Business SIC classification: BREAD AND OTHER BAKERY PRODUCTS, EXCEPT COOKIES AND CRACKERS Organizations: OPERNAME (CONTACT/OPERATOR)
Alternative names: FLOWERS BAKING CO-FOUNTAIN INN, FLOWERS BAKING CO. OF FOUNT., FLOWERS BAKING COMPANY OF SOUTH-FOUNTAIN INN, FLOWERS BKING CO OF FT INN INC
EMITEC INCORPORATED (400 SOUTH NELSON DRIVE in FOUNTAIN INN, SC)
AIR MINOR (AIRS/AFS) ENFORCEMENT/COMPLIANCE ACTIVITY (Integrated Compliance Information System) - ICIS-04-2003-9910, FORMAL ENFORCEMENT ACTION (Integrated Compliance Information System) - ICIS-04-2003-9910, FORMAL ENFORCEMENT ACTION CRITERIA AND HAZARDOUS AIR POLLUTANT INVENTORY (Inventory of air pollution sources) STATE MASTER (South Carolina database) - AIR PROGRAM, TRI REPORTER (Tracking of toxic chemicals releasing facilities) Business SIC classification: FABRICATED METAL PRODUCTS; MOTORS AND GENERATORS Alternative names: EMITEC INC.
BIC CORPORATION (145 SOUTHCHASE BOULEVARD in FOUNTAIN INN, SC)
AIR MINOR (AIRS/AFS) CRITERIA AND HAZARDOUS AIR POLLUTANT INVENTORY (Inventory of air pollution sources) National Pollutant Discharge Elimination System NON-MAJOR (Tracking pollutant discharge elimination systems) - permit HAZARDOUS WASTE BIENNIAL REPORTER (Resource Conservation and Recovery Act (tracking hazardous waste)) Large Quantity Generators, more that 1000 kg of hazardous waste/month (Resource Conservation and Recovery Act (tracking hazardous waste)) STATE MASTER (South Carolina database) - AIR PROGRAM, TRI REPORTER, HAZARDOUS WASTE PROGRAM TRI REPORTER (Tracking of toxic chemicals releasing facilities) Business SIC classification: FABRICATED TEXTILE PRODUCTS; CYCLIC ORGANIC CRUDES AND INTERMEDIATES, AND ORGANIC DYES AND PIGMENTS; CHEMICALS AND CHEMICAL PREPARATIONS Business NAICS classification: SYNTHETIC ORGANIC DYE AND PIGMENT MANUFACTURING.; ALL OTHER MISCELLANEOUS CHEMICAL PRODUCT AND PREPARATION MANUFACTURING. Organizations: JACOBS ENGINEERING GROUP INC (CONTACT/ENGINEERING/CONSULTING FIRM)
, BIC USA INC (CONTACT/OWNER)
Alternative names: BIC CORP FOUNTAIN INN, BIC CORPORATION, R&D CENTER, BIC CONSUMER PRODS. MFG. CO. INC.
FORT DEARBORN COMPANY FOUNTAIN INN PLANT (100 NORTH WOODS DRIVE in FOUNTAIN INN, SC)
AIR MINOR (AIRS/AFS) CRITERIA AND HAZARDOUS AIR POLLUTANT INVENTORY (Inventory of air pollution sources) HAZARDOUS WASTE BIENNIAL REPORTER (Resource Conservation and Recovery Act (tracking hazardous waste)) Small Quantity Generators, between 100 kg and 1000 kg of hazardous waste/month (Resource Conservation and Recovery Act (tracking hazardous waste)) STATE MASTER (South Carolina database) - AIR MAJOR, AIR PROGRAM, TRI REPORTER, National Pollutant Discharge Elimination System Permit, HAZARDOUS WASTE PROGRAM, AIR PROGRAM TRI REPORTER (Tracking of toxic chemicals releasing facilities) Business SIC classification: COATED AND LAMINATED PAPER; COMMERCIAL PRINTING, LITHOGRAPHIC; BOOKBINDING AND RELATED WORK; PAINTS, VARNISHES, LACQUERS, ENAMELS, AND ALLIED PRODUCTS Business NAICS classification: COMMERCIAL LITHOGRAPHIC PRINTING.; COMMERCIAL LITHOGRAPHIC PRINTING. Organizations: ROGERS & CALCOTT ENGINEERS (CONTACT/ENGINEERING/CONSULTING FIRM)
, OPERNAME (CONTACT/OPERATOR)
, FT DEARBORN CO (CONTACT/OPERATOR)
Alternative names: FORT DEARBORN FOUNTAIN INN PLANT, SHERWIN WILLIAMS COMPANY FOUNTAIN INN
CAROLINA COMMERCIAL HEAT TREATING (100 SOUTH MAIN STREET in FOUNTAIN INN, SC)
AIR MINOR (AIRS/AFS) (Resource Conservation and Recovery Act (tracking hazardous waste)) STATE MASTER (South Carolina database) - AIR PROGRAM, UNDERGROUND STORAGE TANK PROGRAM, TRI REPORTER, National Pollutant Discharge Elimination System Permit TRI REPORTER (Tracking of toxic chemicals releasing facilities) Business SIC classification: METAL HEAT TREATING; PRIMARY METAL PRODUCTS Organizations: OPERNAME (CONTACT/OPERATOR)
, JAMES M HENDERSHOT (CONTACT/OWNER)
Alternative names: CAROLINA COMM. HEAT TREATING, CAROLINA COMMERCIAL HEAT TREATING - FOUNTAIN INN
BOSCH REXROTH CORPORATION (8 SOUTHCHASE COURT in FOUNTAIN INN, SC)
AIR SYNTHETIC MINOR (AIRS/AFS) AIR MINOR (AIRS/AFS) CRITERIA AND HAZARDOUS AIR POLLUTANT INVENTORY (Inventory of air pollution sources) Conditionally Exempt Small Quantity Generators, less than 100 kg/month of hazardous waste (Resource Conservation and Recovery Act (tracking hazardous waste)) STATE MASTER (South Carolina database) - HAZARDOUS WASTE PROGRAM, AIR PROGRAM, AIR MAJOR TRI REPORTER (Tracking of toxic chemicals releasing facilities) Business SIC classification: METAL HEAT TREATING; COATING, ENGRAVING, AND ALLIED SERVICES; FLUID POWER PUMPS AND MOTORS; GENERAL WAREHOUSING AND STORAGE Business NAICS classification: METAL HEAT TREATING. Organizations: RMT INC (CONTACT/ENGINEERING/CONSULTING FIRM)
Alternative names: BOSCH REXROTH GROUP, BOSCH REXWORTH CORPORATION, HOLLY OAK CHEMICAL, MANNESMANN REXROTH, REXROTH BOSCH GROUP, REXROTH:MAIN STREET, REXROTH:SOUTHCHASE COURT, REXWORTH CORPORATION
FOUNTAIN INN CITY OF (200 NORTH MAIN STREET in FOUNTAIN INN, SC)
(Integrated Compliance Information System) - ICIS-04-2002-4757, FORMAL ENFORCEMENT ACTION, ENFORCEMENT/COMPLIANCE ACTIVITY STATE MASTER (South Carolina database) - SCRAP TIRE MANAGEMENT, UNDERGROUND STORAGE TANK PROGRAM Business SIC classification: SEWERAGE SYSTEMS Alternative names: FOUTAIN INN, CITY OF
CINCINNATI MILACRON INCORPORATED FOUNTAIN INN DIVISION (110 MILACRON DR. in FOUNTAIN INN, SC)
(Resource Conservation and Recovery Act (tracking hazardous waste)) STATE MASTER (South Carolina database) - UNDERGROUND STORAGE TANK PROGRAM, AIR PROGRAM, TRI REPORTER, HAZARDOUS WASTE PROGRAM TRI REPORTER (Tracking of toxic chemicals releasing facilities) Business SIC classification: MACHINE TOOLS, METAL CUTTING TYPES Organizations: OPERNAME (CONTACT/OPERATOR)
, OWNERNAME (CONTACT/OWNER)
Alternative names: CINCINNATI MILACRON:FOUNTAIN INN-CLOSED, CINCINNATI MILACRON FOUNTAIN INN DIV
CATERPILLAR INCORPORATED (107 S CHASE BLVD in FOUNTAIN INN, SC)
AIR MAJOR (AIRS/AFS) Small Quantity Generators, between 100 kg and 1000 kg of hazardous waste/month (Resource Conservation and Recovery Act (tracking hazardous waste)) STATE MASTER (South Carolina database) - AIR PROGRAM, AIR MAJOR, HAZARDOUS WASTE PROGRAM TRI REPORTER (Tracking of toxic chemicals releasing facilities) Business SIC classification: INTERNAL COMBUSTION ENGINES Business NAICS classification: OTHER ENGINE EQUIPMENT MANUFACTURING. Organizations: MACTEC ENGINEERING & CONSULTING INC (CONTACT/ENGINEERING/CONSULTING FIRM)
, MICHAEL J ADAMS (CONTACT/OPERATOR)
Alternative names: CATERPILLAR INC. GREENVILLE FACILITY, CATERPILLAR:FOUNTAIN INN, CATERPILLAR INC., CATERPILLAR INC. GREENVILLE FACILITY
DAN RIVER INC FOUNTAIN INN PLANT (FAIRVIEW ST in FOUNTAIN INN, SC)
(Resource Conservation and Recovery Act (tracking hazardous waste)) STATE MASTER (South Carolina database) - National Pollutant Discharge Elimination System Permit, HAZARDOUS WASTE PROGRAM Organizations: OPERNAME (CONTACT/OPERATOR)
, OWNERNAME (CONTACT/OWNER)
Alternative names: DAN RIVER INC WOODSIDE DIV FT INN PLT
BRYSON MIDDLE SCHOOL (BOX 338 BRYSON DR in FOUNTAIN INN, SC)
(Resource Conservation and Recovery Act (tracking hazardous waste)) STATE MASTER (South Carolina database) - HAZARDOUS WASTE PROGRAM Organizations: OPERNAME (CONTACT/OPERATOR)
, SCHOOL DIST OF GREENVILLE (CONTACT/OWNER)
EUROKERA NORTH AMERICA (140 SOUTHCHASE BLVD TRACT NO 8 in FOUNTAIN INN, SC)
AIR MINOR (AIRS/AFS) Conditionally Exempt Small Quantity Generators, less than 100 kg/month of hazardous waste (Resource Conservation and Recovery Act (tracking hazardous waste)) - notification STATE MASTER (South Carolina database) - AIR PROGRAM, HAZARDOUS WASTE PROGRAM Business SIC classification: GLASS PRODUCTS, MADE OF PURCHASED GLASS Organizations: CORNING INC (CONTACT/OWNER)
ALLCOAST FINANCIAL (1194 STEWART ROAD in FOUNTAIN INN, SC)
(Resource Conservation and Recovery Act (tracking hazardous waste)) STATE MASTER (South Carolina database) - HAZARDOUS WASTE PROGRAM Organizations: ALLACOAST FINANCIAL (CONTACT/OWNER)
Housing units lacking complete plumbing facilities: 1.0% Housing units lacking complete kitchen facilities: 1.4%
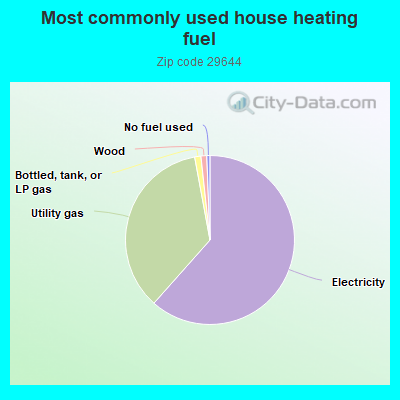
61.5%Electricity
35.5%Utility gas
1.2%Bottled, tank, or LP gas
1.1%Wood
0.6%No fuel used
Population in 1990: 15,233. Population change in the 1990s: +747 (+4.9%).
Place of birth for U.S.-born residents:
This state: 13,332
Northeast: 1,956
Midwest: 1,586
South: 2,943
West: 627
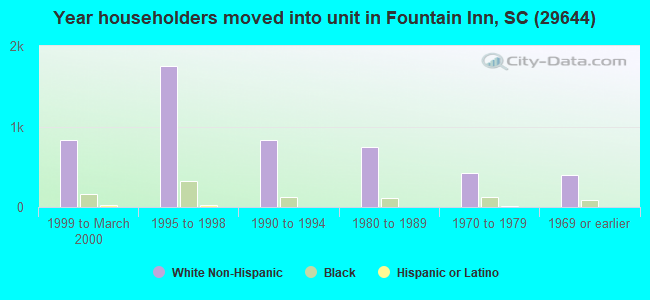
55% of the 29644 zip code residents lived in the same house 5 years ago. Out of people who lived in different houses, 40% lived in this county. Out of people who lived in different counties, 50% lived in South Carolina.
87% of the 29644 zip code residents lived in the same house 1 year ago. Out of people who lived in different houses, 43% moved from this county. Out of people who lived in different houses, 25% moved from different county within same state. Out of people who lived in different houses, 31% moved from different state. Out of people who lived in different houses, 0% moved from abroad.
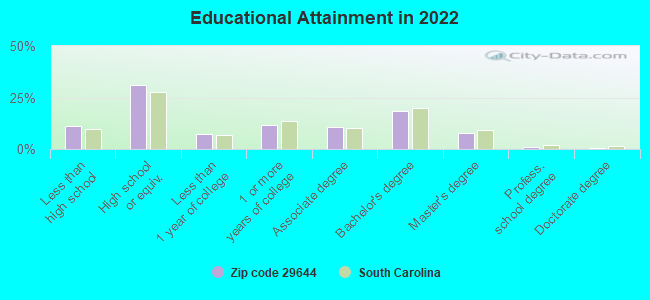
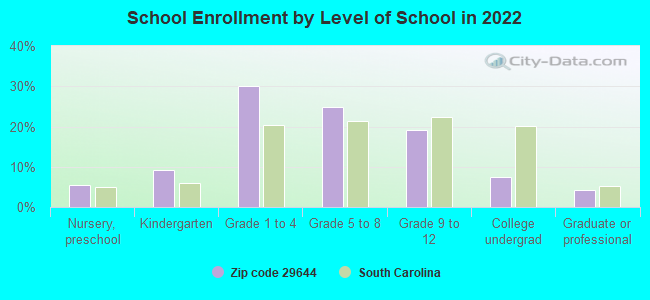
Private vs. public school enrollment:
Students in private schools in grades 1 to 8 (elementary and middle school): 533
Here:
20.0%
South Carolina:
14.4%
Students in private schools in grades 9 to 12 (high school): 189
Here:
20.5%
South Carolina:
11.1%
Students in private undergraduate colleges: 123
Here:
33.8%
South Carolina:
21.9%
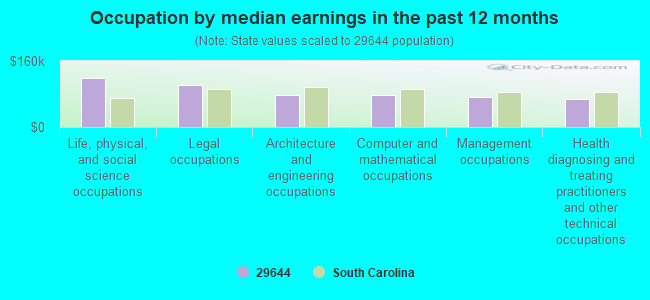
Occupation by median earnings in the past 12 months ($)
119,758Life, physical, and social science occupations
101,744Legal occupations
78,692Architecture and engineering occupations
78,490Computer and mathematical occupations
73,375Management occupations
67,264Health diagnosing and treating practitioners and other technical occupations
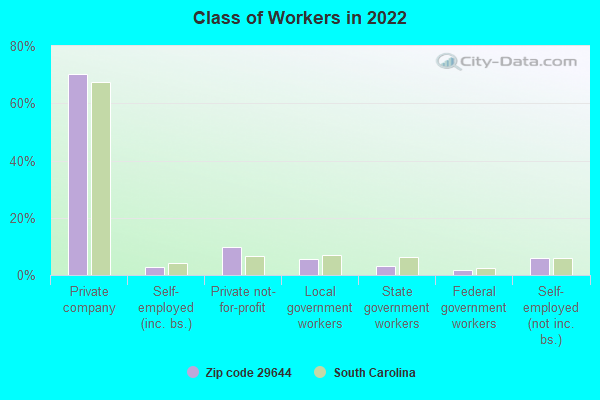
Top industries in this zip code by the number of employees in 2005:
Administrative and Support and Waste Management and Remediation Services: Temporary Help Services (over 1000 employees: 1 establishment)
People in group quarters in 2010:
56 people in nursing facilities/skilled-nursing facilities
45 people in group homes for juveniles (non-correctional)
20 people in residential treatment centers for adults
People in group quarters in 2000:
45 people in other group homes
44 people in nursing homes
43 people in homes for abused, dependent, and neglected children
16 people in other noninstitutional group quarters
Fatal accident statistics in 2014:
Fatal accident count: 4
Vehicles involved in fatal accidents: 5
Fatal accidents caused by drunken drivers: 3
Fatalities: 4
Persons involved in fatal accidents: 6
Pedestrians involved in fatal accidents: 1
Fatal accident statistics in 2013:
Fatal accident count: 5
Vehicles involved in fatal accidents: 9
Fatal accidents caused by drunken drivers: 2
Fatalities: 6
Persons involved in fatal accidents: 16
Pedestrians involved in fatal accidents: 0
Home Mortgage Disclosure Act Aggregated Statistics For Year 2009 (Based on 8 partial tracts)
A) FHA, FSA/RHS & VA Home Purchase Loans
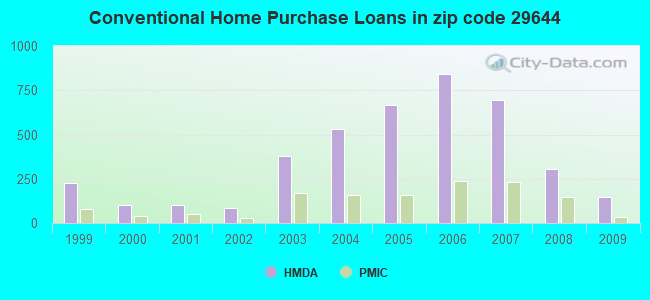
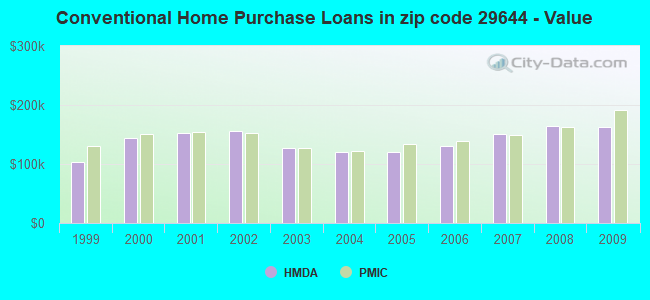
B) Conventional Home Purchase Loans
C) Refinancings
D) Home Improvement Loans
F) Non-occupant Loans on < 5 Family Dwellings (A B C & D)
G) Loans On Manufactured Home Dwelling (A B C & D)
Number
Average Value
Number
Average Value
Number
Average Value
Number
Average Value
Number
Average Value
Number
Average Value
LOANS ORIGINATED
161
$140,257
149
$162,630
663
$159,446
25
$57,380
36
$103,055
33
$68,232
APPLICATIONS APPROVED, NOT ACCEPTED
11
$124,123
13
$114,701
47
$166,371
7
$19,230
4
$108,000
8
$56,228
APPLICATIONS DENIED
33
$127,877
33
$267,058
249
$154,104
22
$40,782
18
$124,030
37
$52,441
APPLICATIONS WITHDRAWN
16
$152,874
26
$209,197
189
$157,844
11
$77,095
7
$163,216
15
$130,661
FILES CLOSED FOR INCOMPLETENESS
4
$127,052
7
$167,700
43
$150,280
3
$147,293
0
$0
2
$60,905
Aggregated Statistics For Year 2008 (Based on 8 partial tracts)
A) FHA, FSA/RHS & VA Home Purchase Loans
B) Conventional Home Purchase Loans
C) Refinancings
D) Home Improvement Loans
F) Non-occupant Loans on < 5 Family Dwellings (A B C & D)
G) Loans On Manufactured Home Dwelling (A B C & D)
Number
Average Value
Number
Average Value
Number
Average Value
Number
Average Value
Number
Average Value
Number
Average Value
LOANS ORIGINATED
199
$128,512
305
$163,852
420
$151,134
45
$54,895
83
$102,743
74
$67,073
APPLICATIONS APPROVED, NOT ACCEPTED
7
$146,646
37
$128,050
52
$139,541
7
$24,164
10
$112,250
14
$54,200
APPLICATIONS DENIED
44
$130,117
72
$135,039
348
$140,957
56
$55,556
33
$120,241
60
$71,216
APPLICATIONS WITHDRAWN
12
$123,912
35
$205,983
153
$158,162
13
$68,971
6
$196,060
8
$70,361
FILES CLOSED FOR INCOMPLETENESS
10
$142,022
13
$146,353
18
$166,241
7
$17,096
6
$110,015
4
$81,698
Aggregated Statistics For Year 2007 (Based on 8 partial tracts)
A) FHA, FSA/RHS & VA Home Purchase Loans
B) Conventional Home Purchase Loans
C) Refinancings
D) Home Improvement Loans
E) Loans on Dwellings For 5+ Families
F) Non-occupant Loans on < 5 Family Dwellings (A B C & D)
G) Loans On Manufactured Home Dwelling (A B C & D)
Number
Average Value
Number
Average Value
Number
Average Value
Number
Average Value
Number
Average Value
Number
Average Value
Number
Average Value
LOANS ORIGINATED
78
$125,483
695
$151,646
392
$129,224
91
$41,524
2
$103,610
167
$101,098
97
$66,099
APPLICATIONS APPROVED, NOT ACCEPTED
1
$115,220
76
$139,792
93
$115,677
24
$35,912
0
$0
23
$110,490
15
$49,860
APPLICATIONS DENIED
13
$123,258
145
$149,298
454
$123,718
68
$50,120
0
$0
41
$128,643
74
$63,641
APPLICATIONS WITHDRAWN
6
$132,543
62
$181,623
188
$141,194
16
$94,956
0
$0
12
$112,373
10
$84,046
FILES CLOSED FOR INCOMPLETENESS
1
$167,480
23
$196,477
56
$145,371
7
$51,581
0
$0
4
$152,940
2
$91,710
Aggregated Statistics For Year 2006 (Based on 8 partial tracts)
A) FHA, FSA/RHS & VA Home Purchase Loans
B) Conventional Home Purchase Loans
C) Refinancings
D) Home Improvement Loans
E) Loans on Dwellings For 5+ Families
F) Non-occupant Loans on < 5 Family Dwellings (A B C & D)
G) Loans On Manufactured Home Dwelling (A B C & D)
Number
Average Value
Number
Average Value
Number
Average Value
Number
Average Value
Number
Average Value
Number
Average Value
Number
Average Value
LOANS ORIGINATED
90
$110,028
844
$130,817
399
$118,167
90
$39,064
2
$643,350
192
$106,045
113
$64,826
APPLICATIONS APPROVED, NOT ACCEPTED
6
$84,255
92
$90,557
115
$97,015
17
$43,666
0
$0
24
$78,516
43
$59,096
APPLICATIONS DENIED
26
$94,075
198
$89,283
470
$115,161
100
$35,153
0
$0
40
$104,935
125
$60,846
APPLICATIONS WITHDRAWN
3
$117,867
74
$126,098
217
$119,073
20
$67,800
0
$0
14
$119,947
12
$55,807
FILES CLOSED FOR INCOMPLETENESS
0
$0
34
$121,176
63
$121,946
1
$68,680
0
$0
3
$118,540
4
$90,188
Aggregated Statistics For Year 2005 (Based on 8 partial tracts)
A) FHA, FSA/RHS & VA Home Purchase Loans
B) Conventional Home Purchase Loans
C) Refinancings
D) Home Improvement Loans
E) Loans on Dwellings For 5+ Families
F) Non-occupant Loans on < 5 Family Dwellings (A B C & D)
G) Loans On Manufactured Home Dwelling (A B C & D)
Number
Average Value
Number
Average Value
Number
Average Value
Number
Average Value
Number
Average Value
Number
Average Value
Number
Average Value
LOANS ORIGINATED
65
$107,763
665
$120,338
462
$117,036
66
$34,370
2
$733,890
114
$90,471
87
$63,963
APPLICATIONS APPROVED, NOT ACCEPTED
5
$60,116
84
$105,458
93
$103,841
14
$46,459
0
$0
14
$86,720
30
$44,193
APPLICATIONS DENIED
29
$92,165
214
$90,214
471
$96,183
105
$40,383
0
$0
35
$83,673
184
$61,136
APPLICATIONS WITHDRAWN
8
$137,061
99
$100,213
224
$124,533
38
$112,520
0
$0
19
$120,138
38
$68,065
FILES CLOSED FOR INCOMPLETENESS
1
$51,890
29
$104,803
111
$120,616
6
$32,090
0
$0
6
$97,465
10
$72,552
Aggregated Statistics For Year 2004 (Based on 8 partial tracts)
A) FHA, FSA/RHS & VA Home Purchase Loans
B) Conventional Home Purchase Loans
C) Refinancings
D) Home Improvement Loans
E) Loans on Dwellings For 5+ Families
F) Non-occupant Loans on < 5 Family Dwellings (A B C & D)
G) Loans On Manufactured Home Dwelling (A B C & D)
Number
Average Value
Number
Average Value
Number
Average Value
Number
Average Value
Number
Average Value
Number
Average Value
Number
Average Value
LOANS ORIGINATED
112
$114,890
530
$120,539
533
$116,674
68
$35,110
0
$0
109
$79,159
118
$53,253
APPLICATIONS APPROVED, NOT ACCEPTED
2
$103,990
76
$92,440
105
$97,212
16
$27,814
0
$0
10
$71,655
50
$67,005
APPLICATIONS DENIED
30
$103,751
167
$81,657
448
$104,570
67
$47,992
0
$0
33
$103,605
173
$63,725
APPLICATIONS WITHDRAWN
10
$127,155
56
$107,016
212
$125,709
20
$50,158
2
$107,925
18
$102,862
21
$72,246
FILES CLOSED FOR INCOMPLETENESS
1
$70,930
11
$120,154
56
$130,570
1
$48,600
0
$0
0
$0
5
$76,640
Aggregated Statistics For Year 2003 (Based on 6 partial tracts)
A) FHA, FSA/RHS & VA Home Purchase Loans
B) Conventional Home Purchase Loans
C) Refinancings
D) Home Improvement Loans
F) Non-occupant Loans on < 5 Family Dwellings (A B C & D)
Number
Average Value
Number
Average Value
Number
Average Value
Number
Average Value
Number
Average Value
LOANS ORIGINATED
53
$121,277
380
$127,045
981
$123,961
48
$32,618
58
$74,317
APPLICATIONS APPROVED, NOT ACCEPTED
2
$110,975
41
$128,770
125
$105,881
9
$11,993
14
$99,685
APPLICATIONS DENIED
4
$118,795
66
$90,399
306
$106,319
31
$16,859
19
$81,519
APPLICATIONS WITHDRAWN
16
$128,595
53
$124,285
186
$116,373
0
$0
6
$100,887
FILES CLOSED FOR INCOMPLETENESS
4
$111,068
5
$145,480
30
$105,770
1
$15,870
1
$39,990
Aggregated Statistics For Year 2002 (Based on 2 partial tracts)
A) FHA, FSA/RHS & VA Home Purchase Loans
B) Conventional Home Purchase Loans
C) Refinancings
D) Home Improvement Loans
F) Non-occupant Loans on < 5 Family Dwellings (A B C & D)
Number
Average Value
Number
Average Value
Number
Average Value
Number
Average Value
Number
Average Value
LOANS ORIGINATED
10
$115,026
83
$156,719
173
$161,357
4
$44,118
8
$209,484
APPLICATIONS APPROVED, NOT ACCEPTED
0
$0
8
$165,881
14
$155,776
1
$19,040
0
$0
APPLICATIONS DENIED
1
$162,190
9
$130,663
32
$122,239
3
$23,170
1
$47,290
APPLICATIONS WITHDRAWN
2
$143,145
16
$145,806
28
$134,623
0
$0
1
$53,010
FILES CLOSED FOR INCOMPLETENESS
0
$0
2
$146,640
9
$174,781
0
$0
0
$0
Aggregated Statistics For Year 2001 (Based on 2 partial tracts)
A) FHA, FSA/RHS & VA Home Purchase Loans
B) Conventional Home Purchase Loans
C) Refinancings
D) Home Improvement Loans
F) Non-occupant Loans on < 5 Family Dwellings (A B C & D)
Number
Average Value
Number
Average Value
Number
Average Value
Number
Average Value
Number
Average Value
LOANS ORIGINATED
16
$119,918
103
$151,951
134
$148,633
5
$57,576
7
$95,491
APPLICATIONS APPROVED, NOT ACCEPTED
0
$0
4
$121,565
12
$150,051
1
$6,030
1
$46,980
APPLICATIONS DENIED
2
$108,710
9
$107,528
36
$132,312
2
$21,585
0
$0
APPLICATIONS WITHDRAWN
3
$102,310
6
$147,485
15
$114,073
0
$0
0
$0
FILES CLOSED FOR INCOMPLETENESS
0
$0
1
$212,660
5
$80,492
0
$0
0
$0
Aggregated Statistics For Year 2000 (Based on 2 partial tracts)
A) FHA, FSA/RHS & VA Home Purchase Loans
B) Conventional Home Purchase Loans
C) Refinancings
D) Home Improvement Loans
F) Non-occupant Loans on < 5 Family Dwellings (A B C & D)
Number
Average Value
Number
Average Value
Number
Average Value
Number
Average Value
Number
Average Value
LOANS ORIGINATED
15
$104,573
103
$143,936
29
$114,702
7
$22,536
6
$106,700
APPLICATIONS APPROVED, NOT ACCEPTED
0
$0
10
$105,789
7
$114,899
3
$22,960
0
$0
APPLICATIONS DENIED
2
$105,855
16
$86,769
23
$96,545
5
$35,930
1
$74,910
APPLICATIONS WITHDRAWN
3
$104,743
10
$132,991
10
$85,254
0
$0
0
$0
FILES CLOSED FOR INCOMPLETENESS
0
$0
1
$172,980
2
$92,520
0
$0
0
$0
Aggregated Statistics For Year 1999 (Based on 2 partial tracts)
A) FHA, FSA/RHS & VA Home Purchase Loans
B) Conventional Home Purchase Loans
C) Refinancings
D) Home Improvement Loans
E) Loans on Dwellings For 5+ Families
F) Non-occupant Loans on < 5 Family Dwellings (A B C & D)
2002 - 2018 National Fire Incident Reporting System (NFIRS) incidents
Based on the data from the years 2002 - 2018 the average number of fires per year is 81. The highest number of fire incidents - 162 took place in 2011, and the least - 0 in 2007. The data has a growing trend.
When looking into fire subcategories, the most incidents belonged to: Outside Fires (45.4%), and Structure Fires (32.8%).
Fire incident types reported to NFIRS in Zip Code 29644


 Nearest zip codes: 29680, 29645, 29681, 29662, 29388, 29607.


 Based on the data from the years 2002 - 2018 the average number of fires per year is 81. The highest number of fire incidents - 162 took place in 2011, and the least - 0 in 2007. The data has a growing trend.
 When looking into fire subcategories, the most incidents belonged to: Outside Fires (45.4%), and Structure Fires (32.8%).