Estimated zip code population in 2022: 6,240 Zip code population in 2010: 5,146 Zip code population in 2000: 4,421
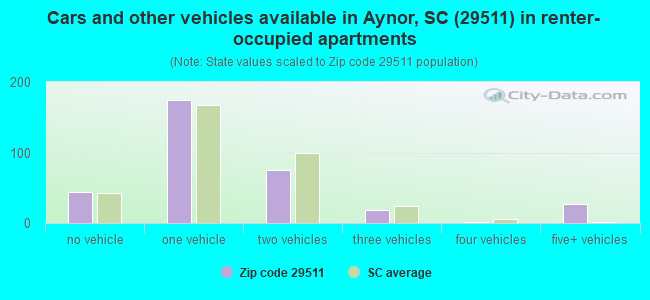
Houses and condos: 2,455 Renter-occupied apartments: 338
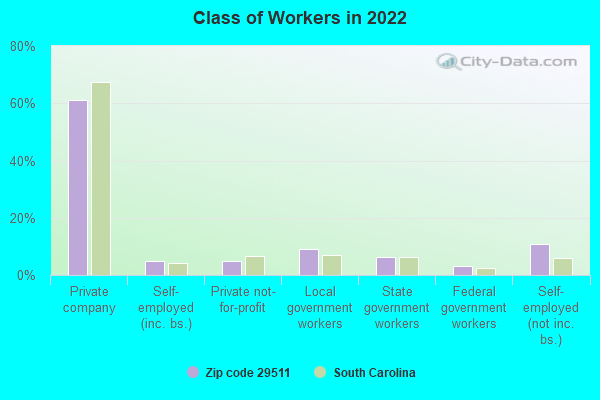
% of renters here:
15%
State:
28%
March 2022 cost of living index in zip code 29511: 80.8 (low, U.S. average is 100)
Land area: 61.4 sq. mi. Water area: 0.1 sq. mi.
Population density: 102 people per square mile
(very low).
OSM Map
General Map
Google Map
MSN Map
OSM Map
General Map
Google Map
MSN Map
OSM Map
General Map
Google Map
MSN Map
OSM Map
General Map
Google Map
MSN Map
Please wait while loading the map...
Real estate property taxes paid for housing units in 2022:
This zip code:
0.3% ($694)
South Carolina:
0.5% ($1,185)
Median real estate property taxes paid for housing units with mortgages in 2022: $797 (0.3%) Median real estate property taxes paid for housing units with no mortgage in 2022: $550 (0.3%)
Business Search- 14 Million verified businesses
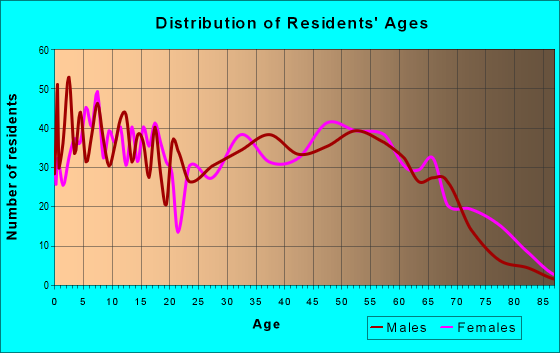
Males: 3,168
(50.8%)
Females: 3,070
(49.2%)
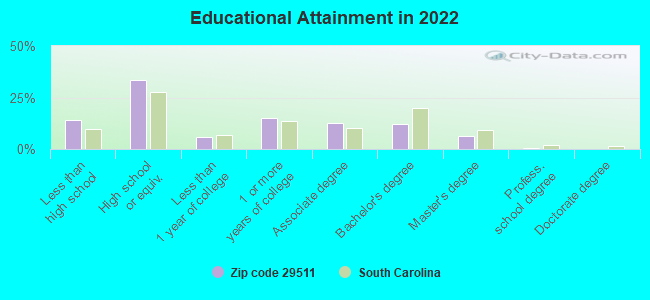
For population 25 years and over in 29511:
High school or higher: 84.0%
Bachelor's degree or higher: 18.6%
Graduate or professional degree: 6.9%
Unemployed: 5.8%
Mean travel time to work (commute): 27.7 minutes
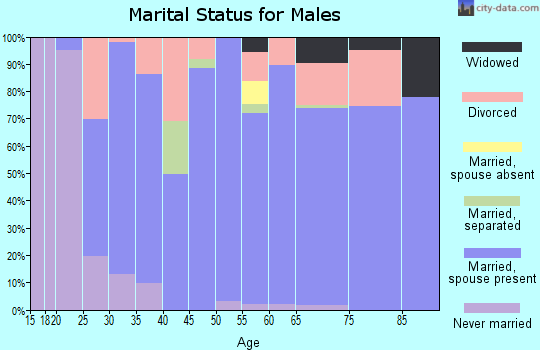
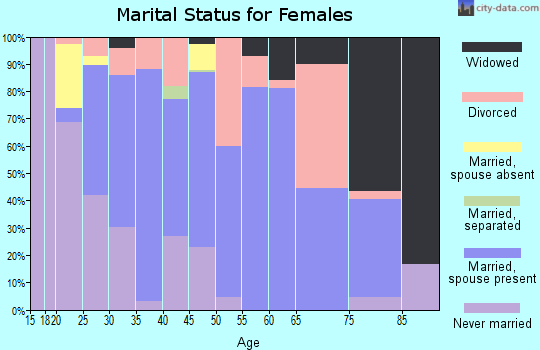
For population 15 years and over in 29511:
Never married: 30.1%
Now married: 55.5%
Separated: 1.6%
Widowed: 5.6%
Divorced: 7.3%
Zip code 29511 compared to state average:
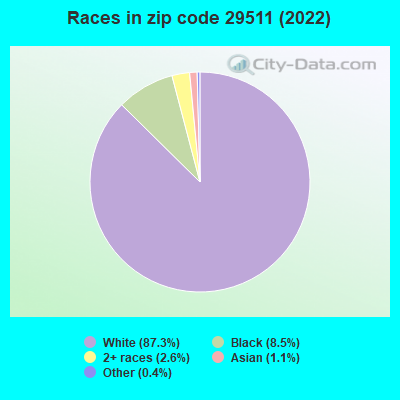
Black race population percentage significantly below state average.
Hispanic race population percentage significantly below state average.
Foreign-born population percentage significantly below state average.
Renting percentage below state average.
Length of stay since moving in significantly above state average.
Percentage of population with a bachelor's degree or higher below state average.
Averages for the 2020 tax year for zip code 29511, filed in 2021:
Average Adjusted Gross Income (AGI) in 2020: $54,267 (Individual Income Tax Returns)
Here:
$54,267
State:
$65,754
Salary/wage: $43,245 (reported on 81.5% of returns)
Here:
$43,245
State:
$52,566
(% of AGI for various income ranges: 1174.1% for AGIs below $25k, 3695.6% for AGIs $25k-50k, 6950.9% for AGIs $50k-75k, 10202.7% for AGIs $75k-100k, 15445.6% for AGIs $100k-200k)
Taxable interest for individuals: $1,715 (reported on 21.8% of returns)
This zip code:
$1,715
South Carolina:
$1,749
(% of AGI for various income ranges: 9.5% for AGIs below $25k, 24.4% for AGIs $25k-50k, 61.8% for AGIs $50k-75k, 44.7% for AGIs $75k-100k, 114.4% for AGIs $100k-200k)
Ordinary dividends: $3,731 (reported on 10.7% of returns)
Here:
$3,731
State:
$8,783
(% of AGI for various income ranges: 8.2% for AGIs below $25k, 43.3% for AGIs $25k-50k, 56.4% for AGIs $50k-75k, 46.7% for AGIs $75k-100k, 116.1% for AGIs $100k-200k)
Net capital gain/loss in AGI: +$42,541 (reported on 10.7% of returns)
Here:
+$42,541
State:
+$24,194
(% of AGI for various income ranges: 3.2% for AGIs below $25k, 16.5% for AGIs $25k-50k, 68.2% for AGIs $50k-75k, 154.7% for AGIs $75k-100k, 456.7% for AGIs $100k-200k)
Profit/loss from business: +$11,624 (reported on 16.6% of returns)
Here:
+$11,624
State:
+$11,253
(% of AGI for various income ranges: 173.9% for AGIs below $25k, 129.3% for AGIs $25k-50k, 342.3% for AGIs $50k-75k, 474.0% for AGIs $75k-100k, 925.0% for AGIs $100k-200k)
Taxable individual retirement arrangement distribution: $19,944 (reported on 6.6% of returns)
29511:
$19,944
South Carolina:
$21,604
(% of AGI for various income ranges: 52.6% for AGIs below $25k, 78.0% for AGIs $25k-50k, 241.4% for AGIs $50k-75k, 448.0% for AGIs $75k-100k, 853.9% for AGIs $100k-200k)
Total itemized deductions: $41,290 (reported on 3.7% of returns)
Here:
$41,290
State:
$35,199
(% of AGI for various income ranges: 460.0% for AGIs $50k-75k, 792.8% for AGIs $100k-200k)
Charity contributions: $21,825 (reported on 3.0% of returns)
Here:
$21,825
State:
$14,319
(% of AGI for various income ranges: 22.9% for AGIs $25k-50k, 900.0% for AGIs $100k-200k)
Taxes paid: $6,870 (reported on 3.7% of returns)
29511:
$6,870
State:
$7,486
(% of AGI for various income ranges: 84.1% for AGIs $50k-75k, 179.4% for AGIs $100k-200k)
Earned income credit: $2,555 (reported on 21.4% of returns)
Here:
$2,555
State:
$2,397
(% of AGI for various income ranges: 123.5% for AGIs below $25k, 89.8% for AGIs $25k-50k)
Percentage of individuals using paid preparers for their 2020 taxes: 94.5%
Here:
94%
State:
93%
(% for various income ranges: 93.3% for AGIs below $25k, 94.4% for AGIs $25k-50k, 94.1% for AGIs $50k-75k, 95.8% for AGIs $75k-100k, 96.7% for AGIs $100k-200k, 100.0% for AGIs over 200k)
Averages for the 2012 tax year for zip code 29511, filed in 2013:
Average Adjusted Gross Income (AGI) in 2012: $43,867 (Individual Income Tax Returns)
Here:
$43,867
State:
$51,133
Salary/wage: $35,374 (reported on 84.7% of returns)
Here:
$35,374
State:
$42,173
(% of AGI for various income ranges: 73.9% for AGIs below $25k, 81.8% for AGIs $25k-50k, 77.3% for AGIs $50k-75k, 77.2% for AGIs $75k-100k, 81.8% for AGIs $100k-200k)
Taxable interest for individuals: $2,241 (reported on 27.4% of returns)
This zip code:
$2,241
South Carolina:
$1,468
(% of AGI for various income ranges: 1.2% for AGIs below $25k, 0.8% for AGIs $25k-50k, 0.7% for AGIs $50k-75k, 0.6% for AGIs $75k-100k, 0.4% for AGIs $100k-200k, 5.9% for AGIs over 200k)
Ordinary dividends: $2,132 (reported on 10.2% of returns)
Here:
$2,132
State:
$6,511
(% of AGI for various income ranges: 1.0% for AGIs below $25k, 0.3% for AGIs $25k-50k, 0.2% for AGIs $50k-75k, 0.2% for AGIs $75k-100k, 1.2% for AGIs $100k-200k)
Net capital gain/loss in AGI: +$22,686 (reported on 13.0% of returns)
Here:
+$22,686
State:
+$13,061
(% of AGI for various income ranges: 1.1% for AGIs below $25k, 0.5% for AGIs $25k-50k, 0.4% for AGIs $50k-75k, 0.6% for AGIs $75k-100k, 4.2% for AGIs $100k-200k, 40.9% for AGIs over 200k)
Profit/loss from business: +$7,814 (reported on 17.2% of returns)
Here:
+$7,814
State:
+$10,167
(% of AGI for various income ranges: 9.8% for AGIs below $25k, 2.8% for AGIs $25k-50k, 2.2% for AGIs $50k-75k, 1.8% for AGIs $75k-100k, 2.6% for AGIs $100k-200k)
Taxable individual retirement arrangement distribution: $13,173 (reported on 7.0% of returns)
29511:
$13,173
South Carolina:
$17,019
(% of AGI for various income ranges: 1.6% for AGIs below $25k, 1.2% for AGIs $25k-50k, 4.6% for AGIs $50k-75k, 4.0% for AGIs $100k-200k)
Total itemized deductions: $22,750 (23% of AGI, reported on 23.3% of returns)
Here:
$22,750
State:
$22,890
Here:
23.4% of AGI
State:
21.4% of AGI
(% of AGI for various income ranges: 4.8% for AGIs below $25k, 7.3% for AGIs $25k-50k, 12.2% for AGIs $50k-75k, 14.0% for AGIs $75k-100k, 15.7% for AGIs $100k-200k, 19.3% for AGIs over 200k)
Charity contributions: $5,474 (reported on 19.5% of returns)
Here:
$5,474
State:
$5,169
(% of AGI for various income ranges: 0.7% for AGIs below $25k, 1.3% for AGIs $25k-50k, 1.9% for AGIs $50k-75k, 3.2% for AGIs $75k-100k, 6.5% for AGIs $100k-200k)
Taxes paid: $6,602 (reported on 23.3% of returns)
29511:
$6,602
State:
$7,644
(% of AGI for various income ranges: 0.7% for AGIs below $25k, 1.8% for AGIs $25k-50k, 2.8% for AGIs $50k-75k, 4.5% for AGIs $75k-100k, 5.8% for AGIs $100k-200k, 5.7% for AGIs over 200k)
Earned income credit: $2,448 (reported on 27.9% of returns)
Here:
$2,448
State:
$2,418
(% of AGI for various income ranges: 8.7% for AGIs below $25k, 2.0% for AGIs $25k-50k)
Percentage of individuals using paid preparers for their 2012 taxes: 68.8%
Here:
69%
State:
57%
(% for various income ranges: 65.3% for AGIs below $25k, 70.2% for AGIs $25k-50k, 71.4% for AGIs $50k-75k, 73.3% for AGIs $75k-100k, 73.3% for AGIs $100k-200k, 100.0% for AGIs over 200k)
Averages for the 2004 tax year for zip code 29511, filed in 2005:
Average Adjusted Gross Income (AGI) in 2004: $34,665 (Individual Income Tax Returns)
Here:
$34,665
State:
$41,965
Salary/wage: $29,890 (reported on 86.7% of returns)
Here:
$29,890
State:
$35,695
(% of AGI for various income ranges: 106.1% for AGIs below $10k, 81.5% for AGIs $10k-25k, 83.9% for AGIs $25k-50k, 82.9% for AGIs $50k-75k, 80.6% for AGIs $75k-100k, 41.1% for AGIs over 100k)
Taxable interest for individuals: $1,370 (reported on 32.8% of returns)
This zip code:
$1,370
South Carolina:
$1,623
(% of AGI for various income ranges: 4.5% for AGIs below $10k, 1.9% for AGIs $10k-25k, 1.2% for AGIs $25k-50k, 0.8% for AGIs $50k-75k, 0.6% for AGIs $75k-100k, 1.6% for AGIs over 100k)
Taxable dividends: $1,946 (reported on 9.9% of returns)
Here:
$1,946
State:
$3,999
(% of AGI for various income ranges: 0.7% for AGIs below $10k, 0.3% for AGIs $10k-25k, 0.1% for AGIs $25k-50k, 0.2% for AGIs $50k-75k, 0.6% for AGIs $75k-100k, 1.6% for AGIs over 100k)
Net capital gain/loss: +$13,035 (reported on 8.3% of returns)
Here:
+$13,035
State:
+$13,100
(% of AGI for various income ranges: -0.2% for AGIs below $10k, 1.3% for AGIs $10k-25k, 0.4% for AGIs $25k-50k, 0.7% for AGIs $50k-75k, 3.7% for AGIs $75k-100k, 10.9% for AGIs over 100k)
Profit/loss from business: +$8,384 (reported on 17.6% of returns)
Here:
+$8,384
State:
+$9,144
(% of AGI for various income ranges: 2.9% for AGIs below $10k, 5.3% for AGIs $10k-25k, 4.3% for AGIs $25k-50k, 3.3% for AGIs $50k-75k, 4.7% for AGIs $75k-100k, 4.3% for AGIs over 100k)
IRA payment deduction: $2,818 (reported on 1.1% of returns)
29511:
$2,818
South Carolina:
$2,972
Total itemized deductions: $16,431 (23% of AGI, reported on 23.3% of returns)
Here:
$16,431
State:
$19,039
Here:
23.0% of AGI
State:
22.8% of AGI
(% of AGI for various income ranges: 7.8% for AGIs below $10k, 5.9% for AGIs $10k-25k, 9.2% for AGIs $25k-50k, 14.4% for AGIs $50k-75k, 15.3% for AGIs $75k-100k, 11.3% for AGIs over 100k)
Charity contributions deductions: $3,399 (5% of AGI, reported on 20.4% of returns)
Here:
$3,399
State:
$4,305
Here:
5.1% of AGI
State:
5.0% of AGI
(% of AGI for various income ranges: 0.5% for AGIs below $10k, 1.1% for AGIs $10k-25k, 1.5% for AGIs $25k-50k, 2.5% for AGIs $50k-75k, 3.1% for AGIs $75k-100k, 2.3% for AGIs over 100k)
Total tax: $4,286 (reported on 70.0% of returns)
29511:
$4,286
State:
$6,497
(% of AGI for various income ranges: 3.7% for AGIs below $10k, 4.0% for AGIs $10k-25k, 6.2% for AGIs $25k-50k, 8.1% for AGIs $50k-75k, 10.3% for AGIs $75k-100k, 15.6% for AGIs over 100k)
Earned income credit: $1,878 (reported on 24.3% of returns)
Here:
$1,878
State:
$1,882
Percentage of individuals using paid preparers for their 2004 taxes: 72.4%
Here:
72%
State:
66%
(% for various income ranges: 68.5% for AGIs below $10k, 74.0% for AGIs $10k-25k, 71.4% for AGIs $25k-50k, 75.0% for AGIs $50k-75k, 74.3% for AGIs $75k-100k, 78.1% for AGIs over 100k)
Household received Food Stamps/SNAP in the past 12 months: 332 Household did not receive Food Stamps/SNAP in the past 12 months: 1,905
Women who had a birth in the past 12 months: 31 (3 now married, 25 unmarried) Women who did not have a birth in the past 12 months: 1,556 (787 now married, 773 unmarried)
Housing units in zip code 29511 with a mortgage: 866 (55 second mortgage, 49 both second mortgage and home equity loan) Houses without a mortgage: 32
Median monthly owner costs for units with a mortgage: $1,257 Median monthly owner costs for units without a mortgage: $388
Residents with income below the poverty level in 2022:
This zip code:
11.3%
Whole state:
14.0%
Residents with income below 50% of the poverty level in 2022:
This zip code:
6.4%
Whole state:
7.3%
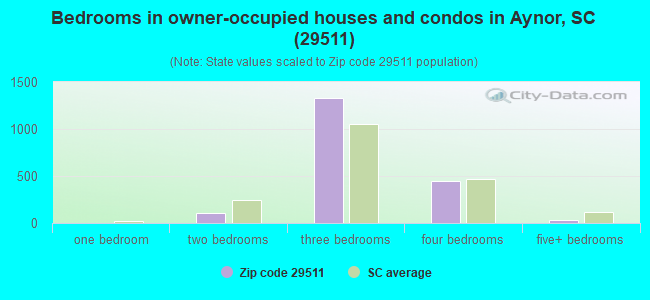
Median number of rooms in houses and condos:
Here:
6.0
State:
6.4
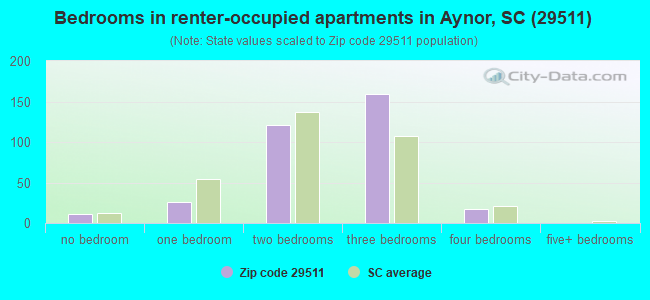
Median number of rooms in apartments:
Here:
4.9
State:
4.5
Notable locations in this zip code not listed on our city pages
Notable locations in zip code 29511: Aynor Fire Department (A), Horry County Memorial Library Aynor Branch Library (B), Horry County Fire Department Allens (C), Horry County Fire Department Aynor (D), Aynor Police Department (E). Display/hide their locations on the map
Churches in zip code 29511 include: Pleasant Union Church (A), Salem Church (B), Rehobeth Church (C), Poplar Hill Church (D), Horry Church (E), Friendship Church (F), Cool Springs Southern Methodist Church (G), Pisgah Church (H), Mount Aeral Church (I). Display/hide their locations on the map
Streams, rivers, and creeks: South Prong Chinners Swamp (A), Rabon Branch (B), North Prong Chinners Swamp (C), Horse Creek (D), Cross Branch (E), Big Baxter Swamp (F), Broadway Branch (G). Display/hide their locations on the map
Size of family households: 729 2-persons, 337 3-persons, 372 4-persons, 168 5-persons, 72 6-persons, 6 7-or-more-persons
Size of nonfamily households: 460 1-person, 82 2-persons
1,075 married couples with children.
86 single-parent households (25 men, 61 women).
98.9% of residents of 29511 zip code speak English at home.
0.8% of residents speak Spanish at home (100% not well).
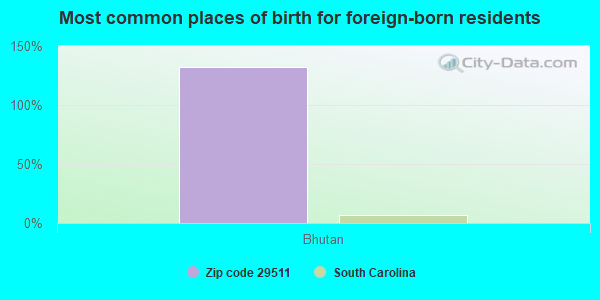
Foreign born population: 21 (0.4%) (39.9% of them are naturalized citizens)
This zip code:
0.4%
Whole state:
5.2%
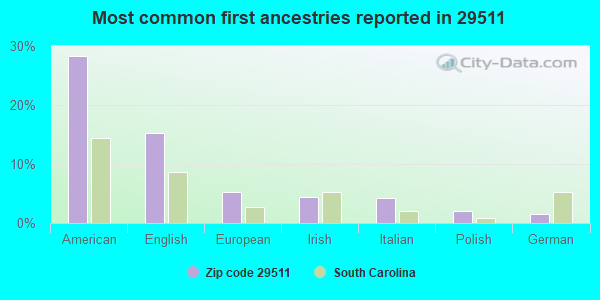
132%Bhutan
28%American
15%English
5%European
4%Irish
4%Italian
2%Polish
1%German
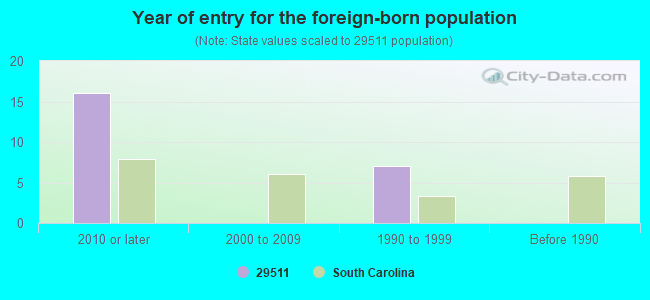
Year of entry for the foreign-born population
162010 or later
02000 to 2009
71990 to 1999
0Before 1990
Facilities with environmental interests located in this zip code:
AYNOR HIGH SCHOOL (201 JORDANVILLE HWY. in AYNOR, SC)
(Geographic Names Information System) (National Center for Education Statistics) - STATE ID-2601001 Organizations: HORRY COUNTY SCHOOL DISTRICT (SCHOOL DISTRICT)
AYNOR ELEMENTARY (600 12TH AVENUE in AYNOR, SC)
(National Center for Education Statistics) - STATE ID-2601014 Organizations: HORRY COUNTY SCHOOL DISTRICT (SCHOOL DISTRICT)
AYNOR MIDDLE (400 FRYE ROAD in AYNOR, SC)
(National Center for Education Statistics) - STATE ID-2601057 Organizations: HORRY COUNTY SCHOOL DISTRICT (SCHOOL DISTRICT)
Housing units lacking complete plumbing facilities: 0.4% Housing units lacking complete kitchen facilities: 1.7%
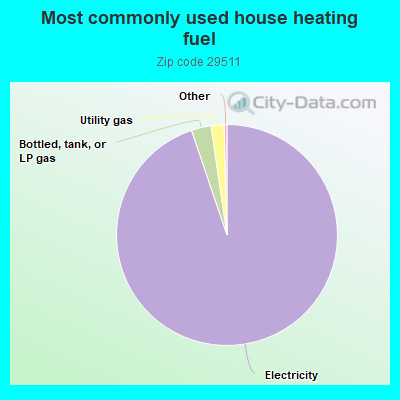
94.9%Electricity
2.9%Bottled, tank, or LP gas
1.9%Utility gas
Population in 1990: 6,786.
Place of birth for U.S.-born residents:
This state: 4,309
Northeast: 656
Midwest: 137
South: 990
West: 60
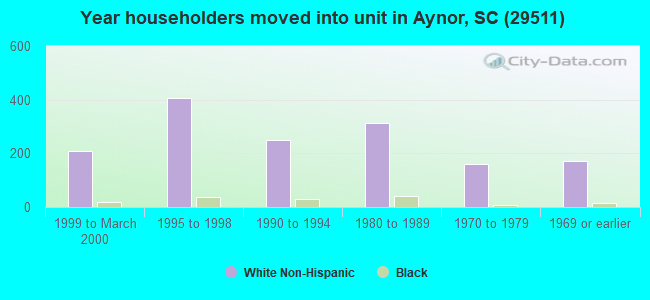
71% of the 29511 zip code residents lived in the same house 5 years ago. Out of people who lived in different houses, 72% lived in this county. Out of people who lived in different counties, 50% lived in South Carolina.
93% of the 29511 zip code residents lived in the same house 1 year ago. Out of people who lived in different houses, 43% moved from this county. Out of people who lived in different houses, 22% moved from different county within same state. Out of people who lived in different houses, 34% moved from different state.
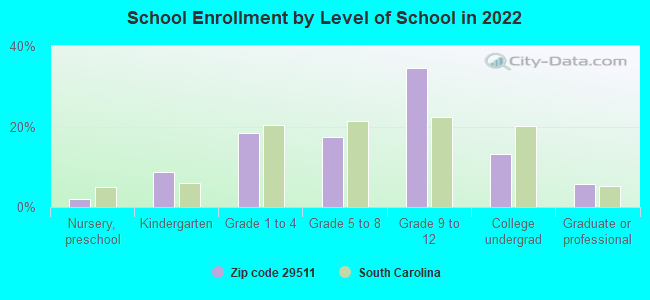
Private vs. public school enrollment:
Students in private schools in grades 1 to 8 (elementary and middle school): 140
Here:
23.5%
South Carolina:
14.4%
Students in private schools in grades 9 to 12 (high school): 14
Here:
2.6%
South Carolina:
11.1%
Students in private undergraduate colleges: 46
Here:
21.1%
South Carolina:
21.9%
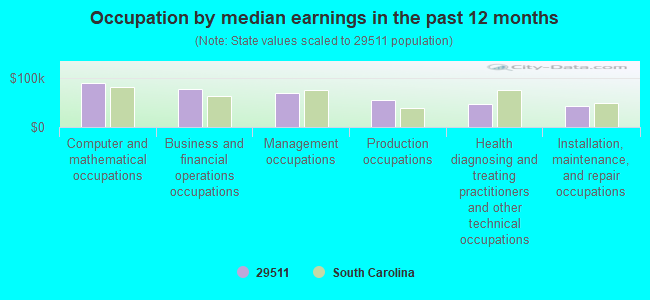
Occupation by median earnings in the past 12 months ($)
89,848Computer and mathematical occupations
78,545Business and financial operations occupations
70,014Management occupations
54,613Production occupations
47,712Health diagnosing and treating practitioners and other technical occupations
43,330Installation, maintenance, and repair occupations
Top industries in this zip code by the number of employees in 2005:
Health Care and Social Assistance: Home Health Care Services (50-99 employees: 1 establishment)
Accommodation and Food Services: Limited-Service Restaurants (20-49: 2, 1-4: 2)
Construction: Site Preparation Contractors (20-49: 1, 5-9: 1, 1-4: 3)
Construction: All Other Specialty Trade Contractors (20-49: 1, 5-9: 1)
Health Care and Social Assistance: Child Day Care Services (10-19: 1, 5-9: 1, 1-4: 1)
Other Services (except Public Administration): Drycleaning and Laundry Services (except Coin-Operated) (10-19: 1, 5-9: 1)
Fatal accident statistics in 2013:
Fatal accident count: 1
Vehicles involved in fatal accidents: 1
Fatal accidents caused by drunken drivers: 0
Fatalities: 1
Persons involved in fatal accidents: 1
Pedestrians involved in fatal accidents: 0
Fatal accident statistics in 2011:
Fatal accident count: 1
Vehicles involved in fatal accidents: 1
Fatal accidents caused by drunken drivers: 0
Fatalities: 1
Persons involved in fatal accidents: 1
Pedestrians involved in fatal accidents: 1
Home Mortgage Disclosure Act Aggregated Statistics For Year 2009 (Based on 6 partial tracts)
A) FHA, FSA/RHS & VA Home Purchase Loans
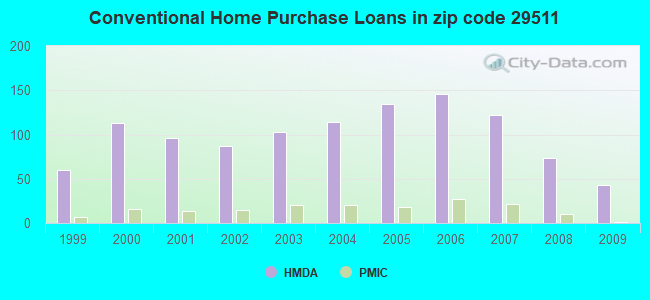
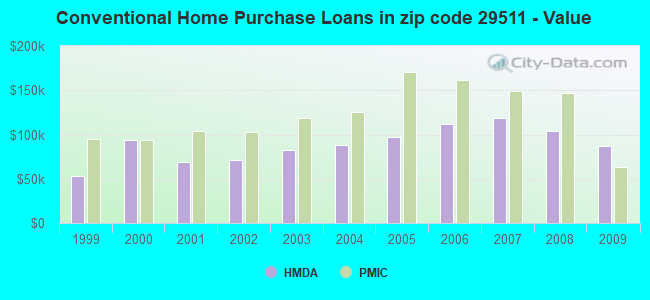
B) Conventional Home Purchase Loans
C) Refinancings
D) Home Improvement Loans
E) Loans on Dwellings For 5+ Families
F) Non-occupant Loans on < 5 Family Dwellings (A B C & D)
G) Loans On Manufactured Home Dwelling (A B C & D)
Number
Average Value
Number
Average Value
Number
Average Value
Number
Average Value
Number
Average Value
Number
Average Value
Number
Average Value
LOANS ORIGINATED
24
$139,777
43
$87,167
186
$133,955
17
$59,541
1
$156,650
35
$96,539
58
$44,674
APPLICATIONS APPROVED, NOT ACCEPTED
1
$69,340
1
$132,990
9
$151,357
1
$21,350
0
$0
1
$98,420
2
$45,980
APPLICATIONS DENIED
9
$106,974
8
$66,234
71
$161,591
4
$98,302
0
$0
3
$101,887
15
$75,111
APPLICATIONS WITHDRAWN
5
$133,632
2
$85,170
43
$165,240
0
$0
0
$0
2
$60,270
2
$95,520
FILES CLOSED FOR INCOMPLETENESS
0
$0
0
$0
9
$142,333
1
$132,160
0
$0
0
$0
2
$54,370
Aggregated Statistics For Year 2008 (Based on 6 partial tracts)
A) FHA, FSA/RHS & VA Home Purchase Loans
B) Conventional Home Purchase Loans
C) Refinancings
D) Home Improvement Loans
F) Non-occupant Loans on < 5 Family Dwellings (A B C & D)
G) Loans On Manufactured Home Dwelling (A B C & D)
Number
Average Value
Number
Average Value
Number
Average Value
Number
Average Value
Number
Average Value
Number
Average Value
LOANS ORIGINATED
18
$142,229
73
$103,705
174
$127,772
38
$56,579
38
$87,577
92
$54,381
APPLICATIONS APPROVED, NOT ACCEPTED
3
$120,973
4
$105,982
14
$160,909
1
$13,420
1
$83,190
5
$81,718
APPLICATIONS DENIED
7
$144,913
23
$92,697
85
$139,527
15
$38,877
6
$78,088
39
$76,497
APPLICATIONS WITHDRAWN
4
$115,855
3
$154,960
33
$147,740
2
$50,395
0
$0
5
$87,790
FILES CLOSED FOR INCOMPLETENESS
0
$0
2
$67,320
8
$170,289
0
$0
2
$55,660
1
$148,130
Aggregated Statistics For Year 2007 (Based on 6 partial tracts)
A) FHA, FSA/RHS & VA Home Purchase Loans
B) Conventional Home Purchase Loans
C) Refinancings
D) Home Improvement Loans
E) Loans on Dwellings For 5+ Families
F) Non-occupant Loans on < 5 Family Dwellings (A B C & D)
G) Loans On Manufactured Home Dwelling (A B C & D)
Number
Average Value
Number
Average Value
Number
Average Value
Number
Average Value
Number
Average Value
Number
Average Value
Number
Average Value
LOANS ORIGINATED
8
$139,525
122
$119,181
173
$129,071
36
$49,441
0
$0
44
$110,560
97
$51,031
APPLICATIONS APPROVED, NOT ACCEPTED
0
$0
13
$113,801
15
$159,369
2
$163,735
0
$0
3
$114,133
7
$83,057
APPLICATIONS DENIED
2
$103,845
24
$127,004
96
$169,306
11
$62,472
1
$3,450
4
$174,980
29
$77,213
APPLICATIONS WITHDRAWN
0
$0
10
$132,957
35
$149,235
3
$145,780
0
$0
1
$135,570
3
$68,980
FILES CLOSED FOR INCOMPLETENESS
0
$0
2
$201,700
14
$140,654
2
$47,815
0
$0
2
$128,465
2
$120,610
Aggregated Statistics For Year 2006 (Based on 6 partial tracts)
A) FHA, FSA/RHS & VA Home Purchase Loans
B) Conventional Home Purchase Loans
C) Refinancings
D) Home Improvement Loans
F) Non-occupant Loans on < 5 Family Dwellings (A B C & D)
G) Loans On Manufactured Home Dwelling (A B C & D)
Number
Average Value
Number
Average Value
Number
Average Value
Number
Average Value
Number
Average Value
Number
Average Value
LOANS ORIGINATED
2
$141,820
146
$111,953
160
$113,440
23
$52,230
43
$74,894
90
$47,544
APPLICATIONS APPROVED, NOT ACCEPTED
1
$124,850
23
$104,300
18
$116,914
2
$33,600
2
$130,215
17
$72,737
APPLICATIONS DENIED
2
$74,645
51
$105,388
87
$125,399
14
$46,791
9
$132,439
44
$69,270
APPLICATIONS WITHDRAWN
0
$0
14
$132,684
43
$128,051
3
$74,303
4
$83,878
10
$86,617
FILES CLOSED FOR INCOMPLETENESS
0
$0
2
$117,135
15
$119,624
0
$0
0
$0
0
$0
Aggregated Statistics For Year 2005 (Based on 6 partial tracts)
A) FHA, FSA/RHS & VA Home Purchase Loans
B) Conventional Home Purchase Loans
C) Refinancings
D) Home Improvement Loans
F) Non-occupant Loans on < 5 Family Dwellings (A B C & D)
G) Loans On Manufactured Home Dwelling (A B C & D)
Number
Average Value
Number
Average Value
Number
Average Value
Number
Average Value
Number
Average Value
Number
Average Value
LOANS ORIGINATED
4
$106,802
134
$97,078
143
$100,204
27
$39,946
40
$76,082
79
$40,737
APPLICATIONS APPROVED, NOT ACCEPTED
1
$107,530
19
$87,599
13
$115,388
1
$25,450
4
$100,965
9
$64,249
APPLICATIONS DENIED
2
$62,560
53
$69,860
89
$98,760
15
$42,569
3
$61,853
62
$62,590
APPLICATIONS WITHDRAWN
1
$116,580
19
$115,121
61
$108,243
5
$168,704
3
$169,937
13
$74,318
FILES CLOSED FOR INCOMPLETENESS
0
$0
8
$105,035
22
$132,708
0
$0
0
$0
2
$83,070
Aggregated Statistics For Year 2004 (Based on 6 partial tracts)
A) FHA, FSA/RHS & VA Home Purchase Loans
B) Conventional Home Purchase Loans
C) Refinancings
D) Home Improvement Loans
E) Loans on Dwellings For 5+ Families
F) Non-occupant Loans on < 5 Family Dwellings (A B C & D)
G) Loans On Manufactured Home Dwelling (A B C & D)
Number
Average Value
Number
Average Value
Number
Average Value
Number
Average Value
Number
Average Value
Number
Average Value
Number
Average Value
LOANS ORIGINATED
3
$110,060
114
$88,267
141
$95,300
18
$40,561
1
$80,710
34
$69,079
74
$43,828
APPLICATIONS APPROVED, NOT ACCEPTED
1
$35,670
21
$80,479
17
$94,757
2
$24,635
0
$0
2
$133,700
17
$65,179
APPLICATIONS DENIED
1
$46,630
39
$69,086
84
$88,100
16
$38,459
0
$0
5
$89,900
43
$59,399
APPLICATIONS WITHDRAWN
0
$0
6
$127,312
38
$101,640
2
$31,505
0
$0
2
$77,945
4
$80,520
FILES CLOSED FOR INCOMPLETENESS
0
$0
2
$107,940
15
$120,609
0
$0
0
$0
0
$0
5
$88,818
Aggregated Statistics For Year 2003 (Based on 6 partial tracts)
A) FHA, FSA/RHS & VA Home Purchase Loans
B) Conventional Home Purchase Loans
C) Refinancings
D) Home Improvement Loans
F) Non-occupant Loans on < 5 Family Dwellings (A B C & D)
Number
Average Value
Number
Average Value
Number
Average Value
Number
Average Value
Number
Average Value
LOANS ORIGINATED
3
$88,113
103
$82,180
236
$104,939
13
$57,645
31
$57,641
APPLICATIONS APPROVED, NOT ACCEPTED
1
$26,900
12
$58,978
41
$102,272
0
$0
2
$63,070
APPLICATIONS DENIED
4
$58,872
54
$61,216
118
$91,813
6
$30,193
7
$62,857
APPLICATIONS WITHDRAWN
0
$0
11
$119,523
47
$95,123
1
$3,450
2
$61,730
FILES CLOSED FOR INCOMPLETENESS
0
$0
1
$146,070
7
$113,404
0
$0
0
$0
Aggregated Statistics For Year 2002 (Based on 6 partial tracts)
A) FHA, FSA/RHS & VA Home Purchase Loans
B) Conventional Home Purchase Loans
C) Refinancings
D) Home Improvement Loans
F) Non-occupant Loans on < 5 Family Dwellings (A B C & D)
Number
Average Value
Number
Average Value
Number
Average Value
Number
Average Value
Number
Average Value
LOANS ORIGINATED
6
$102,680
87
$70,922
203
$90,133
14
$40,808
27
$46,610
APPLICATIONS APPROVED, NOT ACCEPTED
0
$0
23
$43,889
35
$87,611
0
$0
2
$67,225
APPLICATIONS DENIED
2
$43,435
74
$50,736
105
$92,919
9
$7,638
3
$60,637
APPLICATIONS WITHDRAWN
0
$0
9
$91,058
56
$92,905
1
$37,110
2
$87,565
FILES CLOSED FOR INCOMPLETENESS
0
$0
2
$60,250
13
$104,735
0
$0
1
$60,700
Aggregated Statistics For Year 2001 (Based on 6 partial tracts)
A) FHA, FSA/RHS & VA Home Purchase Loans
B) Conventional Home Purchase Loans
C) Refinancings
D) Home Improvement Loans
F) Non-occupant Loans on < 5 Family Dwellings (A B C & D)
Number
Average Value
Number
Average Value
Number
Average Value
Number
Average Value
Number
Average Value
LOANS ORIGINATED
7
$92,980
96
$69,160
190
$90,365
13
$29,004
19
$43,962
APPLICATIONS APPROVED, NOT ACCEPTED
1
$130,690
26
$42,102
27
$65,659
0
$0
2
$59,705
APPLICATIONS DENIED
5
$90,830
83
$50,510
104
$75,366
8
$19,138
7
$57,711
APPLICATIONS WITHDRAWN
2
$89,450
11
$82,379
38
$78,887
3
$15,320
0
$0
FILES CLOSED FOR INCOMPLETENESS
0
$0
2
$98,900
9
$83,517
1
$42,610
0
$0
Aggregated Statistics For Year 2000 (Based on 6 partial tracts)
A) FHA, FSA/RHS & VA Home Purchase Loans
B) Conventional Home Purchase Loans
C) Refinancings
D) Home Improvement Loans
F) Non-occupant Loans on < 5 Family Dwellings (A B C & D)
Number
Average Value
Number
Average Value
Number
Average Value
Number
Average Value
Number
Average Value
LOANS ORIGINATED
3
$93,187
113
$93,982
83
$62,417
19
$21,334
19
$36,467
APPLICATIONS APPROVED, NOT ACCEPTED
10
$41,613
50
$50,903
21
$69,918
0
$0
3
$44,087
APPLICATIONS DENIED
11
$53,690
142
$45,716
88
$58,702
11
$18,067
5
$48,370
APPLICATIONS WITHDRAWN
2
$88,295
7
$73,817
29
$54,286
0
$0
0
$0
FILES CLOSED FOR INCOMPLETENESS
0
$0
1
$33,780
6
$67,150
0
$0
0
$0
Aggregated Statistics For Year 1999 (Based on 3 partial tracts)
A) FHA, FSA/RHS & VA Home Purchase Loans
B) Conventional Home Purchase Loans
C) Refinancings
D) Home Improvement Loans
F) Non-occupant Loans on < 5 Family Dwellings (A B C & D)
2003 - 2018 National Fire Incident Reporting System (NFIRS) incidents
Based on the data from the years 2003 - 2018 the average number of fire incidents per year is 36. The highest number of reported fire incidents - 80 took place in 2004, and the least - 2 in 2006. The data has a decreasing trend.
When looking into fire subcategories, the most reports belonged to: Outside Fires (56.2%), and Structure Fires (24.8%).
Fire incident types reported to NFIRS in Zip Code 29511
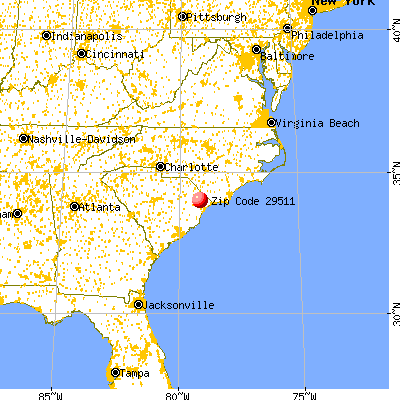


 Nearest zip codes: 29544, 29527, 29526, 29569, 29581, 29574.


 Based on the data from the years 2003 - 2018 the average number of fire incidents per year is 36. The highest number of reported fire incidents - 80 took place in 2004, and the least - 2 in 2006. The data has a decreasing trend.
 When looking into fire subcategories, the most reports belonged to: Outside Fires (56.2%), and Structure Fires (24.8%).