Estimated zip code population in 2022: 3,091 Zip code population in 2010: 3,105 Zip code population in 2000: 2,876
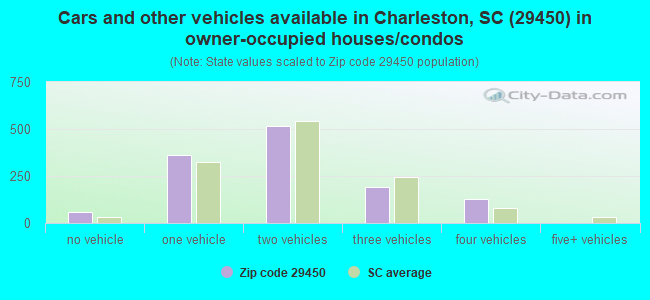
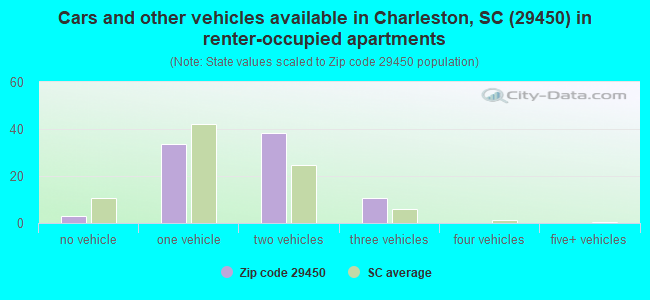
Houses and condos: 1,432 Renter-occupied apartments: 85
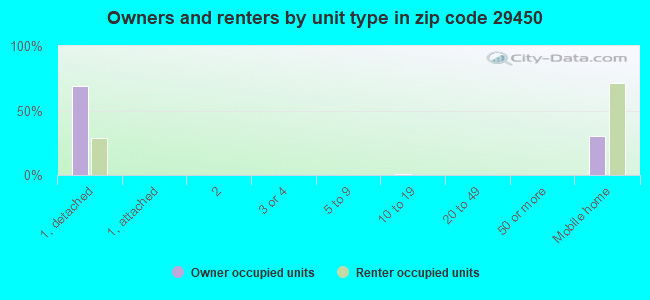
% of renters here:
6%
State:
28%
March 2022 cost of living index in zip code 29450: 84.9 (less than average, U.S. average is 100)
Land area: 144.4 sq. mi. Water area: 2.1 sq. mi.
Population density: 21 people per square mile
(very low).
OSM Map
General Map
Google Map
MSN Map
OSM Map
General Map
Google Map
MSN Map
OSM Map
General Map
Google Map
MSN Map
OSM Map
General Map
Google Map
MSN Map
Please wait while loading the map...
Real estate property taxes paid for housing units in 2022:
This zip code:
0.4% ($872)
South Carolina:
0.5% ($1,185)
Median real estate property taxes paid for housing units with mortgages in 2022: $1,041 (0.2%) Median real estate property taxes paid for housing units with no mortgage in 2022: $706 (0.1%)
Business Search- 14 Million verified businesses
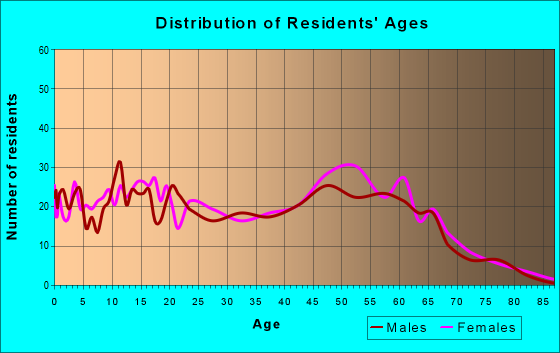
Males: 1,274
(41.2%)
Females: 1,818
(58.8%)
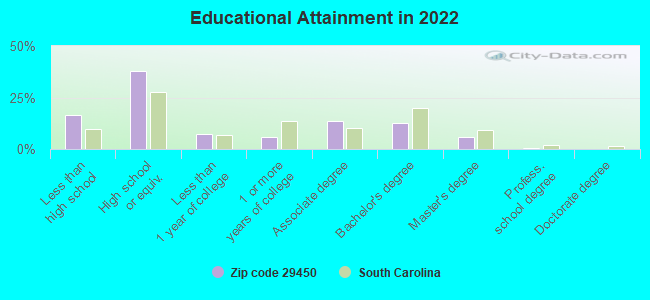
For population 25 years and over in 29450:
High school or higher: 82.5%
Bachelor's degree or higher: 18.8%
Graduate or professional degree: 6.5%
Unemployed: 4.2%
Mean travel time to work (commute): 34.2 minutes
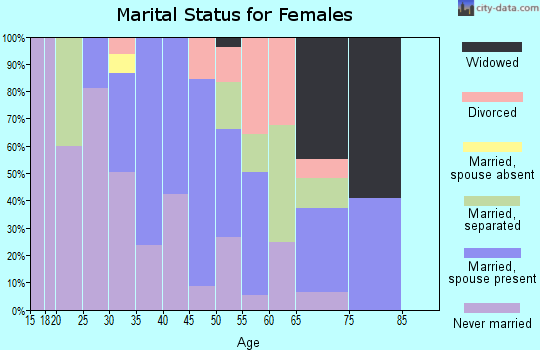
For population 15 years and over in 29450:
Never married: 34.0%
Now married: 45.5%
Separated: 2.7%
Widowed: 6.1%
Divorced: 11.7%
Zip code 29450 compared to state average:
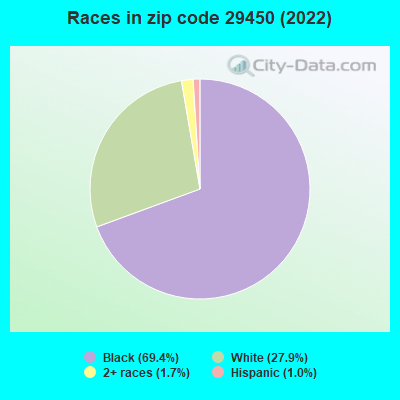
Black race population percentage above state average.
Hispanic race population percentage significantly below state average.
Median age significantly above state average.
Foreign-born population percentage significantly below state average.
Renting percentage significantly below state average.
Length of stay since moving in significantly above state average.
House age below state average.
Percentage of population with a bachelor's degree or higher below state average.
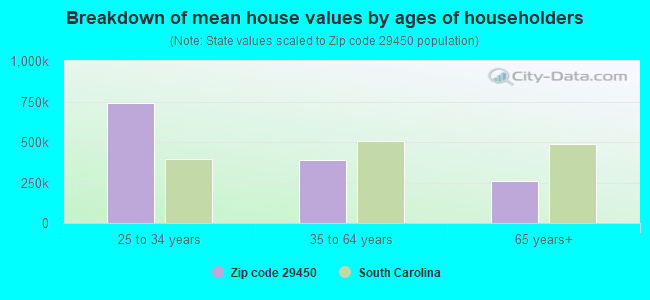
Estimated median house/condo value in 2022: $220,920
29450:
$220,920
South Carolina:
$254,600
According to our research of South Carolina and other state lists, there were 9 registered sex offenders living in 29450 zip code as of May 19, 2024. The ratio of all residents to sex offenders in zip code 29450 is 423 to 1.
Median resident age:
This zip code:
49.4 years
South Carolina median age:
40.5 years
Average household size:
This zip code:
2.3 people
South Carolina:
2.4 people
Averages for the 2020 tax year for zip code 29450, filed in 2021:
Average Adjusted Gross Income (AGI) in 2020: $58,271 (Individual Income Tax Returns)
Here:
$58,271
State:
$65,754
Salary/wage: $46,923 (reported on 86.0% of returns)
Here:
$46,923
State:
$52,566
(% of AGI for various income ranges: 1307.6% for AGIs below $25k, 4306.9% for AGIs $25k-50k, 7440.0% for AGIs $50k-75k, 11157.1% for AGIs $75k-100k, 18439.1% for AGIs $100k-200k)
Taxable interest for individuals: $683 (reported on 16.3% of returns)
This zip code:
$683
South Carolina:
$1,749
(% of AGI for various income ranges: 1.6% for AGIs below $25k, 2.6% for AGIs $25k-50k, 17.7% for AGIs $50k-75k, 20.0% for AGIs $75k-100k, 99.1% for AGIs $100k-200k)
Ordinary dividends: $3,005 (reported on 10.7% of returns)
Here:
$3,005
State:
$8,783
(% of AGI for various income ranges: 8.2% for AGIs below $25k, 3.4% for AGIs $25k-50k, 29.2% for AGIs $50k-75k, 75.7% for AGIs $75k-100k, 200.9% for AGIs $100k-200k)
Net capital gain/loss in AGI: +$9,861 (reported on 10.1% of returns)
Here:
+$9,861
State:
+$24,194
(% of AGI for various income ranges: 113.8% for AGIs $50k-75k, 54.3% for AGIs $75k-100k, 373.6% for AGIs $100k-200k)
Profit/loss from business: +$8,440 (reported on 16.9% of returns)
Here:
+$8,440
State:
+$11,253
(% of AGI for various income ranges: 118.2% for AGIs below $25k, 81.4% for AGIs $25k-50k, 321.5% for AGIs $50k-75k, 252.9% for AGIs $75k-100k, 953.6% for AGIs $100k-200k)
Taxable individual retirement arrangement distribution: $26,978 (reported on 5.1% of returns)
29450:
$26,978
South Carolina:
$21,604
(% of AGI for various income ranges: 54.9% for AGIs below $25k, 293.1% for AGIs $50k-75k, 1606.4% for AGIs $100k-200k)
Total itemized deductions: $26,400 (reported on 7.3% of returns)
Here:
$26,400
State:
$35,199
(% of AGI for various income ranges: 978.5% for AGIs $50k-75k, 1154.5% for AGIs $100k-200k)
Charity contributions: $8,050 (reported on 5.6% of returns)
Here:
$8,050
State:
$14,319
(% of AGI for various income ranges: 163.8% for AGIs $50k-75k, 201.8% for AGIs $100k-200k)
Taxes paid: $7,223 (reported on 7.3% of returns)
29450:
$7,223
State:
$7,486
(% of AGI for various income ranges: 221.5% for AGIs $50k-75k, 368.2% for AGIs $100k-200k)
Earned income credit: $2,524 (reported on 23.0% of returns)
Here:
$2,524
State:
$2,397
(% of AGI for various income ranges: 142.0% for AGIs below $25k, 88.9% for AGIs $25k-50k)
Percentage of individuals using paid preparers for their 2020 taxes: 93.3%
Here:
93%
State:
93%
(% for various income ranges: 92.8% for AGIs below $25k, 93.9% for AGIs $25k-50k, 90.5% for AGIs $50k-75k, 91.7% for AGIs $75k-100k, 95.0% for AGIs $100k-200k, 100.0% for AGIs over 200k)
Averages for the 2012 tax year for zip code 29450, filed in 2013:
Average Adjusted Gross Income (AGI) in 2012: $35,195 (Individual Income Tax Returns)
Here:
$35,195
State:
$51,133
Salary/wage: $32,561 (reported on 87.1% of returns)
Here:
$32,561
State:
$42,173
(% of AGI for various income ranges: 82.2% for AGIs below $25k, 84.7% for AGIs $25k-50k, 86.2% for AGIs $50k-75k, 79.8% for AGIs $75k-100k, 71.7% for AGIs $100k-200k)
Taxable interest for individuals: $295 (reported on 15.0% of returns)
This zip code:
$295
South Carolina:
$1,468
(% of AGI for various income ranges: 0.1% for AGIs below $25k, 0.3% for AGIs $100k-200k)
Ordinary dividends: $1,756 (reported on 6.4% of returns)
Here:
$1,756
State:
$6,511
(% of AGI for various income ranges: 0.3% for AGIs below $25k, 0.1% for AGIs $25k-50k, 1.8% for AGIs $75k-100k)
Net capital gain/loss in AGI: +$400 (reported on 3.6% of returns)
Here:
+$400
State:
+$13,061
Profit/loss from business: +$6,623 (reported on 15.7% of returns)
Here:
+$6,623
State:
+$10,167
(% of AGI for various income ranges: 9.7% for AGIs below $25k, 3.0% for AGIs $25k-50k, 2.9% for AGIs $75k-100k)
Taxable individual retirement arrangement distribution: $13,740 (reported on 3.6% of returns)
29450:
$13,740
South Carolina:
$17,019
Total itemized deductions: $18,187 (25% of AGI, reported on 22.1% of returns)
Here:
$18,187
State:
$22,890
Here:
25.2% of AGI
State:
21.4% of AGI
(% of AGI for various income ranges: 5.8% for AGIs below $25k, 9.0% for AGIs $25k-50k, 13.4% for AGIs $50k-75k, 12.3% for AGIs $75k-100k, 16.3% for AGIs $100k-200k)
Charity contributions: $3,616 (reported on 17.9% of returns)
Here:
$3,616
State:
$5,169
(% of AGI for various income ranges: 0.8% for AGIs below $25k, 1.4% for AGIs $25k-50k, 2.4% for AGIs $50k-75k, 1.7% for AGIs $75k-100k, 2.8% for AGIs $100k-200k)
Taxes paid: $5,294 (reported on 22.1% of returns)
29450:
$5,294
State:
$7,644
(% of AGI for various income ranges: 0.8% for AGIs below $25k, 1.9% for AGIs $25k-50k, 3.3% for AGIs $50k-75k, 4.1% for AGIs $75k-100k, 6.4% for AGIs $100k-200k)
Earned income credit: $2,482 (reported on 35.0% of returns)
Here:
$2,482
State:
$2,418
(% of AGI for various income ranges: 10.8% for AGIs below $25k, 1.9% for AGIs $25k-50k)
Percentage of individuals using paid preparers for their 2012 taxes: 66.4%
Here:
66%
State:
57%
(% for various income ranges: 63.9% for AGIs below $25k, 63.2% for AGIs $25k-50k, 78.6% for AGIs $50k-75k, 75.0% for AGIs $75k-100k, 75.0% for AGIs $100k-200k)
Averages for the 2004 tax year for zip code 29450, filed in 2005:
Average Adjusted Gross Income (AGI) in 2004: $29,546 (Individual Income Tax Returns)
Here:
$29,546
State:
$41,965
Salary/wage: $28,027 (reported on 89.7% of returns)
Here:
$28,027
State:
$35,695
(% of AGI for various income ranges: 97.6% for AGIs below $10k, 86.6% for AGIs $10k-25k, 88.0% for AGIs $25k-50k, 91.0% for AGIs $50k-75k, 87.2% for AGIs $75k-100k, 73.3% for AGIs over 100k)
Taxable interest for individuals: $295 (reported on 15.9% of returns)
This zip code:
$295
South Carolina:
$1,623
(% of AGI for various income ranges: 0.1% for AGIs below $10k, 0.2% for AGIs $10k-25k, 0.2% for AGIs $25k-50k, 0.1% for AGIs $50k-75k, 0.1% for AGIs $75k-100k, 0.1% for AGIs over 100k)
Taxable dividends: $557 (reported on 6.1% of returns)
Here:
$557
State:
$3,999
(% of AGI for various income ranges: 0.5% for AGIs below $10k, 0.0% for AGIs $10k-25k, 0.1% for AGIs $25k-50k, 0.1% for AGIs $50k-75k, 0.2% for AGIs over 100k)
Net capital gain/loss: +$11,103 (reported on 4.5% of returns)
Here:
+$11,103
State:
+$13,100
(% of AGI for various income ranges: -0.0% for AGIs $10k-25k, 0.8% for AGIs $50k-75k, 6.9% for AGIs over 100k)
Profit/loss from business: +$6,143 (reported on 11.8% of returns)
Here:
+$6,143
State:
+$9,144
(% of AGI for various income ranges: 11.2% for AGIs below $10k, 4.4% for AGIs $10k-25k, 1.6% for AGIs $25k-50k, -0.1% for AGIs $50k-75k, 2.7% for AGIs over 100k)
Total itemized deductions: $18,115 (28% of AGI, reported on 22.0% of returns)
Here:
$18,115
State:
$19,039
Here:
27.9% of AGI
State:
22.8% of AGI
(% of AGI for various income ranges: 6.1% for AGIs below $10k, 7.6% for AGIs $10k-25k, 12.7% for AGIs $25k-50k, 15.8% for AGIs $50k-75k, 15.6% for AGIs $75k-100k, 19.0% for AGIs over 100k)
Charity contributions deductions: $3,929 (7% of AGI, reported on 19.5% of returns)
Here:
$3,929
State:
$4,305
Here:
6.5% of AGI
State:
5.0% of AGI
(% of AGI for various income ranges: 1.4% for AGIs $10k-25k, 2.8% for AGIs $25k-50k, 2.7% for AGIs $50k-75k, 2.9% for AGIs $75k-100k, 3.8% for AGIs over 100k)
Total tax: $4,269 (reported on 57.6% of returns)
29450:
$4,269
State:
$6,497
(% of AGI for various income ranges: 2.5% for AGIs below $10k, 2.6% for AGIs $10k-25k, 5.8% for AGIs $25k-50k, 8.0% for AGIs $50k-75k, 11.0% for AGIs $75k-100k, 16.9% for AGIs over 100k)
Earned income credit: $2,143 (reported on 37.7% of returns)
Here:
$2,143
State:
$1,882
Percentage of individuals using paid preparers for their 2004 taxes: 77.1%
Here:
77%
State:
66%
(% for various income ranges: 70.5% for AGIs below $10k, 83.0% for AGIs $10k-25k, 76.9% for AGIs $25k-50k, 70.0% for AGIs $50k-75k, 69.0% for AGIs $75k-100k, 83.3% for AGIs over 100k)
Household received Food Stamps/SNAP in the past 12 months: 145 Household did not receive Food Stamps/SNAP in the past 12 months: 1,182
Women who had a birth in the past 12 months: 9 (0 now married, 8 unmarried) Women who did not have a birth in the past 12 months: 756 (299 now married, 455 unmarried)
Housing units in zip code 29450 with a mortgage: 491 (16 second mortgage, 6 both second mortgage and home equity loan) Median monthly owner costs for units with a mortgage: $1,235 Median monthly owner costs for units without a mortgage: $457
Residents with income below the poverty level in 2022:
This zip code:
19.3%
Whole state:
14.0%
Residents with income below 50% of the poverty level in 2022:
This zip code:
9.6%
Whole state:
7.3%
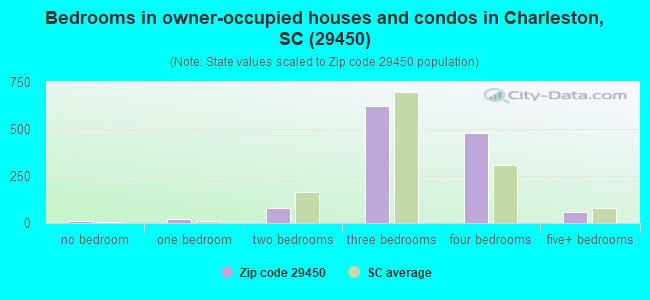
Median number of rooms in houses and condos:
Here:
6.7
State:
6.4
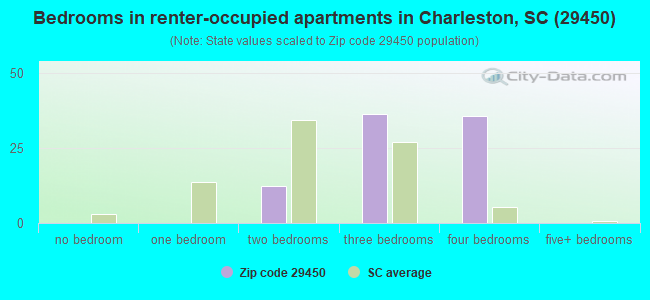
Median number of rooms in apartments:
Here:
5.5
State:
4.5
Notable locations in this zip code not listed on our city pages
Notable locations in zip code 29450: The Tee (A), Tin Top Camp (B), Francis Marion Seed Shelter Orchard (C), Swamp Fox Trailhead (D), Blessing Plantation (E), Middleburg Plantation (F), Hollion Hill Plantation (G), Quinby Plantation (H), Bates Store (I), The Grove (J), Brick Church Farm (K), Berefords Bounty (L), Cherry Hill Plantation (M), Grove Plantation (N), Spring Hill Plantation (O), Cainhoy Rural Volunteer Fire Department Station 2 (P), Huger Rural Volunteer Fire Department Huger (Q), Cainhoy Rural Volunteer Fire Department Station 4 (R). Display/hide their locations on the map
Churches in zip code 29450 include: Halfway Creek Church (A), Hopewell Church (B), Quimby Holiness Church (C), Eccles Church (D), Bethel Church (E), Charity Church (F), Cypress Pond Church (G), New Hope Church (H), Saint Phillips Church (I). Display/hide their locations on the map
Cemeteries: Grove Cemetery (1), Collins Cemetery (2), Fowler Cemetery (3), Apple Old Field Cemetery (4), Eccles Cemetery (5), Halfway Creek Cemetery (6), Pompion Hill Chapel Cemetery (7). Display/hide their locations on the map
Reservoirs and swamps: Red Bank Reserve (A), Leneigh Reserve (B), Hard Pinch Reserve (C), Bonnie Reserve (D), Bates Pond (E), Darlington Swamp (F), King Swamp (G), Long Pond Savannah (H). Display/hide their locations on the map
Streams, rivers, and creeks: French Quarter Creek (A), York Bottom Creek (B), West Branch Cooper River (C), Washaw Creek (D), Old Man Lead (E), Northampton Creek (F), Harleston Dam Creek (G), Muddy Creek (H), Menzer Run (I). Display/hide their locations on the map
Size of family households: 607 2-persons, 185 3-persons, 137 4-persons, 44 5-persons
Size of nonfamily households: 313 1-person, 45 2-persons
174 married couples with children.
175 single-parent households (58 men, 117 women).
97.0% of residents of 29450 zip code speak English at home.
2.5% of residents speak Spanish at home (100% very well).
0.3% of residents speak other Indo-European language at home (100% very well).
0.2% of residents speak Asian or Pacific Island language at home (100% not well).
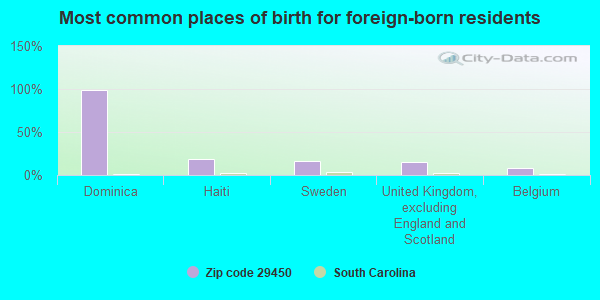
Foreign born population: 61 (2.0%) (53.7% of them are naturalized citizens)
This zip code:
2.0%
Whole state:
5.2%
98%Dominica
18%Haiti
17%Sweden
15%United Kingdom, excluding England and Scotland
8%Belgium
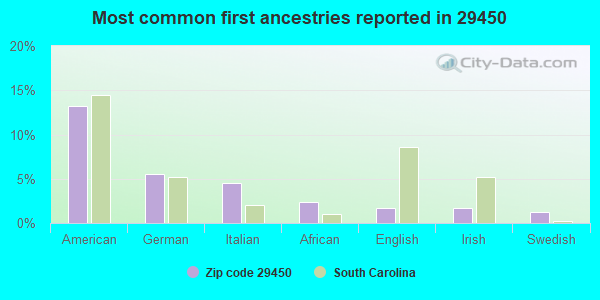
13%American
5%German
4%Italian
2%African
2%English
2%Irish
1%Swedish
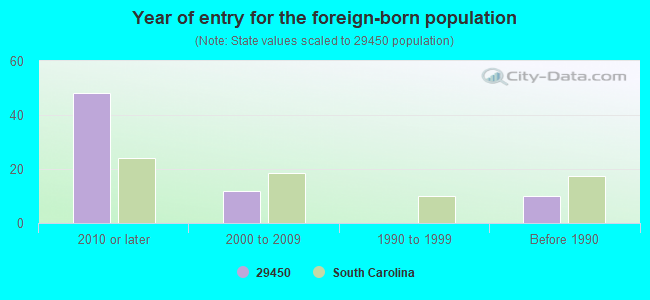
Year of entry for the foreign-born population
482010 or later
122000 to 2009
01990 to 1999
10Before 1990
Public elementary/middle school in in zip code 29450 not listed on the city page:
Facilities with environmental interests located in this zip code:
CHROME DEPOSIT CORPORATION (1360 OLD HAGAN AVE in HUGER, SC)
AIR MAJOR (AIRS/AFS) CRITERIA AND HAZARDOUS AIR POLLUTANT INVENTORY (Inventory of air pollution sources) HAZARDOUS WASTE BIENNIAL REPORTER (Resource Conservation and Recovery Act (tracking hazardous waste)) Large Quantity Generators, more that 1000 kg of hazardous waste/month (Resource Conservation and Recovery Act (tracking hazardous waste)) - notification STATE MASTER (South Carolina database) - AIR PROGRAM, AIR MAJOR, HAZARDOUS WASTE PROGRAM, DRINKING WATER PROGRAM, DRINKING WATER SYSTEM TRI REPORTER (Tracking of toxic chemicals releasing facilities) Business SIC and NAICS classification: ELECTROPLATING, PLATING, POLISHING, ANODIZING, AND COLORING
CAINHOY ELEMENTARY/MIDDLE SCHOOL (2434 CAINHOY ROAD in HUGER, SC)
(National Center for Education Statistics) - STATE ID-0801015 Organizations: BERKELEY COUNTY SCHOOL DISTRICT (SCHOOL DISTRICT)
CAINHOY MIDDLE SCHOOL (2424 CAINHOY ROAD in HUGER, SC)
(National Center for Education Statistics) - STATE ID-0801042 Organizations: BERKELEY COUNTY SCHOOL DISTRICT (SCHOOL DISTRICT)
AIR LIQUIDE LARGE INDUSTRIES US LP (1454 HAGAN AVENUE in HUGER, SC)
AIR MINOR (AIRS/AFS) Business SIC classification: INDUSTRIAL GASES Alternative names: MG INDUSTRIES:NUCOR SITE
DAWKINS CONCRETE:#2-CLOSED (1460 OLD HAGAN AVE in HUGER, SC)
AIR MINOR (AIRS/AFS) Business SIC classification: READY-MIXED CONCRETE Alternative names: DAWKINS CONCRETE NUMBER 2
CHARLESTON MILL SERVICE (1464 HAGAN AVE in HUGER, SC)
CRITERIA AND HAZARDOUS AIR POLLUTANT INVENTORY (Inventory of air pollution sources) TRI REPORTER (Tracking of toxic chemicals releasing facilities) Business SIC classification: MINERALS AND EARTHS, GROUND OR OTHERWISE TREATED Alternative names: EDW. C. LEVY CO.
Housing units lacking complete plumbing facilities: 0.4% Housing units lacking complete kitchen facilities: 0.4%
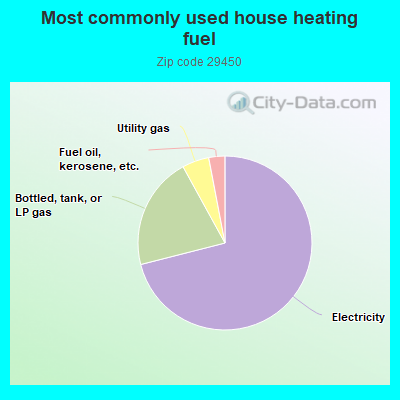
71.1%Electricity
21.0%Bottled, tank, or LP gas
5.0%Utility gas
3.0%Fuel oil, kerosene, etc.
Population in 1990: 1,964. Population change in the 1990s: +912 (+46.4%).
Place of birth for U.S.-born residents:
This state: 2,339
Northeast: 296
Midwest: 60
South: 271
West: 14
79% of the 29450 zip code residents lived in the same house 5 years ago. Out of people who lived in different houses, 41% lived in this county. Out of people who lived in different counties, 50% lived in South Carolina.
96% of the 29450 zip code residents lived in the same house 1 year ago. Out of people who lived in different houses, 56% moved from this county. Out of people who lived in different houses, 24% moved from different county within same state. Out of people who lived in different houses, 12% moved from different state.
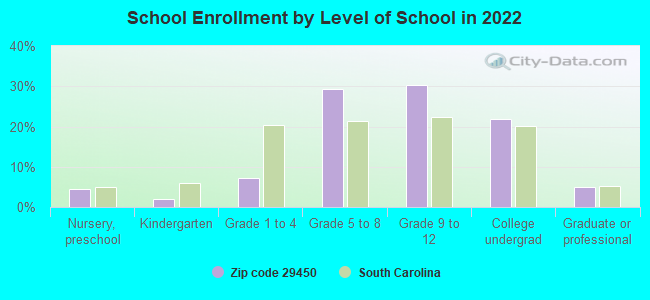
Private vs. public school enrollment:
Students in private schools in grades 1 to 8 (elementary and middle school): 22
Here:
7.9%
South Carolina:
14.4%
Students in private schools in grades 9 to 12 (high school): 15
Here:
6.6%
South Carolina:
11.1%
Students in private undergraduate colleges: 68
Here:
40.6%
South Carolina:
21.9%
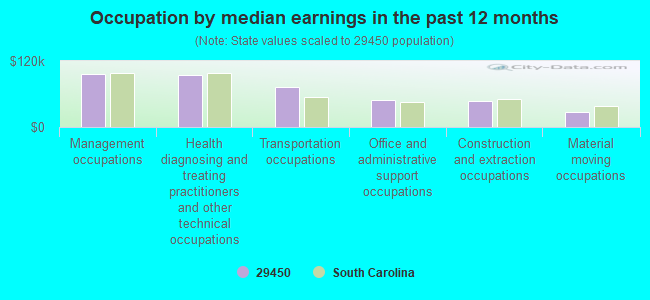
Occupation by median earnings in the past 12 months ($)
95,975Management occupations
94,184Health diagnosing and treating practitioners and other technical occupations
71,907Transportation occupations
49,803Office and administrative support occupations
47,244Construction and extraction occupations
27,978Material moving occupations
Companies with federal contracts located in this zip code:
IRVING LANDSCAPING (1954 HIGH POINT CIRCLE in HUGER, SC; small business) : $7,738,121 in 247 contractsfrom 1999 to 2006
Contracts for Landscaping/Groundskeeping Services, Maintenance, Repair or Alteration of Real Property -- Miscellaneous Buildings by Navy Signed by year:2000: $520,415; 2001: $1,251,106; 2002: $1,908,551; 2003: $1,920,468; 2004: $1,575,800; 2005: $67,449; 2006: $28,497.
Biggest contracts:
$1,628,703 with Navy for Landscaping/Groundskeeping Services. Signed on 2004-11-04. Completion date: 2003-09-30.
$1,329,592, same as above.Signed on 2002-12-23. Completion date: 2003-09-30.
$1,253,459, same as above.Signed on 2003-11-24. Completion date: 2003-09-30.
$777,612, same as above.Signed on 2001-11-06. Completion date: 2002-09-30.
Top industries in this zip code by the number of employees in 2005:
Administrative and Support and Waste Management and Remediation Services: Janitorial Services (20-49 employees: 2 establishments)
Wholesale Trade: Metal Service Centers and Other Metal Merchant Wholesalers (10-19: 2, 5-9: 1)
Fatal accident statistics in 2013:
Fatal accident count: 2
Vehicles involved in fatal accidents: 3
Fatal accidents caused by drunken drivers: 0
Fatalities: 3
Persons involved in fatal accidents: 7
Pedestrians involved in fatal accidents: 0
Fatal accident statistics in 2012:
Fatal accident count: 4
Vehicles involved in fatal accidents: 4
Fatal accidents caused by drunken drivers: 2
Fatalities: 5
Persons involved in fatal accidents: 8
Pedestrians involved in fatal accidents: 0
Home Mortgage Disclosure Act Aggregated Statistics For Year 2009 (Based on 4 partial tracts)
A) FHA, FSA/RHS & VA Home Purchase Loans
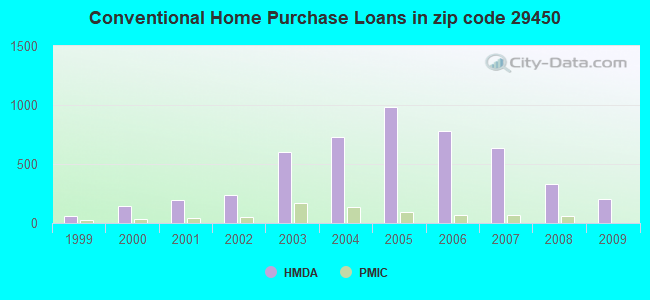
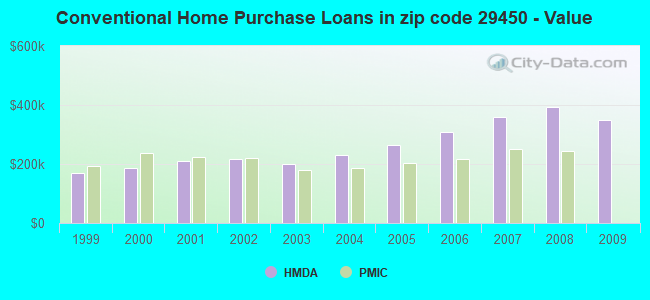
B) Conventional Home Purchase Loans
C) Refinancings
D) Home Improvement Loans
F) Non-occupant Loans on < 5 Family Dwellings (A B C & D)
G) Loans On Manufactured Home Dwelling (A B C & D)
Number
Average Value
Number
Average Value
Number
Average Value
Number
Average Value
Number
Average Value
Number
Average Value
LOANS ORIGINATED
86
$207,865
203
$349,648
535
$343,834
6
$36,313
96
$291,764
6
$84,112
APPLICATIONS APPROVED, NOT ACCEPTED
3
$214,840
13
$254,285
39
$324,340
2
$1,466,390
6
$343,543
1
$50,670
APPLICATIONS DENIED
7
$157,367
41
$411,490
204
$443,268
6
$75,498
34
$322,798
15
$79,721
APPLICATIONS WITHDRAWN
8
$230,169
31
$442,627
129
$383,191
1
$20,270
19
$269,564
0
$0
FILES CLOSED FOR INCOMPLETENESS
2
$224,975
10
$569,632
41
$346,039
0
$0
3
$422,587
1
$129,720
Aggregated Statistics For Year 2008 (Based on 4 partial tracts)
A) FHA, FSA/RHS & VA Home Purchase Loans
B) Conventional Home Purchase Loans
C) Refinancings
D) Home Improvement Loans
F) Non-occupant Loans on < 5 Family Dwellings (A B C & D)
G) Loans On Manufactured Home Dwelling (A B C & D)
Number
Average Value
Number
Average Value
Number
Average Value
Number
Average Value
Number
Average Value
Number
Average Value
LOANS ORIGINATED
48
$213,806
329
$393,107
342
$337,430
11
$106,960
130
$337,797
10
$101,644
APPLICATIONS APPROVED, NOT ACCEPTED
2
$168,730
45
$356,627
34
$226,406
5
$48,238
20
$267,132
5
$72,964
APPLICATIONS DENIED
5
$236,324
61
$498,892
133
$344,868
17
$77,138
25
$238,798
9
$74,316
APPLICATIONS WITHDRAWN
6
$222,272
50
$496,404
62
$497,449
1
$422,590
25
$433,289
1
$162,140
FILES CLOSED FOR INCOMPLETENESS
0
$0
9
$614,683
23
$404,567
0
$0
6
$173,967
0
$0
Aggregated Statistics For Year 2007 (Based on 4 partial tracts)
A) FHA, FSA/RHS & VA Home Purchase Loans
B) Conventional Home Purchase Loans
C) Refinancings
D) Home Improvement Loans
E) Loans on Dwellings For 5+ Families
F) Non-occupant Loans on < 5 Family Dwellings (A B C & D)
G) Loans On Manufactured Home Dwelling (A B C & D)
Number
Average Value
Number
Average Value
Number
Average Value
Number
Average Value
Number
Average Value
Number
Average Value
Number
Average Value
LOANS ORIGINATED
11
$209,774
639
$358,958
257
$379,824
20
$282,536
2
$2,146,380
195
$318,629
16
$81,389
APPLICATIONS APPROVED, NOT ACCEPTED
1
$28,380
83
$278,221
43
$352,263
8
$61,691
0
$0
22
$327,512
10
$65,871
APPLICATIONS DENIED
4
$182,412
93
$299,585
147
$300,049
22
$48,874
0
$0
43
$301,168
14
$72,820
APPLICATIONS WITHDRAWN
7
$237,426
92
$293,280
84
$345,280
7
$208,181
0
$0
23
$305,915
4
$69,672
FILES CLOSED FOR INCOMPLETENESS
0
$0
10
$425,121
25
$370,986
0
$0
0
$0
6
$278,010
0
$0
Aggregated Statistics For Year 2006 (Based on 4 partial tracts)
A) FHA, FSA/RHS & VA Home Purchase Loans
B) Conventional Home Purchase Loans
C) Refinancings
D) Home Improvement Loans
F) Non-occupant Loans on < 5 Family Dwellings (A B C & D)
G) Loans On Manufactured Home Dwelling (A B C & D)
Number
Average Value
Number
Average Value
Number
Average Value
Number
Average Value
Number
Average Value
Number
Average Value
LOANS ORIGINATED
9
$191,870
783
$307,556
261
$332,492
21
$183,136
283
$255,907
7
$83,823
APPLICATIONS APPROVED, NOT ACCEPTED
1
$192,550
58
$269,809
40
$230,700
1
$250,310
19
$194,146
9
$98,412
APPLICATIONS DENIED
0
$0
93
$299,029
81
$265,961
22
$74,116
29
$242,657
16
$62,008
APPLICATIONS WITHDRAWN
1
$184,440
84
$378,529
46
$277,341
4
$122,368
16
$246,889
2
$181,400
FILES CLOSED FOR INCOMPLETENESS
0
$0
10
$246,054
22
$239,991
1
$111,470
6
$318,208
0
$0
Aggregated Statistics For Year 2005 (Based on 4 partial tracts)
A) FHA, FSA/RHS & VA Home Purchase Loans
B) Conventional Home Purchase Loans
C) Refinancings
D) Home Improvement Loans
F) Non-occupant Loans on < 5 Family Dwellings (A B C & D)
G) Loans On Manufactured Home Dwelling (A B C & D)
Number
Average Value
Number
Average Value
Number
Average Value
Number
Average Value
Number
Average Value
Number
Average Value
LOANS ORIGINATED
21
$151,865
982
$262,809
305
$291,504
23
$144,828
357
$226,295
21
$77,356
APPLICATIONS APPROVED, NOT ACCEPTED
5
$113,096
76
$258,857
47
$259,581
7
$65,871
32
$299,365
8
$58,018
APPLICATIONS DENIED
4
$140,862
139
$230,844
146
$215,820
31
$70,252
46
$252,513
59
$64,841
APPLICATIONS WITHDRAWN
2
$182,920
123
$282,014
75
$257,525
6
$159,780
40
$243,545
2
$119,580
FILES CLOSED FOR INCOMPLETENESS
0
$0
23
$185,496
23
$155,887
1
$55,740
6
$76,173
4
$92,980
Aggregated Statistics For Year 2004 (Based on 4 partial tracts)
A) FHA, FSA/RHS & VA Home Purchase Loans
B) Conventional Home Purchase Loans
C) Refinancings
D) Home Improvement Loans
F) Non-occupant Loans on < 5 Family Dwellings (A B C & D)
G) Loans On Manufactured Home Dwelling (A B C & D)
Number
Average Value
Number
Average Value
Number
Average Value
Number
Average Value
Number
Average Value
Number
Average Value
LOANS ORIGINATED
16
$152,643
730
$229,127
206
$258,530
19
$117,608
213
$201,224
23
$69,440
APPLICATIONS APPROVED, NOT ACCEPTED
2
$151,505
57
$196,671
27
$200,203
3
$37,497
12
$183,848
8
$61,311
APPLICATIONS DENIED
3
$103,030
117
$186,881
94
$171,416
20
$87,254
27
$220,096
57
$53,532
APPLICATIONS WITHDRAWN
5
$150,186
93
$278,805
56
$199,224
11
$65,871
16
$303,957
5
$84,314
FILES CLOSED FOR INCOMPLETENESS
0
$0
17
$512,959
13
$190,987
2
$160,115
3
$658,033
0
$0
Aggregated Statistics For Year 2003 (Based on 4 partial tracts)
A) FHA, FSA/RHS & VA Home Purchase Loans
B) Conventional Home Purchase Loans
C) Refinancings
D) Home Improvement Loans
F) Non-occupant Loans on < 5 Family Dwellings (A B C & D)
Number
Average Value
Number
Average Value
Number
Average Value
Number
Average Value
Number
Average Value
LOANS ORIGINATED
33
$133,523
600
$200,285
318
$226,230
9
$98,750
139
$185,401
APPLICATIONS APPROVED, NOT ACCEPTED
2
$86,645
82
$141,678
58
$165,726
1
$304,020
12
$162,988
APPLICATIONS DENIED
19
$66,031
141
$84,601
110
$136,017
4
$36,990
16
$156,254
APPLICATIONS WITHDRAWN
2
$173,290
89
$254,625
50
$243,966
1
$152,010
9
$117,329
FILES CLOSED FOR INCOMPLETENESS
0
$0
18
$171,208
14
$138,836
1
$20,270
5
$135,390
Aggregated Statistics For Year 2002 (Based on 4 partial tracts)
A) FHA, FSA/RHS & VA Home Purchase Loans
B) Conventional Home Purchase Loans
C) Refinancings
D) Home Improvement Loans
F) Non-occupant Loans on < 5 Family Dwellings (A B C & D)
Number
Average Value
Number
Average Value
Number
Average Value
Number
Average Value
Number
Average Value
LOANS ORIGINATED
5
$174,912
237
$218,518
235
$215,501
3
$48,307
51
$201,607
APPLICATIONS APPROVED, NOT ACCEPTED
2
$45,095
30
$163,529
27
$167,211
0
$0
2
$137,820
APPLICATIONS DENIED
2
$125,660
65
$81,852
66
$126,905
7
$17,807
8
$126,675
APPLICATIONS WITHDRAWN
7
$158,959
40
$221,326
40
$164,627
1
$2,030
5
$227,610
FILES CLOSED FOR INCOMPLETENESS
0
$0
5
$334,422
14
$158,959
0
$0
2
$256,390
Aggregated Statistics For Year 2001 (Based on 4 partial tracts)
A) FHA, FSA/RHS & VA Home Purchase Loans
B) Conventional Home Purchase Loans
C) Refinancings
D) Home Improvement Loans
F) Non-occupant Loans on < 5 Family Dwellings (A B C & D)
Number
Average Value
Number
Average Value
Number
Average Value
Number
Average Value
Number
Average Value
LOANS ORIGINATED
1
$117,550
195
$210,818
130
$210,078
6
$14,863
23
$224,314
APPLICATIONS APPROVED, NOT ACCEPTED
0
$0
34
$123,516
18
$144,634
1
$17,230
4
$135,290
APPLICATIONS DENIED
1
$175,320
65
$64,483
84
$104,754
11
$13,451
3
$67,560
APPLICATIONS WITHDRAWN
0
$0
23
$193,339
27
$168,337
2
$36,480
7
$172,567
FILES CLOSED FOR INCOMPLETENESS
0
$0
2
$341,515
10
$89,078
0
$0
1
$53,710
Aggregated Statistics For Year 2000 (Based on 4 partial tracts)
A) FHA, FSA/RHS & VA Home Purchase Loans
B) Conventional Home Purchase Loans
C) Refinancings
D) Home Improvement Loans
F) Non-occupant Loans on < 5 Family Dwellings (A B C & D)
Number
Average Value
Number
Average Value
Number
Average Value
Number
Average Value
Number
Average Value
LOANS ORIGINATED
3
$122,283
142
$187,921
35
$132,003
0
$0
9
$388,470
APPLICATIONS APPROVED, NOT ACCEPTED
5
$48,644
17
$121,191
18
$89,798
3
$45,940
0
$0
APPLICATIONS DENIED
8
$40,789
88
$58,754
61
$66,702
14
$28,086
6
$69,587
APPLICATIONS WITHDRAWN
5
$85,126
14
$196,672
20
$137,062
1
$14,190
0
$0
FILES CLOSED FOR INCOMPLETENESS
0
$0
0
$0
6
$69,248
0
$0
0
$0
Aggregated Statistics For Year 1999 (Based on 2 partial tracts)
A) FHA, FSA/RHS & VA Home Purchase Loans
B) Conventional Home Purchase Loans
C) Refinancings
D) Home Improvement Loans
F) Non-occupant Loans on < 5 Family Dwellings (A B C & D)
Detailed PMIC statistics for the following Tracts:0204.02
2003 - 2018 National Fire Incident Reporting System (NFIRS) incidents
According to the data from the years 2003 - 2018 the average number of fire incidents per year is 13. The highest number of reported fires - 36 took place in 2015, and the least - 1 in 2003. The data has a rising trend.
When looking into fire subcategories, the most reports belonged to: Structure Fires (38.2%), and Outside Fires (36.3%).
Fire incident types reported to NFIRS in Zip Code 29450
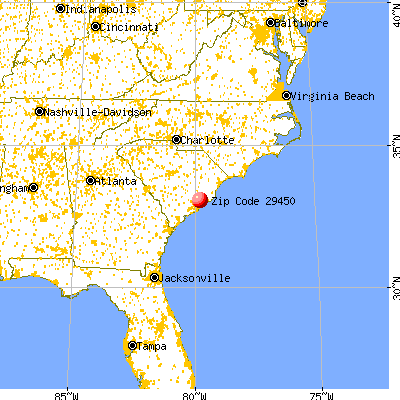


 Nearest zip codes: 29434, 29429, 29466, 29445, 29492, 29453.
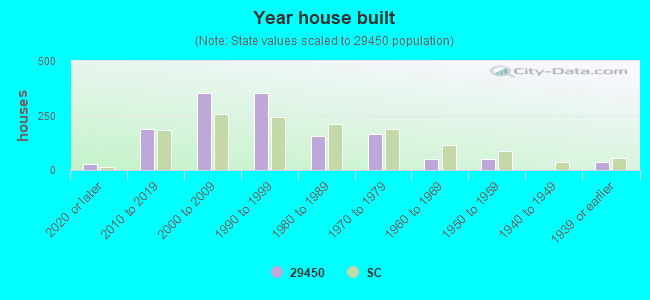


 (Students: 268, Location: 2434 CAINHOY ROAD, Grades: PK-8)
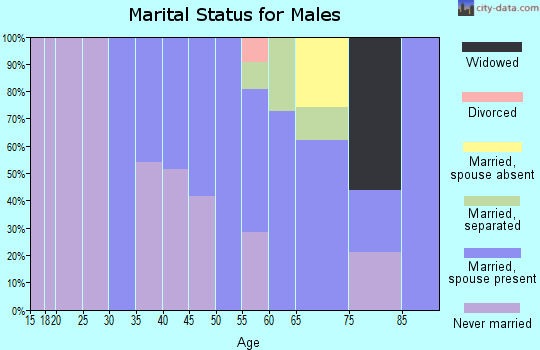
 According to the data from the years 2003 - 2018 the average number of fire incidents per year is 13. The highest number of reported fires - 36 took place in 2015, and the least - 1 in 2003. The data has a rising trend.
 When looking into fire subcategories, the most reports belonged to: Structure Fires (38.2%), and Outside Fires (36.3%).