Estimated zip code population in 2022: 4,797 Zip code population in 2010: 3,182 Zip code population in 2000: 2,225
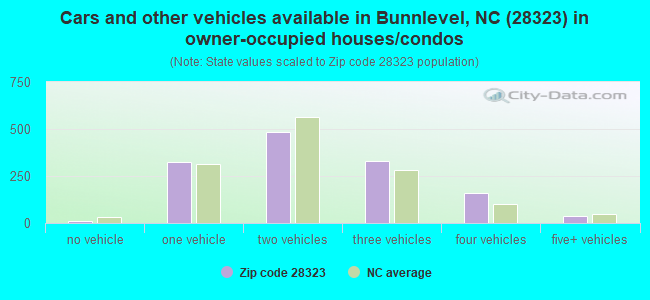
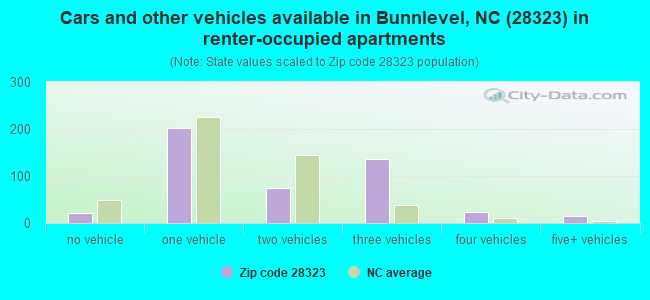
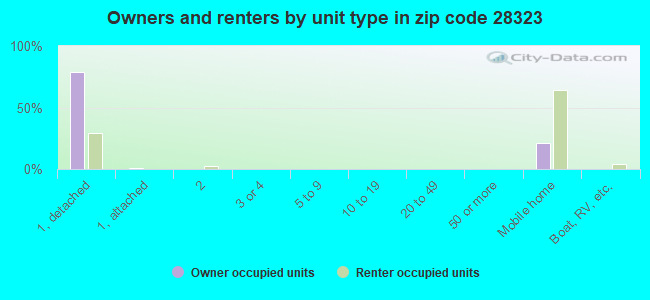
Houses and condos: 1,860 Renter-occupied apartments: 466
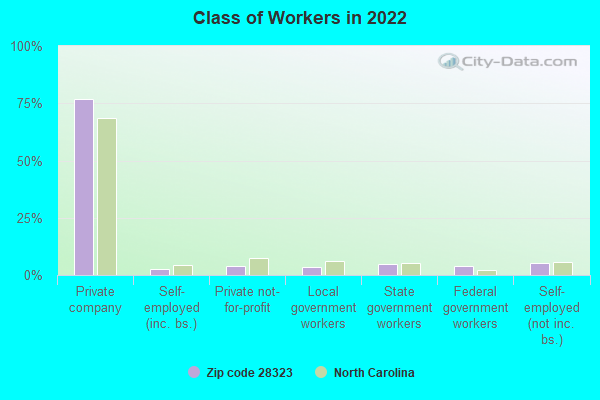
% of renters here:
26%
State:
33%
March 2022 cost of living index in zip code 28323: 82.0 (low, U.S. average is 100)
Land area: 37.6 sq. mi. Water area: 0.2 sq. mi.
Population density: 128 people per square mile
(very low).
OSM Map
General Map
Google Map
MSN Map
OSM Map
General Map
Google Map
MSN Map
OSM Map
General Map
Google Map
MSN Map
OSM Map
General Map
Google Map
MSN Map
Please wait while loading the map...
Real estate property taxes paid for housing units in 2022:
This zip code:
0.6% ($1,513)
North Carolina:
0.6% ($1,769)
Median real estate property taxes paid for housing units with mortgages in 2022: $1,896 (0.7%) Median real estate property taxes paid for housing units with no mortgage in 2022: $680 (0.7%)
Business Search- 14 Million verified businesses
Males: 2,384
(49.7%)
Females: 2,412
(50.3%)
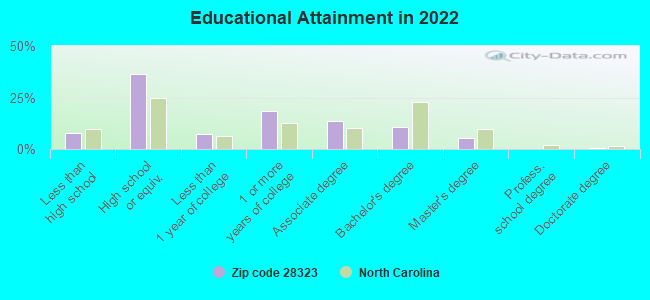
For population 25 years and over in 28323:
High school or higher: 90.5%
Bachelor's degree or higher: 16.5%
Graduate or professional degree: 5.8%
Unemployed: 3.3%
Mean travel time to work (commute): 32.0 minutes
For population 15 years and over in 28323:
Never married: 19.8%
Now married: 59.9%
Separated: 1.4%
Widowed: 6.4%
Divorced: 12.5%
Zip code 28323 compared to state average:
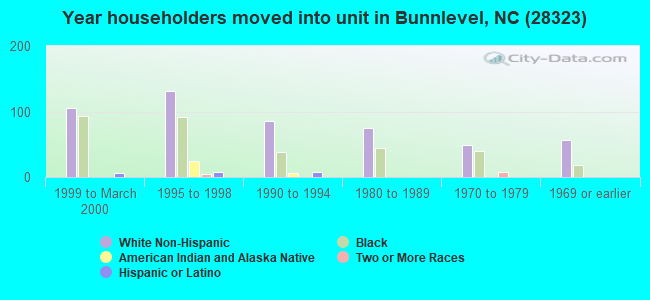
Length of stay since moving in significantly above state average.
Percentage of population with a bachelor's degree or higher below state average.
Averages for the 2020 tax year for zip code 28323, filed in 2021:
Average Adjusted Gross Income (AGI) in 2020: $50,139 (Individual Income Tax Returns)
Here:
$50,139
State:
$70,020
Salary/wage: $46,309 (reported on 88.7% of returns)
Here:
$46,309
State:
$58,387
(% of AGI for various income ranges: 1307.6% for AGIs below $25k, 4055.1% for AGIs $25k-50k, 6741.1% for AGIs $50k-75k, 9446.0% for AGIs $75k-100k, 16098.5% for AGIs $100k-200k)
Taxable interest for individuals: $382 (reported on 19.2% of returns)
This zip code:
$382
North Carolina:
$1,479
(% of AGI for various income ranges: 1.4% for AGIs below $25k, 5.7% for AGIs $25k-50k, 7.1% for AGIs $50k-75k, 10.0% for AGIs $75k-100k, 61.5% for AGIs $100k-200k)
Ordinary dividends: $994 (reported on 8.4% of returns)
Here:
$994
State:
$7,888
(% of AGI for various income ranges: 3.6% for AGIs $25k-50k, 8.9% for AGIs $50k-75k, 4.0% for AGIs $75k-100k, 93.1% for AGIs $100k-200k)
Net capital gain/loss in AGI: +$5,947 (reported on 9.4% of returns)
Here:
+$5,947
State:
+$23,652
(% of AGI for various income ranges: 13.4% for AGIs $25k-50k, 9.3% for AGIs $50k-75k, 96.0% for AGIs $75k-100k, 690.0% for AGIs $100k-200k)
Profit/loss from business: +$6,323 (reported on 14.8% of returns)
Here:
+$6,323
State:
+$11,710
(% of AGI for various income ranges: 27.6% for AGIs below $25k, 57.2% for AGIs $25k-50k, 94.6% for AGIs $50k-75k, 270.7% for AGIs $75k-100k, 627.7% for AGIs $100k-200k)
Taxable individual retirement arrangement distribution: $9,117 (reported on 3.0% of returns)
28323:
$9,117
North Carolina:
$20,247
(% of AGI for various income ranges: 72.3% for AGIs $25k-50k, 138.0% for AGIs $75k-100k)
Total itemized deductions: $25,167 (reported on 4.4% of returns)
Here:
$25,167
State:
$34,549
(% of AGI for various income ranges: 404.6% for AGIs $50k-75k, 870.8% for AGIs $100k-200k)
Charity contributions: $9,400 (reported on 3.4% of returns)
Here:
$9,400
State:
$13,360
(% of AGI for various income ranges: 93.2% for AGIs $50k-75k, 305.4% for AGIs $100k-200k)
Taxes paid: $6,044 (reported on 4.4% of returns)
28323:
$6,044
State:
$7,586
(% of AGI for various income ranges: 78.6% for AGIs $50k-75k, 249.2% for AGIs $100k-200k)
Earned income credit: $2,339 (reported on 24.1% of returns)
Here:
$2,339
State:
$2,337
(% of AGI for various income ranges: 133.3% for AGIs below $25k, 99.1% for AGIs $25k-50k)
Percentage of individuals using paid preparers for their 2020 taxes: 94.6%
Here:
95%
State:
93%
(% for various income ranges: 93.9% for AGIs below $25k, 94.9% for AGIs $25k-50k, 94.3% for AGIs $50k-75k, 100.0% for AGIs $75k-100k, 95.2% for AGIs $100k-200k, 66.7% for AGIs over 200k)
Averages for the 2012 tax year for zip code 28323, filed in 2013:
Average Adjusted Gross Income (AGI) in 2012: $43,333 (Individual Income Tax Returns)
Here:
$43,333
State:
$54,937
Salary/wage: $39,770 (reported on 92.0% of returns)
Here:
$39,770
State:
$46,336
(% of AGI for various income ranges: 85.7% for AGIs below $25k, 88.0% for AGIs $25k-50k, 86.4% for AGIs $50k-75k, 84.1% for AGIs $75k-100k, 79.8% for AGIs $100k-200k)
Taxable interest for individuals: $544 (reported on 24.0% of returns)
This zip code:
$544
North Carolina:
$1,298
(% of AGI for various income ranges: 0.4% for AGIs below $25k, 0.2% for AGIs $25k-50k, 0.3% for AGIs $50k-75k, 0.2% for AGIs $75k-100k, 0.4% for AGIs $100k-200k)
Ordinary dividends: $754 (reported on 8.7% of returns)
Here:
$754
State:
$6,213
(% of AGI for various income ranges: 0.2% for AGIs $25k-50k, 0.2% for AGIs $50k-75k, 0.1% for AGIs $75k-100k, 0.2% for AGIs $100k-200k)
Net capital gain/loss in AGI: +$2,145 (reported on 7.3% of returns)
Here:
+$2,145
State:
+$12,740
(% of AGI for various income ranges: 0.9% for AGIs below $25k, 0.9% for AGIs $50k-75k, 0.2% for AGIs $100k-200k)
Profit/loss from business: +$5,781 (reported on 10.7% of returns)
Here:
+$5,781
State:
+$10,311
(% of AGI for various income ranges: 3.7% for AGIs below $25k, 0.5% for AGIs $25k-50k, 0.9% for AGIs $50k-75k, 2.4% for AGIs $100k-200k)
Taxable individual retirement arrangement distribution: $5,820 (reported on 3.3% of returns)
28323:
$5,820
North Carolina:
$15,575
Total itemized deductions: $17,955 (23% of AGI, reported on 28.0% of returns)
Here:
$17,955
State:
$23,438
Here:
23.4% of AGI
State:
21.5% of AGI
(% of AGI for various income ranges: 7.3% for AGIs below $25k, 9.2% for AGIs $25k-50k, 11.6% for AGIs $50k-75k, 13.3% for AGIs $75k-100k, 14.4% for AGIs $100k-200k)
Charity contributions: $4,274 (reported on 20.7% of returns)
Here:
$4,274
State:
$4,687
(% of AGI for various income ranges: 1.0% for AGIs below $25k, 1.8% for AGIs $25k-50k, 2.0% for AGIs $50k-75k, 2.9% for AGIs $75k-100k, 2.2% for AGIs $100k-200k)
Taxes paid: $5,873 (reported on 27.3% of returns)
28323:
$5,873
State:
$8,823
(% of AGI for various income ranges: 1.1% for AGIs below $25k, 1.8% for AGIs $25k-50k, 3.1% for AGIs $50k-75k, 4.5% for AGIs $75k-100k, 6.3% for AGIs $100k-200k)
Earned income credit: $2,344 (reported on 30.0% of returns)
Here:
$2,344
State:
$2,376
(% of AGI for various income ranges: 10.1% for AGIs below $25k, 1.8% for AGIs $25k-50k)
Percentage of individuals using paid preparers for their 2012 taxes: 49.3%
Here:
49%
State:
53%
(% for various income ranges: 49.2% for AGIs below $25k, 43.6% for AGIs $25k-50k, 52.2% for AGIs $50k-75k, 50.0% for AGIs $75k-100k, 61.5% for AGIs $100k-200k)
Averages for the 2004 tax year for zip code 28323, filed in 2005:
Average Adjusted Gross Income (AGI) in 2004: $29,516 (Individual Income Tax Returns)
Here:
$29,516
State:
$45,376
Salary/wage: $27,975 (reported on 89.6% of returns)
Here:
$27,975
State:
$39,442
(% of AGI for various income ranges: 90.2% for AGIs below $10k, 86.7% for AGIs $10k-25k, 89.0% for AGIs $25k-50k, 86.8% for AGIs $50k-75k, 81.1% for AGIs $75k-100k, 70.5% for AGIs over 100k)
Taxable interest for individuals: $807 (reported on 22.9% of returns)
This zip code:
$807
North Carolina:
$1,515
(% of AGI for various income ranges: 1.3% for AGIs below $10k, 1.1% for AGIs $10k-25k, 0.4% for AGIs $25k-50k, 0.5% for AGIs $50k-75k, 0.6% for AGIs $75k-100k, 0.7% for AGIs over 100k)
Taxable dividends: $659 (reported on 8.1% of returns)
Here:
$659
State:
$4,016
(% of AGI for various income ranges: 0.1% for AGIs $10k-25k, 0.0% for AGIs $25k-50k, 0.1% for AGIs $50k-75k, 0.4% for AGIs $75k-100k, 0.6% for AGIs over 100k)
Net capital gain/loss: +$4,500 (reported on 6.6% of returns)
Here:
+$4,500
State:
+$11,152
(% of AGI for various income ranges: 2.1% for AGIs below $10k, 1.1% for AGIs $10k-25k, 0.7% for AGIs $25k-50k, 0.1% for AGIs $50k-75k, 3.8% for AGIs over 100k)
Profit/loss from business: +$3,643 (reported on 14.4% of returns)
Here:
+$3,643
State:
+$9,490
(% of AGI for various income ranges: 5.2% for AGIs below $10k, 3.6% for AGIs $10k-25k, 1.7% for AGIs $25k-50k, 2.1% for AGIs $50k-75k, -0.6% for AGIs $75k-100k)
IRA payment deduction: $3,611 (reported on 1.7% of returns)
28323:
$3,611
North Carolina:
$2,967
Total itemized deductions: $14,992 (27% of AGI, reported on 23.0% of returns)
Here:
$14,992
State:
$19,464
Here:
26.6% of AGI
State:
22.7% of AGI
(% of AGI for various income ranges: 8.4% for AGIs below $10k, 6.4% for AGIs $10k-25k, 9.9% for AGIs $25k-50k, 15.1% for AGIs $50k-75k, 17.2% for AGIs $75k-100k, 14.6% for AGIs over 100k)
Charity contributions deductions: $3,084 (5% of AGI, reported on 19.7% of returns)
Here:
$3,084
State:
$4,035
Here:
5.1% of AGI
State:
4.5% of AGI
(% of AGI for various income ranges: 1.4% for AGIs $10k-25k, 1.9% for AGIs $25k-50k, 3.2% for AGIs $50k-75k, 2.2% for AGIs $75k-100k, 2.2% for AGIs over 100k)
Total tax: $3,299 (reported on 62.4% of returns)
28323:
$3,299
State:
$7,257
(% of AGI for various income ranges: 2.2% for AGIs below $10k, 2.9% for AGIs $10k-25k, 4.9% for AGIs $25k-50k, 8.4% for AGIs $50k-75k, 10.4% for AGIs $75k-100k, 14.6% for AGIs over 100k)
Earned income credit: $1,914 (reported on 34.3% of returns)
Here:
$1,914
State:
$1,851
Percentage of individuals using paid preparers for their 2004 taxes: 65.4%
Here:
65%
State:
62%
(% for various income ranges: 64.4% for AGIs below $10k, 68.0% for AGIs $10k-25k, 64.3% for AGIs $25k-50k, 62.9% for AGIs $50k-75k, 59.1% for AGIs $75k-100k, 71.0% for AGIs over 100k)
Likely homosexual households (counted as self-reported same-sex unmarried-partner households)
Lesbian couples: 0.3% of all households
Gay men: 0.0% of all households
Household received Food Stamps/SNAP in the past 12 months: 282 Household did not receive Food Stamps/SNAP in the past 12 months: 1,526
Women who had a birth in the past 12 months: 74 (76 now married, 0 unmarried) Women who did not have a birth in the past 12 months: 979 (570 now married, 412 unmarried)
Housing units in zip code 28323 with a mortgage: 843 (27 second mortgage, 19 both second mortgage and home equity loan) Houses without a mortgage: 6
Median monthly owner costs for units with a mortgage: $1,416 Median monthly owner costs for units without a mortgage: $419
Residents with income below the poverty level in 2022:
This zip code:
10.5%
Whole state:
12.8%
Residents with income below 50% of the poverty level in 2022:
This zip code:
5.1%
Whole state:
6.8%
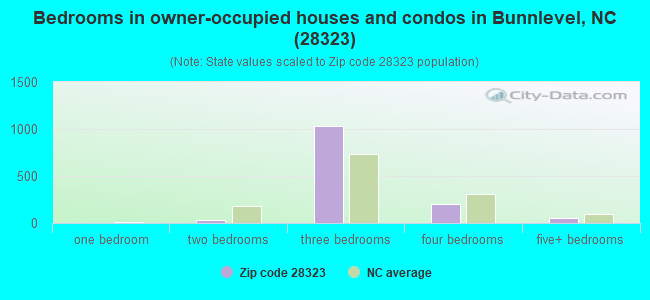
Median number of rooms in houses and condos:
Here:
6.4
State:
6.4
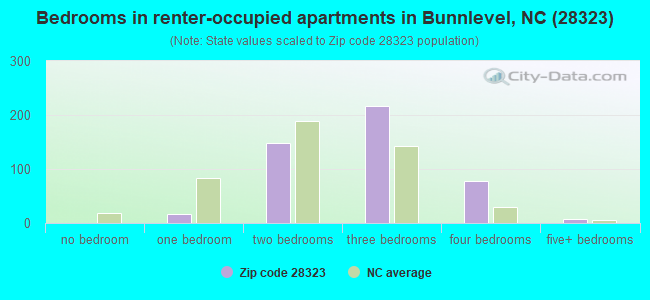
Median number of rooms in apartments:
Here:
5.2
State:
4.4
Notable locations in this zip code not listed on our city pages
Churches in zip code 28323 include: Harmony Church (A), Anderson Church (B), McLeans Church (C), Friendship Church (D), Tabernacle Church (E). Display/hide their locations on the map
Streams, rivers, and creeks: Duncans Creek (A), Big Swamp (B), Smith Branch (C), Kates Creek (D), Gardners Branch (E). Display/hide their locations on the map
In group quarters: 9 (-1 institutionalized population)
Size of family households: 675 2-persons, 382 3-persons, 229 4-persons, 61 5-persons, 39 6-persons, 7 7-or-more-persons
Size of nonfamily households: 335 1-person, 75 2-persons
683 married couples with children.
429 single-parent households (119 men, 310 women).
88.7% of residents of 28323 zip code speak English at home.
9.8% of residents speak Spanish at home (85% very well, 12% well, 2% not well, 1% not at all).
1.2% of residents speak other Indo-European language at home (38% very well, 62% not well).
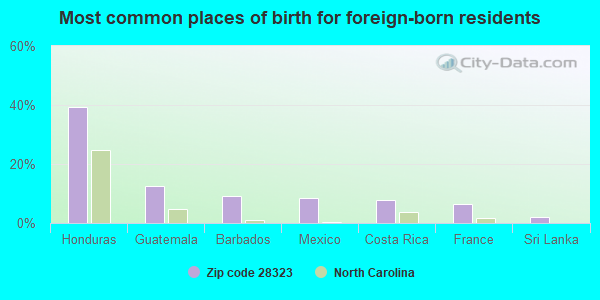
Foreign born population: 401 (8.4%) (40.6% of them are naturalized citizens)
This zip code:
8.4%
Whole state:
8.6%
39%Honduras
12%Guatemala
9%Barbados
8%Mexico
8%Costa Rica
6%France
2%Sri Lanka
8%Irish
7%English
7%American
5%Armenian
4%German
2%Scottish
1%Scotch-Irish
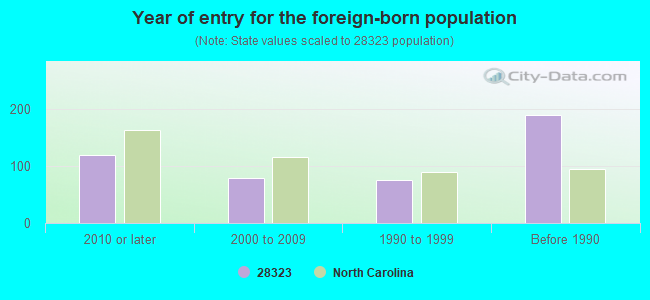
Year of entry for the foreign-born population
1192010 or later
792000 to 2009
751990 to 1999
189Before 1990
Facilities with environmental interests located in this zip code:
ANDERSON CREEK PRIMARY (914 ANDERSON CREEK SCH RD in BUNNLEVEL, NC)
(National Center for Education Statistics) - STATE ID-304 Organizations: HARNETT COUNTY SCHOOLS (SCHOOL DISTRICT)
Housing units lacking complete plumbing facilities: 1.4% Housing units lacking complete kitchen facilities: 0.8%
75.4%Electricity
19.0%Bottled, tank, or LP gas
2.4%No fuel used
1.4%Fuel oil, kerosene, etc.
1.1%Wood
0.9%Utility gas
Population in 1990: 4,749.
Place of birth for U.S.-born residents:
This state: 2,942
Northeast: 402
Midwest: 272
South: 563
West: 129
53% of the 28323 zip code residents lived in the same house 5 years ago. Out of people who lived in different houses, 50% lived in this county. Out of people who lived in different counties, 50% lived in North Carolina.
91% of the 28323 zip code residents lived in the same house 1 year ago. Out of people who lived in different houses, 14% moved from this county. Out of people who lived in different houses, 62% moved from different county within same state. Out of people who lived in different houses, 24% moved from different state. Out of people who lived in different houses, 8% moved from abroad.
Private vs. public school enrollment:
Students in private schools in grades 1 to 8 (elementary and middle school): 68
Here:
11.2%
North Carolina:
13.8%
Students in private schools in grades 9 to 12 (high school): 46
Here:
29.4%
North Carolina:
11.9%
Students in private undergraduate colleges: 58
Here:
28.1%
North Carolina:
19.3%
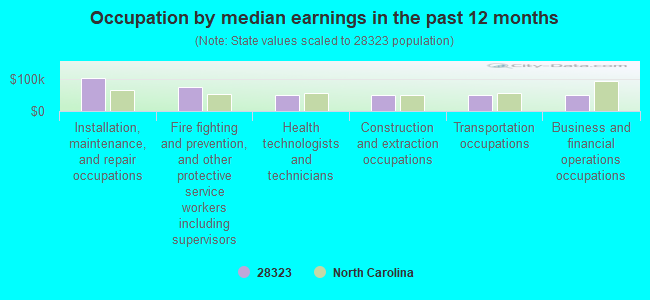
Occupation by median earnings in the past 12 months ($)
103,474Installation, maintenance, and repair occupations
75,930Fire fighting and prevention, and other protective service workers including supervisors
50,315Health technologists and technicians
48,425Construction and extraction occupations
48,340Transportation occupations
48,245Business and financial operations occupations
Top industries in this zip code by the number of employees in 2005:
Mining: Crushed and Broken Granite Mining and Quarrying (20-49 employees: 1 establishment)
Other Services (except Public Administration): Religious Organizations (5-9: 3, 1-4: 1)
Health Care and Social Assistance: Other Residential Care Facilities (5-9: 1)
Finance and Insurance: Insurance Agencies and Brokerages (5-9: 1)
Construction: Masonry Contractors (1-4: 1)
Construction: Tile and Terrazzo Contractors (1-4: 1)
Management of Companies and Enterprises: Corporate, Subsidiary, and Regional Managing Offices (1-4: 1)
Construction: Water and Sewer Line and Related Structures Construction (1-4: 1)
Construction: All Other Specialty Trade Contractors (1-4: 1)
Health Care and Social Assistance: Homes for the Elderly (1-4: 1)
Fatal accident statistics in 2014:
Fatal accident count: 1
Vehicles involved in fatal accidents: 2
Fatal accidents caused by drunken drivers: 0
Fatalities: 1
Persons involved in fatal accidents: 4
Pedestrians involved in fatal accidents: 0
2002 - 2018 National Fire Incident Reporting System (NFIRS) incidents
According to the data from the years 2002 - 2018 the average number of fires per year is 71. The highest number of fire incidents - 103 took place in 2002, and the least - 38 in 2017. The data has a decreasing trend.
When looking into fire subcategories, the most incidents belonged to: Outside Fires (46.1%), and Structure Fires (40.5%).
Fire incident types reported to NFIRS in Zip Code 28323


 Nearest zip codes: 27546, 28356, 28339, 28390, 28311, 28395.


 According to the data from the years 2002 - 2018 the average number of fires per year is 71. The highest number of fire incidents - 103 took place in 2002, and the least - 38 in 2017. The data has a decreasing trend.
 When looking into fire subcategories, the most incidents belonged to: Outside Fires (46.1%), and Structure Fires (40.5%).