Estimated zip code population in 2022: 6,934 Zip code population in 2010: 8,201 Zip code population in 2000: 8,849
Houses and condos: 3,545 Renter-occupied apartments: 1,012
% of renters here:
37%
State:
33%
March 2022 cost of living index in zip code 27823: 79.2 (low, U.S. average is 100)
Land area: 188.9 sq. mi. Water area: 0.7 sq. mi.
Population density: 37 people per square mile
(very low).
OSM Map
General Map
Google Map
MSN Map
OSM Map
General Map
Google Map
MSN Map
OSM Map
General Map
Google Map
MSN Map
OSM Map
General Map
Google Map
MSN Map
Please wait while loading the map...
Real estate property taxes paid for housing units in 2022:
This zip code:
0.9% ($872)
North Carolina:
0.6% ($1,769)
Median real estate property taxes paid for housing units with mortgages in 2022: $999 (0.7%) Median real estate property taxes paid for housing units with no mortgage in 2022: $785 (1.1%)
Business Search- 14 Million verified businesses
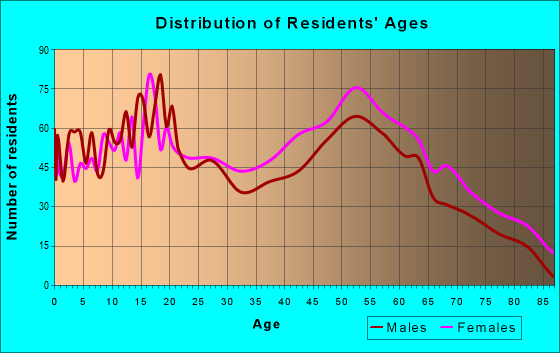
Males: 3,134
(45.2%)
Females: 3,800
(54.8%)
For population 25 years and over in 27823:
High school or higher: 77.3%
Bachelor's degree or higher: 8.8%
Graduate or professional degree: 3.7%
Unemployed: 8.6%
Mean travel time to work (commute): 26.5 minutes
For population 15 years and over in 27823:
Never married: 45.5%
Now married: 34.5%
Separated: 4.2%
Widowed: 7.9%
Divorced: 8.0%
Zip code 27823 compared to state average:
Median household income below state average.
Median house value significantly below state average.
Unemployed percentage above state average.
Black race population percentage significantly above state average.
Hispanic race population percentage significantly below state average.
Foreign-born population percentage significantly below state average.
Length of stay since moving in significantly above state average.
Percentage of population with a bachelor's degree or higher significantly below state average.
Estimated median house/condo value in 2022: $97,117
27823:
$97,117
North Carolina:
$280,600
According to our research of North Carolina and other state lists, there were 16 registered sex offenders living in 27823 zip code as of June 03, 2024. The ratio of all residents to sex offenders in zip code 27823 is 504 to 1. The ratio of registered sex offenders to all residents in this zip code is near the state average.
Median resident age:
This zip code:
39.6 years
North Carolina median age:
39.2 years
Average household size:
This zip code:
2.5 people
North Carolina:
2.4 people
Averages for the 2020 tax year for zip code 27823, filed in 2021:
Average Adjusted Gross Income (AGI) in 2020: $36,690 (Individual Income Tax Returns)
Here:
$36,690
State:
$70,020
Salary/wage: $31,524 (reported on 85.6% of returns)
Here:
$31,524
State:
$58,387
(% of AGI for various income ranges: 1374.2% for AGIs below $25k, 4066.2% for AGIs $25k-50k, 7754.8% for AGIs $50k-75k, 12797.1% for AGIs $75k-100k, 22264.0% for AGIs $100k-200k)
Taxable interest for individuals: $526 (reported on 15.4% of returns)
This zip code:
$526
North Carolina:
$1,479
(% of AGI for various income ranges: 2.0% for AGIs below $25k, 8.2% for AGIs $25k-50k, 17.4% for AGIs $50k-75k, 47.1% for AGIs $75k-100k, 58.0% for AGIs $100k-200k)
Ordinary dividends: $5,021 (reported on 4.6% of returns)
Here:
$5,021
State:
$7,888
(% of AGI for various income ranges: 4.6% for AGIs below $25k, 10.3% for AGIs $25k-50k, 63.9% for AGIs $50k-75k, 860.0% for AGIs $100k-200k)
Net capital gain/loss in AGI: +$7,500 (reported on 4.9% of returns)
Here:
+$7,500
State:
+$23,652
(% of AGI for various income ranges: 0.1% for AGIs $25k-50k, 97.0% for AGIs $50k-75k, 1830.0% for AGIs $100k-200k)
Profit/loss from business: +$215 (reported on 13.1% of returns)
Here:
+$215
State:
+$11,710
(% of AGI for various income ranges: 15.7% for AGIs $50k-75k, 1228.0% for AGIs $100k-200k)
Taxable individual retirement arrangement distribution: $11,529 (reported on 4.6% of returns)
27823:
$11,529
North Carolina:
$20,247
(% of AGI for various income ranges: 18.1% for AGIs below $25k, 40.0% for AGIs $25k-50k, 336.1% for AGIs $50k-75k, 700.0% for AGIs $100k-200k)
Total itemized deductions: $29,893 (reported on 4.6% of returns)
Here:
$29,893
State:
$34,549
(% of AGI for various income ranges: 211.0% for AGIs $25k-50k, 811.7% for AGIs $50k-75k, 1598.0% for AGIs $100k-200k)
Charity contributions: $9,575 (reported on 3.9% of returns)
Here:
$9,575
State:
$13,360
(% of AGI for various income ranges: 34.3% for AGIs $25k-50k, 235.7% for AGIs $50k-75k, 720.0% for AGIs $100k-200k)
Taxes paid: $4,829 (reported on 4.6% of returns)
27823:
$4,829
State:
$7,586
(% of AGI for various income ranges: 22.4% for AGIs $25k-50k, 127.8% for AGIs $50k-75k, 442.0% for AGIs $100k-200k)
Earned income credit: $2,613 (reported on 33.7% of returns)
Here:
$2,613
State:
$2,337
(% of AGI for various income ranges: 169.3% for AGIs below $25k, 110.4% for AGIs $25k-50k)
Percentage of individuals using paid preparers for their 2020 taxes: 86.9%
Here:
87%
State:
93%
(% for various income ranges: 88.7% for AGIs below $25k, 87.6% for AGIs $25k-50k, 81.6% for AGIs $50k-75k, 86.7% for AGIs $75k-100k, 83.3% for AGIs $100k-200k, 66.7% for AGIs over 200k)
Averages for the 2012 tax year for zip code 27823, filed in 2013:
Average Adjusted Gross Income (AGI) in 2012: $29,410 (Individual Income Tax Returns)
Here:
$29,410
State:
$54,937
Salary/wage: $25,389 (reported on 88.7% of returns)
Here:
$25,389
State:
$46,336
(% of AGI for various income ranges: 82.9% for AGIs below $25k, 85.9% for AGIs $25k-50k, 77.3% for AGIs $50k-75k, 65.4% for AGIs $75k-100k, 46.3% for AGIs $100k-200k)
Taxable interest for individuals: $830 (reported on 16.1% of returns)
This zip code:
$830
North Carolina:
$1,298
(% of AGI for various income ranges: 0.4% for AGIs below $25k, 0.3% for AGIs $25k-50k, 0.4% for AGIs $50k-75k, 0.6% for AGIs $75k-100k, 1.1% for AGIs $100k-200k)
Ordinary dividends: $5,025 (reported on 5.2% of returns)
Here:
$5,025
State:
$6,213
(% of AGI for various income ranges: 0.3% for AGIs below $25k, 2.3% for AGIs $50k-75k, 2.9% for AGIs $100k-200k)
Net capital gain/loss in AGI: +$3,115 (reported on 4.2% of returns)
Here:
+$3,115
State:
+$12,740
(% of AGI for various income ranges: 0.1% for AGIs below $25k, 0.8% for AGIs $75k-100k, 2.4% for AGIs $100k-200k)
Profit/loss from business: +$3,558 (reported on 10.6% of returns)
Here:
+$3,558
State:
+$10,311
(% of AGI for various income ranges: 1.9% for AGIs below $25k, 0.3% for AGIs $25k-50k, 0.5% for AGIs $50k-75k, 4.5% for AGIs $100k-200k)
Taxable individual retirement arrangement distribution: $8,807 (reported on 4.8% of returns)
27823:
$8,807
North Carolina:
$15,575
(% of AGI for various income ranges: 1.2% for AGIs below $25k, 0.9% for AGIs $25k-50k, 2.7% for AGIs $50k-75k, 4.3% for AGIs $75k-100k)
Total itemized deductions: $17,169 (29% of AGI, reported on 19.0% of returns)
Here:
$17,169
State:
$23,438
Here:
29.5% of AGI
State:
21.5% of AGI
(% of AGI for various income ranges: 4.9% for AGIs below $25k, 11.0% for AGIs $25k-50k, 15.8% for AGIs $50k-75k, 16.7% for AGIs $75k-100k, 13.9% for AGIs $100k-200k)
Charity contributions: $3,892 (reported on 16.8% of returns)
Here:
$3,892
State:
$4,687
(% of AGI for various income ranges: 0.6% for AGIs below $25k, 2.1% for AGIs $25k-50k, 3.3% for AGIs $50k-75k, 4.7% for AGIs $75k-100k, 2.6% for AGIs $100k-200k)
Taxes paid: $4,231 (reported on 18.7% of returns)
27823:
$4,231
State:
$8,823
(% of AGI for various income ranges: 0.9% for AGIs below $25k, 2.1% for AGIs $25k-50k, 3.8% for AGIs $50k-75k, 4.6% for AGIs $75k-100k, 5.2% for AGIs $100k-200k)
Earned income credit: $2,701 (reported on 46.1% of returns)
Here:
$2,701
State:
$2,376
(% of AGI for various income ranges: 13.3% for AGIs below $25k, 2.1% for AGIs $25k-50k)
Percentage of individuals using paid preparers for their 2012 taxes: 50.3%
Here:
50%
State:
53%
(% for various income ranges: 50.6% for AGIs below $25k, 47.8% for AGIs $25k-50k, 50.0% for AGIs $50k-75k, 60.0% for AGIs $75k-100k, 62.5% for AGIs $100k-200k)
Averages for the 2004 tax year for zip code 27823, filed in 2005:
Average Adjusted Gross Income (AGI) in 2004: $24,716 (Individual Income Tax Returns)
Here:
$24,716
State:
$45,376
Salary/wage: $22,491 (reported on 90.4% of returns)
Here:
$22,491
State:
$39,442
(% of AGI for various income ranges: 109.6% for AGIs below $10k, 89.1% for AGIs $10k-25k, 89.7% for AGIs $25k-50k, 75.6% for AGIs $50k-75k, 72.2% for AGIs $75k-100k, 42.2% for AGIs over 100k)
Taxable interest for individuals: $1,211 (reported on 18.6% of returns)
This zip code:
$1,211
North Carolina:
$1,515
(% of AGI for various income ranges: 2.2% for AGIs below $10k, 0.6% for AGIs $10k-25k, 0.6% for AGIs $25k-50k, 0.7% for AGIs $50k-75k, 1.0% for AGIs $75k-100k, 2.6% for AGIs over 100k)
Taxable dividends: $3,448 (reported on 7.2% of returns)
Here:
$3,448
State:
$4,016
(% of AGI for various income ranges: 2.4% for AGIs below $10k, 0.3% for AGIs $10k-25k, 0.3% for AGIs $25k-50k, 0.9% for AGIs $50k-75k, 1.5% for AGIs $75k-100k, 4.6% for AGIs over 100k)
Net capital gain/loss: +$5,945 (reported on 4.9% of returns)
Here:
+$5,945
State:
+$11,152
(% of AGI for various income ranges: -0.3% for AGIs below $10k, 0.2% for AGIs $10k-25k, 0.3% for AGIs $25k-50k, 0.1% for AGIs $50k-75k, 0.8% for AGIs $75k-100k, 9.5% for AGIs over 100k)
Profit/loss from business: +$3,620 (reported on 8.3% of returns)
Here:
+$3,620
State:
+$9,490
(% of AGI for various income ranges: 7.0% for AGIs below $10k, 1.2% for AGIs $10k-25k, 0.5% for AGIs $25k-50k, 1.0% for AGIs $50k-75k, 2.5% for AGIs over 100k)
IRA payment deduction: $2,000 (reported on 1.1% of returns)
27823:
$2,000
North Carolina:
$2,967
Total itemized deductions: $14,239 (27% of AGI, reported on 18.2% of returns)
Here:
$14,239
State:
$19,464
Here:
26.5% of AGI
State:
22.7% of AGI
(% of AGI for various income ranges: 2.8% for AGIs below $10k, 4.4% for AGIs $10k-25k, 10.8% for AGIs $25k-50k, 17.7% for AGIs $50k-75k, 18.3% for AGIs $75k-100k, 13.9% for AGIs over 100k)
Charity contributions deductions: $3,320 (6% of AGI, reported on 16.2% of returns)
Here:
$3,320
State:
$4,035
Here:
6.0% of AGI
State:
4.5% of AGI
(% of AGI for various income ranges: 0.8% for AGIs $10k-25k, 2.1% for AGIs $25k-50k, 4.2% for AGIs $50k-75k, 4.4% for AGIs $75k-100k, 2.9% for AGIs over 100k)
Total tax: $3,010 (reported on 50.7% of returns)
27823:
$3,010
State:
$7,257
(% of AGI for various income ranges: 2.2% for AGIs below $10k, 1.9% for AGIs $10k-25k, 5.1% for AGIs $25k-50k, 8.2% for AGIs $50k-75k, 10.2% for AGIs $75k-100k, 17.8% for AGIs over 100k)
Earned income credit: $2,076 (reported on 48.5% of returns)
Here:
$2,076
State:
$1,851
Percentage of individuals using paid preparers for their 2004 taxes: 63.4%
Here:
63%
State:
62%
(% for various income ranges: 58.2% for AGIs below $10k, 67.5% for AGIs $10k-25k, 61.5% for AGIs $25k-50k, 61.1% for AGIs $50k-75k, 56.2% for AGIs $75k-100k, 83.3% for AGIs over 100k)
Household received Food Stamps/SNAP in the past 12 months: 1,317 Household did not receive Food Stamps/SNAP in the past 12 months: 1,515
Women who had a birth in the past 12 months: 29 (23 now married, 5 unmarried) Women who did not have a birth in the past 12 months: 1,536 (456 now married, 1,075 unmarried)
Housing units in zip code 27823 with a mortgage: 787 (62 second mortgage, 21 both second mortgage and home equity loan) Houses without a mortgage: 102
Median monthly owner costs for units with a mortgage: $1,141 Median monthly owner costs for units without a mortgage: $440
Residents with income below the poverty level in 2022:
This zip code:
28.0%
Whole state:
12.8%
Residents with income below 50% of the poverty level in 2022:
This zip code:
20.0%
Whole state:
6.8%
Median number of rooms in houses and condos:
Here:
5.4
State:
6.4
Median number of rooms in apartments:
Here:
4.7
State:
4.4
Notable locations in this zip code not listed on our city pages
Notable locations in zip code 27823: Wards Crossroads (A), Medoc Mountain State Park Office (B), Enfield Police Department (C). Display/hide their locations on the map
Churches in zip code 27823 include: Antioch Church (A), Turkey Branch Church (B), Union Church (C), Wayman Church (D), Whitaker Chapel (E), Mount Calvary Church (F), Perry Grove Church (G), Pleasant Hill Church (H), Plumline Church (I). Display/hide their locations on the map
Cemeteries: Davis Cemetery (1), Elmwood Cemetery (2), Lewis Cemetery (3), Coefield Cemetery (4), Overstreet Cemetery (5), Pettitt Cemetery (6), Pittman Cemetery (7). Display/hide their locations on the map
Reservoirs and swamps: Moss Lake (A), Moss Lake Number One (B), Moss Lake Number Two (C), Fishing Creek Millpond (D), Hoerner Waldorf Pond (E), Beech Swamp (F). Display/hide their locations on the map
Streams, rivers, and creeks: Cow Haul Swamp (A), Crooked Swamp (B), Burnt Coat Swamp (C), Breeches Swamp (D), Beaverdam Swamp (E), Dog Pond Branch (F), Powells Creek (G), Marsh Swamp (H), Little Fishing Creek (I). Display/hide their locations on the map
In group quarters: 57 (-1 institutionalized population)
Size of family households: 738 2-persons, 512 3-persons, 284 4-persons, 156 5-persons, 24 6-persons, 36 7-or-more-persons
Size of nonfamily households: 868 1-person, 102 2-persons, 14 3-persons
332 married couples with children.
683 single-parent households (76 men, 607 women).
97.3% of residents of 27823 zip code speak English at home.
1.2% of residents speak Spanish at home (100% very well).
0.9% of residents speak other Indo-European language at home (25% very well, 75% not well).
0.3% of residents speak other language at home (100% very well).
Foreign born population: 100 (1.5%) (93.9% of them are naturalized citizens)
This zip code:
1.5%
Whole state:
8.6%
49%Grenada
33%Honduras
9%United Arab Emirates
5%Bhutan
21%American
2%Irish
2%English
1%Haitian
1%African
0%Italian
0%German
Year of entry for the foreign-born population
72010 or later
02000 to 2009
101990 to 1999
76Before 1990
Facilities with environmental interests located in this zip code:
A AND B MILLING COMPANY INCORPORATED (200 HALIFAX ST in ENFIELD, NC)
AIR MINOR (AIRS/AFS) STATE MASTER (North Carolina facility info) - UNDERGROUND STORAGE TANK PROGRAM, AIR PROGRAM Business SIC classification: FLOUR AND OTHER GRAIN MILL PRODUCTS; NONCLASSIFIABLE ESTABLISHMENTS Alternative names: A AND B MILLING CO INCORPORATED
CHEMICAL SPECIALTIES INC (STATE HWY 561 1 MI W OF I 95 in ENFIELD, NC)
(Resource Conservation and Recovery Act (tracking hazardous waste))
ALLEGHENY WOOD PRODUCTS, INC.- (US HWY 301 S in ENFIELD, NC)
National Pollutant Discharge Elimination System NON-MAJOR (Tracking pollutant discharge elimination systems) - permit Business SIC classification: SAWMILLS AND PLANING MILLS, GENERAL Alternative names: ALLEGHENY WOOD PRODUCTS INC EN
Housing units lacking complete plumbing facilities: 9.4% Housing units lacking complete kitchen facilities: 9.4%
54.9%Electricity
20.8%Utility gas
18.5%Bottled, tank, or LP gas
2.9%Fuel oil, kerosene, etc.
2.7%Wood
Population in 1990: 8,876.
Place of birth for U.S.-born residents:
This state: 6,018
Northeast: 276
Midwest: 10
South: 374
West: 37
72% of the 27823 zip code residents lived in the same house 5 years ago. Out of people who lived in different houses, 76% lived in this county. Out of people who lived in different counties, 50% lived in North Carolina.
93% of the 27823 zip code residents lived in the same house 1 year ago. Out of people who lived in different houses, 68% moved from this county. Out of people who lived in different houses, 21% moved from different county within same state. Out of people who lived in different houses, 10% moved from different state.
Private vs. public school enrollment:
Students in private schools in grades 1 to 8 (elementary and middle school): 24
Here:
4.2%
North Carolina:
13.8%
Students in private schools in grades 9 to 12 (high school): 12
Here:
2.8%
North Carolina:
11.9%
Students in private undergraduate colleges: 35
Here:
20.3%
North Carolina:
19.3%
Occupation by median earnings in the past 12 months ($)
86,115Health diagnosing and treating practitioners and other technical occupations
49,209Management occupations
48,627Transportation occupations
45,702Installation, maintenance, and repair occupations
44,471Education, training, and library occupations
42,262Health technologists and technicians
Top industries in this zip code by the number of employees in 2005:
Health Care and Social Assistance: Home Health Care Services (50-99 employees: 1 establishment, 1-4 employees: 1 establishment)
Health Care and Social Assistance: Nursing Care Facilities (50-99: 1)
Health Care and Social Assistance: All Other Miscellaneous Ambulatory Health Care Services (50-99: 1)
Accommodation and Food Services: Limited-Service Restaurants (20-49: 1, 10-19: 1)
Utilities: Electric Power Distribution (10-19: 2, 5-9: 1)
Other Services (except Public Administration): Religious Organizations (10-19: 1, 5-9: 2, 1-4: 4)
People in group quarters in 2010:
54 people in nursing facilities/skilled-nursing facilities
6 people in group homes intended for adults
3 people in emergency and transitional shelters (with sleeping facilities) for people experiencing homelessness
People in group quarters in 2000:
133 people in nursing homes
Fatal accident statistics in 2013:
Fatal accident count: 3
Vehicles involved in fatal accidents: 5
Fatal accidents caused by drunken drivers: 1
Fatalities: 3
Persons involved in fatal accidents: 10
Pedestrians involved in fatal accidents: 1
Fatal accident statistics in 2012:
Fatal accident count: 2
Vehicles involved in fatal accidents: 7
Fatal accidents caused by drunken drivers: 1
Fatalities: 2
Persons involved in fatal accidents: 13
Pedestrians involved in fatal accidents: 0
2002 - 2018 National Fire Incident Reporting System (NFIRS) incidents
Based on the data from the years 2002 - 2018 the average number of fire incidents per year is 80. The highest number of fires - 136 took place in 2008, and the least - 57 in 2013. The data has a declining trend.
When looking into fire subcategories, the most incidents belonged to: Structure Fires (41.0%), and Outside Fires (36.1%).
Fire incident types reported to NFIRS in Zip Code 27823


 Nearest zip codes: 27891, 27839, 27809, 27870, 27844, 27890.


 Based on the data from the years 2002 - 2018 the average number of fire incidents per year is 80. The highest number of fires - 136 took place in 2008, and the least - 57 in 2013. The data has a declining trend.
 When looking into fire subcategories, the most incidents belonged to: Structure Fires (41.0%), and Outside Fires (36.1%).