Estimated zip code population in 2022: 1,648 Zip code population in 2010: 2,937 Zip code population in 2000: 1,967
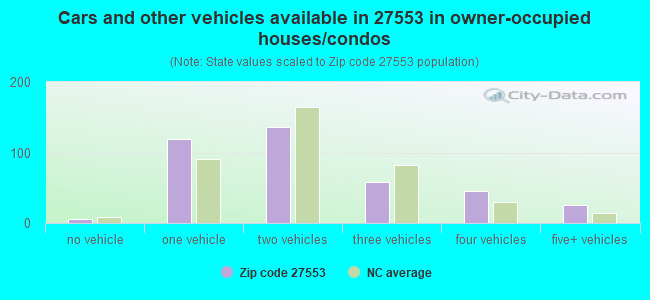
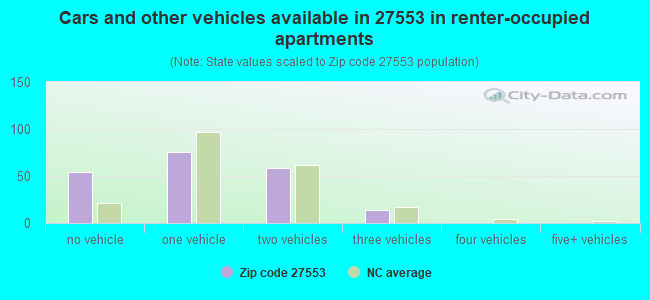
Houses and condos: 1,026 Renter-occupied apartments: 206
% of renters here:
35%
State:
33%
March 2022 cost of living index in zip code 27553: 83.7 (less than average, U.S. average is 100)
Land area: 37.0 sq. mi. Water area: 6.3 sq. mi.
Population density: 45 people per square mile
(very low).
OSM Map
General Map
Google Map
MSN Map
OSM Map
General Map
Google Map
MSN Map
OSM Map
General Map
Google Map
MSN Map
OSM Map
General Map
Google Map
MSN Map
Please wait while loading the map...
Real estate property taxes paid for housing units in 2022:
This zip code:
0.8% ($1,815)
North Carolina:
0.6% ($1,769)
Median real estate property taxes paid for housing units with mortgages in 2022: $2,036 (0.9%) Median real estate property taxes paid for housing units with no mortgage in 2022: $1,829 (0.9%)
Business Search- 14 Million verified businesses
Males: 774
(47.0%)
Females: 873
(53.0%)
For population 25 years and over in 27553:
High school or higher: 88.1%
Bachelor's degree or higher: 25.5%
Graduate or professional degree: 6.5%
Unemployed: 14.5%
Mean travel time to work (commute): 34.6 minutes
For population 15 years and over in 27553:
Never married: 37.6%
Now married: 49.2%
Separated: 0.1%
Widowed: 7.8%
Divorced: 5.4%
Zip code 27553 compared to state average:
Median household income below state average.
Unemployed percentage significantly above state average.
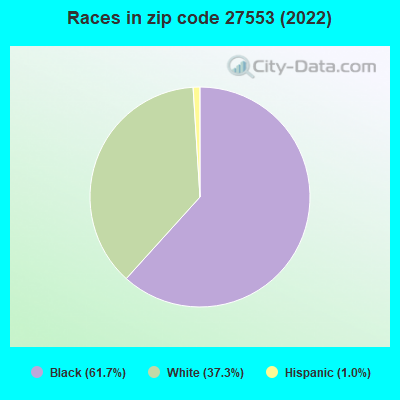
Black race population percentage significantly above state average.
Hispanic race population percentage significantly below state average.
Median age above state average.
Foreign-born population percentage significantly below state average.
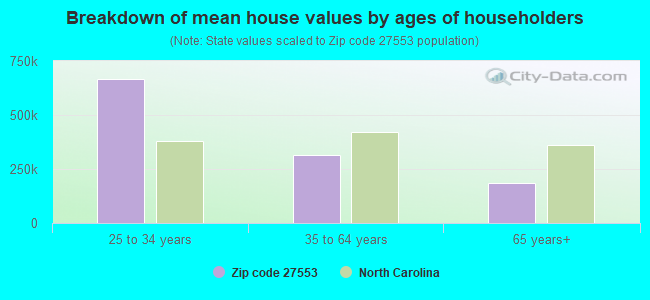
Estimated median house/condo value in 2022: $215,975
27553:
$215,975
North Carolina:
$280,600
According to our research of North Carolina and other state lists, there were 3 registered sex offenders living in 27553 zip code as of May 25, 2024. The ratio of all residents to sex offenders in zip code 27553 is 802 to 1. The ratio of registered sex offenders to all residents in this zip code is lower than the state average.
Median resident age:
This zip code:
44.5 years
North Carolina median age:
39.2 years
Average household size:
This zip code:
2.7 people
North Carolina:
2.4 people
Averages for the 2020 tax year for zip code 27553, filed in 2021:
Average Adjusted Gross Income (AGI) in 2020: $43,859 (Individual Income Tax Returns)
Here:
$43,859
State:
$70,020
Salary/wage: $36,209 (reported on 81.6% of returns)
Here:
$36,209
State:
$58,387
(% of AGI for various income ranges: 1341.1% for AGIs below $25k, 3891.7% for AGIs $25k-50k, 6690.0% for AGIs $50k-75k, 9104.0% for AGIs $75k-100k, 15390.0% for AGIs $100k-200k)
Taxable interest for individuals: $473 (reported on 22.4% of returns)
This zip code:
$473
North Carolina:
$1,479
(% of AGI for various income ranges: 3.6% for AGIs below $25k, 10.0% for AGIs $25k-50k, 16.7% for AGIs $50k-75k, 42.0% for AGIs $75k-100k, 80.0% for AGIs $100k-200k)
Ordinary dividends: $2,689 (reported on 9.2% of returns)
Here:
$2,689
State:
$7,888
(% of AGI for various income ranges: 23.2% for AGIs below $25k, 150.0% for AGIs $50k-75k, 174.0% for AGIs $100k-200k)
Net capital gain/loss in AGI: +$4,867 (reported on 9.2% of returns)
Here:
+$4,867
State:
+$23,652
(% of AGI for various income ranges: 5.4% for AGIs below $25k, 175.0% for AGIs $50k-75k, 636.0% for AGIs $100k-200k)
Profit/loss from business: +$3,046 (reported on 13.3% of returns)
Here:
+$3,046
State:
+$11,710
(% of AGI for various income ranges: 48.9% for AGIs below $25k, 51.3% for AGIs $25k-50k, 382.0% for AGIs $100k-200k)
Taxable individual retirement arrangement distribution: $21,183 (reported on 6.1% of returns)
27553:
$21,183
North Carolina:
$20,247
(% of AGI for various income ranges: 68.6% for AGIs below $25k, 625.0% for AGIs $50k-75k, 1408.0% for AGIs $100k-200k)
Total itemized deductions: $25,486 (reported on 7.1% of returns)
Here:
$25,486
State:
$34,549
(% of AGI for various income ranges: 171.4% for AGIs below $25k, 1046.7% for AGIs $50k-75k, 1352.0% for AGIs $100k-200k)
Charity contributions: $5,980 (reported on 5.1% of returns)
Here:
$5,980
State:
$13,360
(% of AGI for various income ranges: 61.3% for AGIs $25k-50k, 316.0% for AGIs $75k-100k)
Taxes paid: $5,114 (reported on 7.1% of returns)
27553:
$5,114
State:
$7,586
(% of AGI for various income ranges: 27.1% for AGIs below $25k, 173.3% for AGIs $50k-75k, 356.0% for AGIs $100k-200k)
Earned income credit: $2,300 (reported on 26.5% of returns)
Here:
$2,300
State:
$2,337
(% of AGI for various income ranges: 142.9% for AGIs below $25k, 86.1% for AGIs $25k-50k)
Percentage of individuals using paid preparers for their 2020 taxes: 81.6%
Here:
82%
State:
93%
(% for various income ranges: 79.5% for AGIs below $25k, 80.6% for AGIs $25k-50k, 81.8% for AGIs $50k-75k, 87.5% for AGIs $75k-100k, 88.9% for AGIs $100k-200k)
Averages for the 2012 tax year for zip code 27553, filed in 2013:
Average Adjusted Gross Income (AGI) in 2012: $35,522 (Individual Income Tax Returns)
Here:
$35,522
State:
$54,937
Salary/wage: $30,624 (reported on 84.8% of returns)
Here:
$30,624
State:
$46,336
(% of AGI for various income ranges: 83.2% for AGIs below $25k, 81.3% for AGIs $25k-50k, 70.6% for AGIs $50k-75k, 75.0% for AGIs $75k-100k, 52.0% for AGIs $100k-200k)
Taxable interest for individuals: $605 (reported on 20.7% of returns)
This zip code:
$605
North Carolina:
$1,298
(% of AGI for various income ranges: 0.3% for AGIs below $25k, 0.2% for AGIs $25k-50k, 0.5% for AGIs $50k-75k, 0.7% for AGIs $75k-100k, 0.2% for AGIs $100k-200k)
Ordinary dividends: $2,775 (reported on 8.7% of returns)
Here:
$2,775
State:
$6,213
Net capital gain/loss in AGI: +$2,833 (reported on 6.5% of returns)
Here:
+$2,833
State:
+$12,740
Profit/loss from business: +$769 (reported on 14.1% of returns)
Here:
+$769
State:
+$10,311
(% of AGI for various income ranges: 0.7% for AGIs $25k-50k, 1.3% for AGIs $50k-75k)
Taxable individual retirement arrangement distribution: $13,683 (reported on 6.5% of returns)
27553:
$13,683
North Carolina:
$15,575
Total itemized deductions: $20,740 (32% of AGI, reported on 27.2% of returns)
Here:
$20,740
State:
$23,438
Here:
31.7% of AGI
State:
21.5% of AGI
(% of AGI for various income ranges: 6.5% for AGIs below $25k, 18.2% for AGIs $25k-50k, 16.1% for AGIs $50k-75k, 19.4% for AGIs $75k-100k, 18.5% for AGIs $100k-200k)
Charity contributions: $4,213 (reported on 25.0% of returns)
Here:
$4,213
State:
$4,687
(% of AGI for various income ranges: 1.2% for AGIs below $25k, 3.0% for AGIs $25k-50k, 3.0% for AGIs $50k-75k, 4.4% for AGIs $75k-100k, 3.6% for AGIs $100k-200k)
Taxes paid: $5,120 (reported on 27.2% of returns)
27553:
$5,120
State:
$8,823
(% of AGI for various income ranges: 1.0% for AGIs below $25k, 2.8% for AGIs $25k-50k, 4.2% for AGIs $50k-75k, 5.6% for AGIs $75k-100k, 6.7% for AGIs $100k-200k)
Earned income credit: $2,350 (reported on 37.0% of returns)
Here:
$2,350
State:
$2,376
(% of AGI for various income ranges: 10.3% for AGIs below $25k, 1.8% for AGIs $25k-50k)
Percentage of individuals using paid preparers for their 2012 taxes: 38.0%
Here:
38%
State:
53%
(% for various income ranges: 35.6% for AGIs below $25k, 33.3% for AGIs $25k-50k, 40.0% for AGIs $50k-75k, 50.0% for AGIs $75k-100k, 75.0% for AGIs $100k-200k)
Averages for the 2004 tax year for zip code 27553, filed in 2005:
Average Adjusted Gross Income (AGI) in 2004: $27,886 (Individual Income Tax Returns)
Here:
$27,886
State:
$45,376
Salary/wage: $24,210 (reported on 89.4% of returns)
Here:
$24,210
State:
$39,442
(% of AGI for various income ranges: 89.5% for AGIs below $10k, 87.6% for AGIs $10k-25k, 83.8% for AGIs $25k-50k, 73.6% for AGIs $50k-75k, 67.4% for AGIs $75k-100k, 52.6% for AGIs over 100k)
Taxable interest for individuals: $870 (reported on 25.8% of returns)
This zip code:
$870
North Carolina:
$1,515
(% of AGI for various income ranges: 2.5% for AGIs below $10k, 0.5% for AGIs $10k-25k, 0.7% for AGIs $25k-50k, 1.1% for AGIs $50k-75k, 1.3% for AGIs $75k-100k, 0.3% for AGIs over 100k)
Taxable dividends: $1,342 (reported on 8.0% of returns)
Here:
$1,342
State:
$4,016
(% of AGI for various income ranges: 0.0% for AGIs $10k-25k, 0.6% for AGIs $25k-50k, 0.2% for AGIs $50k-75k, 0.2% for AGIs $75k-100k, 1.3% for AGIs over 100k)
Net capital gain/loss: +$4,855 (reported on 5.8% of returns)
Here:
+$4,855
State:
+$11,152
(% of AGI for various income ranges: -0.2% for AGIs below $10k, 0.0% for AGIs $25k-50k, -0.2% for AGIs $50k-75k, 8.6% for AGIs $75k-100k)
Profit/loss from business: +$2,457 (reported on 9.9% of returns)
Here:
+$2,457
State:
+$9,490
(% of AGI for various income ranges: 8.7% for AGIs below $10k, 1.7% for AGIs $10k-25k, -1.5% for AGIs $25k-50k, 4.2% for AGIs $75k-100k)
Total itemized deductions: $16,234 (31% of AGI, reported on 24.2% of returns)
Here:
$16,234
State:
$19,464
Here:
30.6% of AGI
State:
22.7% of AGI
(% of AGI for various income ranges: 9.3% for AGIs $10k-25k, 15.7% for AGIs $25k-50k, 17.8% for AGIs $50k-75k, 19.0% for AGIs $75k-100k, 14.6% for AGIs over 100k)
Charity contributions deductions: $3,552 (7% of AGI, reported on 22.0% of returns)
Here:
$3,552
State:
$4,035
Here:
6.5% of AGI
State:
4.5% of AGI
(% of AGI for various income ranges: 1.6% for AGIs $10k-25k, 3.0% for AGIs $25k-50k, 3.9% for AGIs $50k-75k, 4.6% for AGIs $75k-100k, 2.3% for AGIs over 100k)
Total tax: $3,314 (reported on 56.8% of returns)
27553:
$3,314
State:
$7,257
(% of AGI for various income ranges: 2.5% for AGIs below $10k, 2.2% for AGIs $10k-25k, 5.0% for AGIs $25k-50k, 8.4% for AGIs $50k-75k, 11.0% for AGIs $75k-100k, 15.7% for AGIs over 100k)
Earned income credit: $2,091 (reported on 39.3% of returns)
Here:
$2,091
State:
$1,851
Percentage of individuals using paid preparers for their 2004 taxes: 49.0%
Here:
49%
State:
62%
(% for various income ranges: 46.0% for AGIs below $10k, 52.5% for AGIs $10k-25k, 41.1% for AGIs $25k-50k, 53.8% for AGIs $50k-75k, 55.3% for AGIs $75k-100k, 60.0% for AGIs over 100k)
Household received Food Stamps/SNAP in the past 12 months: 263 Household did not receive Food Stamps/SNAP in the past 12 months: 351
Women who had a birth in the past 12 months: 74 (21 now married, 51 unmarried) Women who did not have a birth in the past 12 months: 335 (103 now married, 231 unmarried)
Housing units in zip code 27553 with a mortgage: 226 (12 second mortgage, 9 home equity loan) Median monthly owner costs for units with a mortgage: $1,500 Median monthly owner costs for units without a mortgage: $510
Residents with income below the poverty level in 2022:
This zip code:
21.5%
Whole state:
12.8%
Residents with income below 50% of the poverty level in 2022:
This zip code:
4.7%
Whole state:
6.8%
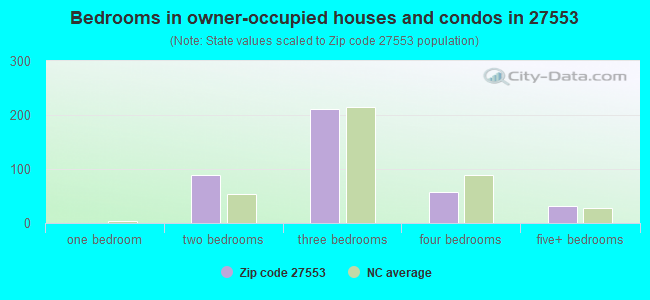
Median number of rooms in houses and condos:
Here:
6.1
State:
6.4
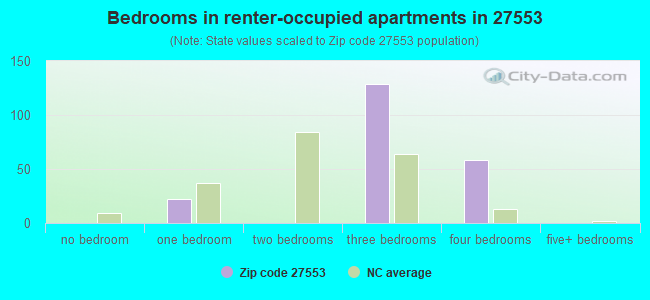
Median number of rooms in apartments:
Here:
5.3
State:
4.4
Notable locations in this zip code not listed on our city pages
Churches in zip code 27553 include: Bethlehem Church (A), Burchett Chapel (B), Mount Auburn Church (C), Mount Pleasant Churh (D), Oak Level Church (E), Young Memorial Church (F), Russell Union Church (G), Saints Delight Church (H). Display/hide their locations on the map
Streams, rivers, and creeks: Ellington Branch (A), Dix Branch (B), Cabin Branch (C), Anderson Creek (D), Mill Creek (E). Display/hide their locations on the map
Parks in zip code 27553 include: Kimball Point Public Use Area (1), County Line Public Use Area (2), Bullocks Park (3). Display/hide their locations on the map
In group quarters: 11 (-1 institutionalized population)
Size of family households: 142 2-persons, 85 3-persons, 72 4-persons, 53 6-persons, 20 7-or-more-persons
Size of nonfamily households: 223 1-person
90 married couples with children.
170 single-parent households (170 women).
97.6% of residents of 27553 zip code speak English at home.
2.2% of residents speak Spanish at home (64% well, 36% not well).
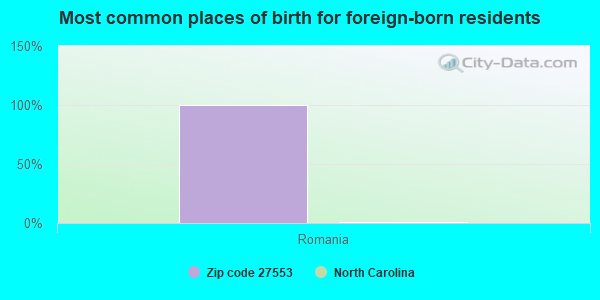
Foreign born population: 2 (0.1%) (100.0% of them are naturalized citizens)
This zip code:
0.1%
Whole state:
8.6%
100%Romania
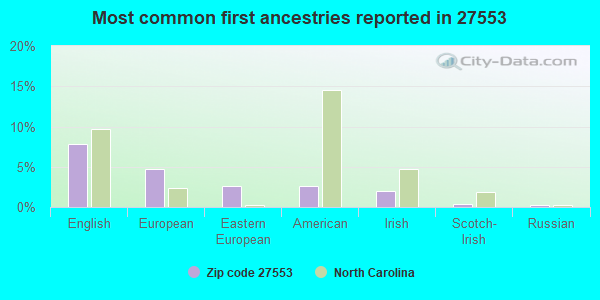
8%English
5%European
3%Eastern European
3%American
2%Irish
0%Scotch-Irish
0%Russian
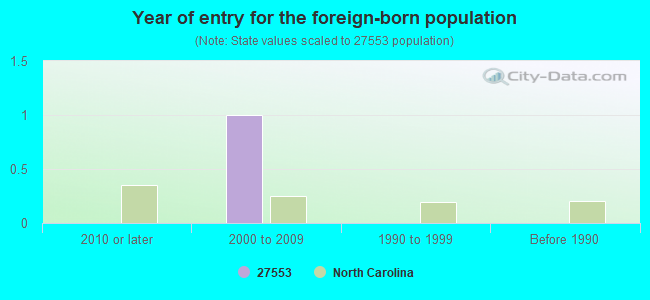
Year of entry for the foreign-born population
02010 or later
12000 to 2009
01990 to 1999
0Before 1990
Housing units lacking complete plumbing facilities: 7.8% Housing units lacking complete kitchen facilities: 4.7%
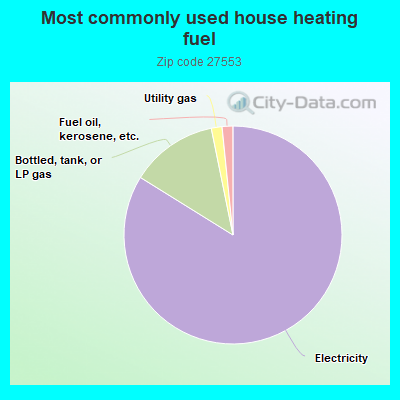
84.1%Electricity
13.0%Bottled, tank, or LP gas
1.6%Utility gas
1.6%Fuel oil, kerosene, etc.
Population in 1990: 1,976.
Place of birth for U.S.-born residents:
This state: 1,121
Northeast: 133
Midwest: 72
South: 303
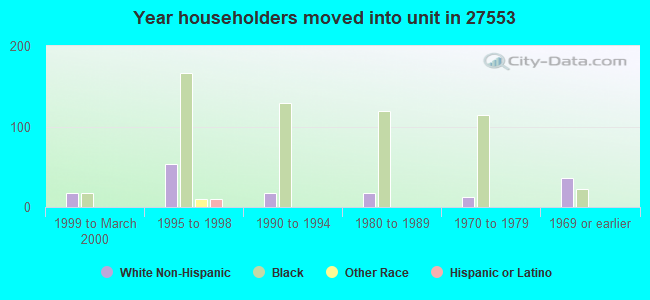
74% of the 27553 zip code residents lived in the same house 5 years ago. Out of people who lived in different houses, 51% lived in this county. Out of people who lived in different counties, 50% lived in North Carolina.
95% of the 27553 zip code residents lived in the same house 1 year ago. Out of people who lived in different houses, 79% moved from different county within same state. Out of people who lived in different houses, 39% moved from different state.
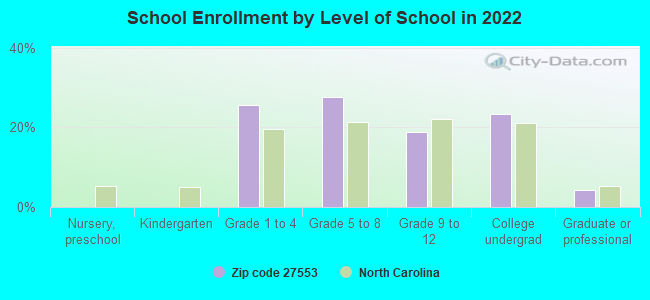
Private vs. public school enrollment:
Students in private schools in grades 1 to 8 (elementary and middle school):
Here:
0.0%
North Carolina:
13.8%
Students in private schools in grades 9 to 12 (high school):
Here:
0.0%
North Carolina:
11.9%
Students in private undergraduate colleges: 61
Here:
76.2%
North Carolina:
19.3%
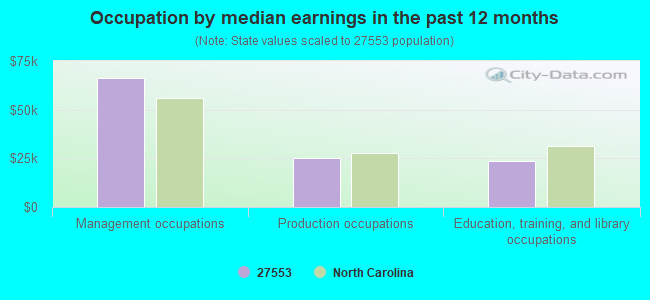
Occupation by median earnings in the past 12 months ($)
66,495Management occupations
24,999Production occupations
23,532Education, training, and library occupations
Companies with federal contracts located in this zip code:
TEREASIA B WHITE (308 MANSON DREWRY RD in MANSON, NC; small business) : $54,125 in 11 contractsfrom 2004 to 2006
Contracts for Guard Services by U.S. Army Corps of Engineers - civil program financing only, Army Signed by year:2000: $0; 2001: $0; 2002: $0; 2003: $0; 2004: $27,560; 2005: $17,710; 2006: $8,855.
Biggest contracts:
$13,780 with U.S. Army Corps of Engineers - civil program financing only for Guard Services. Signed on 2004-04-06. Completion date: 2004-04-05.
$13,780 with Army for Guard Services. Signed on 2004-04-06. Completion date: 2004-04-05.
$10,850, same as above.Signed on 2004-02-18. Completion date: 2004-04-30.
$10,850 with U.S. Army Corps of Engineers - civil program financing only for Guard Services. Signed on 2004-02-18. Completion date: 2004-04-30.
Top industries in this zip code by the number of employees in 2005:
Information: Data Processing, Hosting, and Related Services (20-49 employees: 1 establishment)
Health Care and Social Assistance: Other Residential Care Facilities (20-49: 1)
Health Care and Social Assistance: All Other Outpatient Care Centers (20-49: 1)
Construction: Masonry Contractors (10-19: 1)
Health Care and Social Assistance: Homes for the Elderly (10-19: 1)
Other Services (except Public Administration): General Automotive Repair (5-9: 1)
Other Services (except Public Administration): Commercial and Industrial Machinery and Equipment (except Automotive and Electronic) Repair and Maintenance (1-4: 1)
People in group quarters in 2010:
917 people in state prisons
3 people in nursing facilities/skilled-nursing facilities
2 people in residential treatment centers for adults
Fatal accident statistics in 2014:
Fatal accident count: 1
Vehicles involved in fatal accidents: 1
Fatal accidents caused by drunken drivers: 0
Fatalities: 1
Persons involved in fatal accidents: 1
Pedestrians involved in fatal accidents: 0
Most common first names in zip code 27553 among deceased individuals
Name
Count
Lived (average)
John
31
75.3 years
James
24
74.0 years
Mary
22
73.5 years
William
13
76.7 years
Willie
12
75.2 years
Annie
12
77.2 years
Robert
11
75.9 years
Joseph
11
72.4 years
Lucy
11
80.8 years
Charlie
9
69.0 years
Most common last names in zip code 27553 among deceased individuals


 Nearest zip codes: 27556, 27563, 23917, 27537, 27536, 23919.


 : $54,125 in 11 contracts from 2004 to 2006