Estimated zip code population in 2022: 6,932 Zip code population in 2010: 6,962 Zip code population in 2000: 6,370
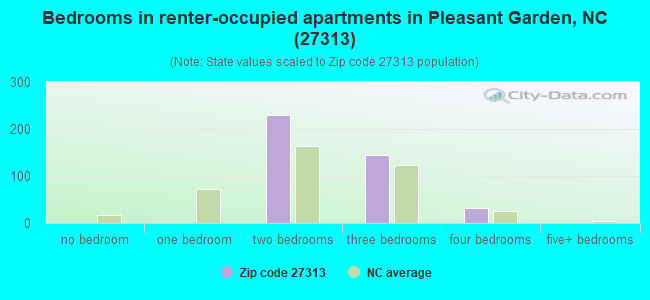
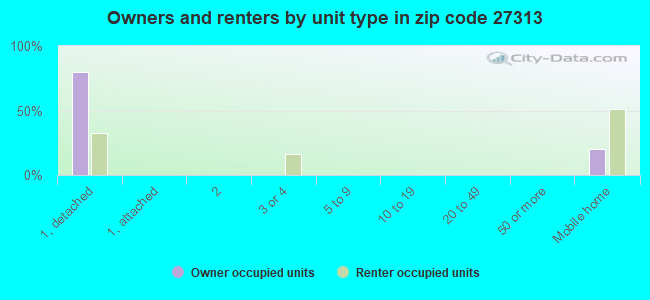
Houses and condos: 3,201 Renter-occupied apartments: 408
% of renters here:
14%
State:
33%
March 2022 cost of living index in zip code 27313: 79.9 (low, U.S. average is 100)
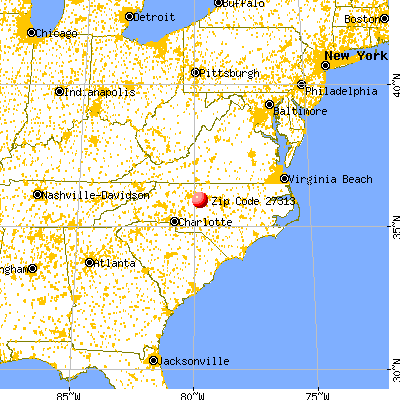
Land area: 28.4 sq. mi. Water area: 0.2 sq. mi.
Population density: 244 people per square mile
(very low).
OSM Map
General Map
Google Map
MSN Map
OSM Map
General Map
Google Map
MSN Map
OSM Map
General Map
Google Map
MSN Map
OSM Map
General Map
Google Map
MSN Map
Please wait while loading the map...
Real estate property taxes paid for housing units in 2022:
This zip code:
0.6% ($1,486)
North Carolina:
0.6% ($1,769)
Median real estate property taxes paid for housing units with mortgages in 2022: $1,578 (0.7%) Median real estate property taxes paid for housing units with no mortgage in 2022: $1,189 (0.6%)
Business Search- 14 Million verified businesses
Males: 3,722
(53.7%)
Females: 3,208
(46.3%)
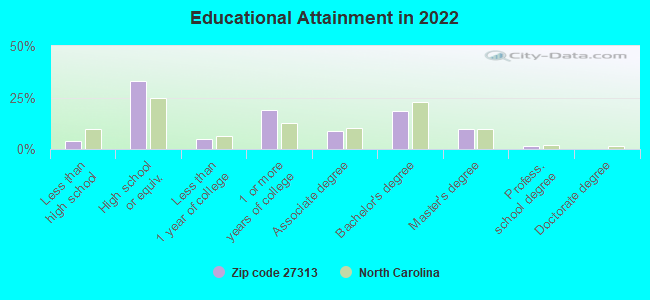
For population 25 years and over in 27313:
High school or higher: 95.1%
Bachelor's degree or higher: 29.7%
Graduate or professional degree: 11.5%
Unemployed: 3.6%
Mean travel time to work (commute): 28.6 minutes
For population 15 years and over in 27313:
Never married: 23.6%
Now married: 62.2%
Separated: 2.3%
Widowed: 4.6%
Divorced: 7.4%
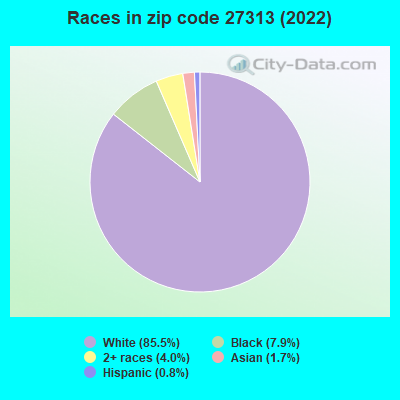
Zip code 27313 compared to state average:
Black race population percentage below state average.
Hispanic race population percentage significantly below state average.
Median age above state average.
Foreign-born population percentage significantly below state average.
Renting percentage significantly below state average.
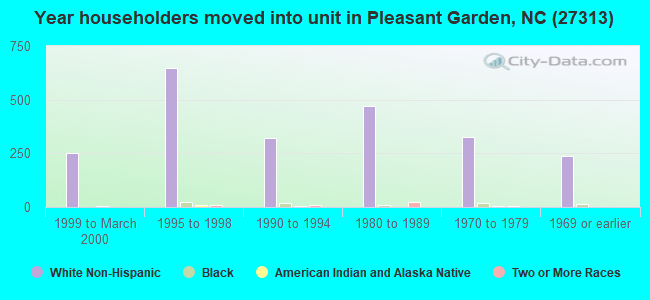
Length of stay since moving in significantly above state average.
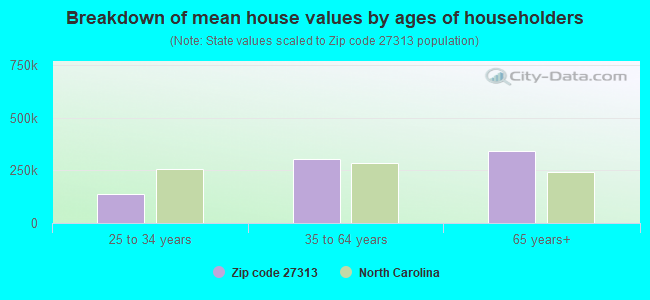
Estimated median house/condo value in 2022: $231,385
27313:
$231,385
North Carolina:
$280,600
According to our research of North Carolina and other state lists, there were 15 registered sex offenders living in 27313 zip code as of May 22, 2024. The ratio of all residents to sex offenders in zip code 27313 is 461 to 1. The ratio of registered sex offenders to all residents in this zip code is near the state average.
Median resident age:
This zip code:
45.8 years
North Carolina median age:
39.2 years
Average household size:
This zip code:
2.4 people
North Carolina:
2.4 people
Averages for the 2020 tax year for zip code 27313, filed in 2021:
Average Adjusted Gross Income (AGI) in 2020: $63,148 (Individual Income Tax Returns)
Here:
$63,148
State:
$70,020
Salary/wage: $53,586 (reported on 79.1% of returns)
Here:
$53,586
State:
$58,387
(% of AGI for various income ranges: 1149.0% for AGIs below $25k, 3657.8% for AGIs $25k-50k, 6491.9% for AGIs $50k-75k, 9571.8% for AGIs $75k-100k, 19126.9% for AGIs $100k-200k, 51396.7% for AGIs over 200k)
Taxable interest for individuals: $994 (reported on 33.7% of returns)
This zip code:
$994
North Carolina:
$1,479
(% of AGI for various income ranges: 16.1% for AGIs below $25k, 23.9% for AGIs $25k-50k, 46.2% for AGIs $50k-75k, 50.5% for AGIs $75k-100k, 101.5% for AGIs $100k-200k, 1006.7% for AGIs over 200k)
Ordinary dividends: $4,175 (reported on 18.7% of returns)
Here:
$4,175
State:
$7,888
(% of AGI for various income ranges: 29.4% for AGIs below $25k, 50.6% for AGIs $25k-50k, 74.1% for AGIs $50k-75k, 140.5% for AGIs $75k-100k, 336.9% for AGIs $100k-200k, 2010.0% for AGIs over 200k)
Net capital gain/loss in AGI: +$12,652 (reported on 17.2% of returns)
Here:
+$12,652
State:
+$23,652
(% of AGI for various income ranges: 21.1% for AGIs below $25k, 29.3% for AGIs $25k-50k, 79.7% for AGIs $50k-75k, 169.1% for AGIs $75k-100k, 758.1% for AGIs $100k-200k, 13790.0% for AGIs over 200k)
Profit/loss from business: +$10,519 (reported on 17.8% of returns)
Here:
+$10,519
State:
+$11,710
(% of AGI for various income ranges: 133.3% for AGIs below $25k, 200.6% for AGIs $25k-50k, 305.4% for AGIs $50k-75k, 129.1% for AGIs $75k-100k, 222.7% for AGIs $100k-200k, 6883.3% for AGIs over 200k)
Taxable individual retirement arrangement distribution: $17,041 (reported on 12.6% of returns)
27313:
$17,041
North Carolina:
$20,247
(% of AGI for various income ranges: 94.3% for AGIs below $25k, 173.7% for AGIs $25k-50k, 320.5% for AGIs $50k-75k, 452.7% for AGIs $75k-100k, 735.8% for AGIs $100k-200k, 4250.0% for AGIs over 200k)
Total itemized deductions: $31,861 (reported on 7.1% of returns)
Here:
$31,861
State:
$34,549
(% of AGI for various income ranges: 186.7% for AGIs $25k-50k, 318.6% for AGIs $50k-75k, 417.7% for AGIs $75k-100k, 1013.8% for AGIs $100k-200k, 5286.7% for AGIs over 200k)
Charity contributions: $12,774 (reported on 5.8% of returns)
Here:
$12,774
State:
$13,360
(% of AGI for various income ranges: 26.0% for AGIs below $25k, 51.6% for AGIs $50k-75k, 118.6% for AGIs $75k-100k, 383.1% for AGIs $100k-200k, 2640.0% for AGIs over 200k)
Taxes paid: $6,422 (reported on 7.1% of returns)
27313:
$6,422
State:
$7,586
(% of AGI for various income ranges: 16.3% for AGIs $25k-50k, 48.1% for AGIs $50k-75k, 77.7% for AGIs $75k-100k, 260.4% for AGIs $100k-200k, 1210.0% for AGIs over 200k)
Earned income credit: $2,018 (reported on 13.8% of returns)
Here:
$2,018
State:
$2,337
(% of AGI for various income ranges: 85.0% for AGIs below $25k, 54.8% for AGIs $25k-50k)
Percentage of individuals using paid preparers for their 2020 taxes: 92.0%
Here:
92%
State:
93%
(% for various income ranges: 91.3% for AGIs below $25k, 91.9% for AGIs $25k-50k, 90.9% for AGIs $50k-75k, 91.2% for AGIs $75k-100k, 94.0% for AGIs $100k-200k, 100.0% for AGIs over 200k)
Averages for the 2012 tax year for zip code 27313, filed in 2013:
Average Adjusted Gross Income (AGI) in 2012: $55,216 (Individual Income Tax Returns)
Here:
$55,216
State:
$54,937
Salary/wage: $45,926 (reported on 82.6% of returns)
Here:
$45,926
State:
$46,336
(% of AGI for various income ranges: 68.0% for AGIs below $25k, 73.8% for AGIs $25k-50k, 75.6% for AGIs $50k-75k, 73.0% for AGIs $75k-100k, 76.0% for AGIs $100k-200k, 35.6% for AGIs over 200k)
Taxable interest for individuals: $946 (reported on 38.6% of returns)
This zip code:
$946
North Carolina:
$1,298
(% of AGI for various income ranges: 1.4% for AGIs below $25k, 0.6% for AGIs $25k-50k, 0.6% for AGIs $50k-75k, 0.6% for AGIs $75k-100k, 0.6% for AGIs $100k-200k, 0.8% for AGIs over 200k)
Ordinary dividends: $2,929 (reported on 20.9% of returns)
Here:
$2,929
State:
$6,213
(% of AGI for various income ranges: 1.9% for AGIs below $25k, 0.8% for AGIs $25k-50k, 0.9% for AGIs $50k-75k, 1.1% for AGIs $75k-100k, 1.0% for AGIs $100k-200k, 1.4% for AGIs over 200k)
Net capital gain/loss in AGI: +$5,251 (reported on 15.5% of returns)
Here:
+$5,251
State:
+$12,740
(% of AGI for various income ranges: 0.3% for AGIs below $25k, 0.1% for AGIs $25k-50k, 0.6% for AGIs $50k-75k, 1.0% for AGIs $75k-100k, 1.0% for AGIs $100k-200k, 6.2% for AGIs over 200k)
Profit/loss from business: +$8,111 (reported on 17.4% of returns)
Here:
+$8,111
State:
+$10,311
(% of AGI for various income ranges: 8.5% for AGIs below $25k, 3.0% for AGIs $25k-50k, 1.9% for AGIs $50k-75k, 2.5% for AGIs $75k-100k, 2.4% for AGIs $100k-200k)
Taxable individual retirement arrangement distribution: $13,593 (reported on 14.2% of returns)
27313:
$13,593
North Carolina:
$15,575
(% of AGI for various income ranges: 5.1% for AGIs below $25k, 4.3% for AGIs $25k-50k, 3.5% for AGIs $50k-75k, 4.1% for AGIs $75k-100k, 4.1% for AGIs $100k-200k)
Total itemized deductions: $19,820 (22% of AGI, reported on 40.2% of returns)
Here:
$19,820
State:
$23,438
Here:
21.9% of AGI
State:
21.5% of AGI
(% of AGI for various income ranges: 13.4% for AGIs below $25k, 12.5% for AGIs $25k-50k, 15.1% for AGIs $50k-75k, 16.7% for AGIs $75k-100k, 15.8% for AGIs $100k-200k, 10.5% for AGIs over 200k)
Charity contributions: $3,973 (reported on 33.5% of returns)
Here:
$3,973
State:
$4,687
(% of AGI for various income ranges: 1.4% for AGIs below $25k, 1.7% for AGIs $25k-50k, 2.3% for AGIs $50k-75k, 2.9% for AGIs $75k-100k, 3.0% for AGIs $100k-200k, 2.2% for AGIs over 200k)
Taxes paid: $6,791 (reported on 39.6% of returns)
27313:
$6,791
State:
$8,823
(% of AGI for various income ranges: 2.0% for AGIs below $25k, 2.8% for AGIs $25k-50k, 4.2% for AGIs $50k-75k, 5.5% for AGIs $75k-100k, 6.5% for AGIs $100k-200k, 5.7% for AGIs over 200k)
Earned income credit: $2,078 (reported on 15.8% of returns)
Here:
$2,078
State:
$2,376
(% of AGI for various income ranges: 5.3% for AGIs below $25k, 1.2% for AGIs $25k-50k)
Percentage of individuals using paid preparers for their 2012 taxes: 54.4%
Here:
54%
State:
53%
(% for various income ranges: 53.5% for AGIs below $25k, 51.4% for AGIs $25k-50k, 55.6% for AGIs $50k-75k, 55.3% for AGIs $75k-100k, 57.1% for AGIs $100k-200k, 80.0% for AGIs over 200k)
Averages for the 2004 tax year for zip code 27313, filed in 2005:
Average Adjusted Gross Income (AGI) in 2004: $47,994 (Individual Income Tax Returns)
Here:
$47,994
State:
$45,376
Salary/wage: $43,803 (reported on 84.1% of returns)
Here:
$43,803
State:
$39,442
(% of AGI for various income ranges: 118.3% for AGIs below $10k, 70.5% for AGIs $10k-25k, 79.2% for AGIs $25k-50k, 80.6% for AGIs $50k-75k, 85.1% for AGIs $75k-100k, 66.7% for AGIs over 100k)
Taxable interest for individuals: $1,179 (reported on 48.2% of returns)
This zip code:
$1,179
North Carolina:
$1,515
(% of AGI for various income ranges: 6.0% for AGIs below $10k, 2.7% for AGIs $10k-25k, 1.0% for AGIs $25k-50k, 0.9% for AGIs $50k-75k, 0.9% for AGIs $75k-100k, 1.2% for AGIs over 100k)
Taxable dividends: $1,992 (reported on 24.5% of returns)
Here:
$1,992
State:
$4,016
(% of AGI for various income ranges: 3.4% for AGIs below $10k, 1.8% for AGIs $10k-25k, 0.9% for AGIs $25k-50k, 0.6% for AGIs $50k-75k, 0.5% for AGIs $75k-100k, 1.5% for AGIs over 100k)
Net capital gain/loss: +$4,205 (reported on 18.1% of returns)
Here:
+$4,205
State:
+$11,152
(% of AGI for various income ranges: -2.9% for AGIs below $10k, 0.6% for AGIs $10k-25k, 0.9% for AGIs $25k-50k, 0.9% for AGIs $50k-75k, 0.7% for AGIs $75k-100k, 3.6% for AGIs over 100k)
Profit/loss from business: +$8,296 (reported on 17.9% of returns)
Here:
+$8,296
State:
+$9,490
(% of AGI for various income ranges: 17.7% for AGIs below $10k, 8.2% for AGIs $10k-25k, 3.9% for AGIs $25k-50k, 2.9% for AGIs $50k-75k, 1.2% for AGIs $75k-100k, 2.2% for AGIs over 100k)
IRA payment deduction: $3,133 (reported on 2.6% of returns)
27313:
$3,133
North Carolina:
$2,967
(% of AGI for various income ranges: 0.4% for AGIs $10k-25k, 0.2% for AGIs $25k-50k, 0.1% for AGIs $50k-75k, 0.2% for AGIs $75k-100k, 0.1% for AGIs over 100k)
Total itemized deductions: $17,866 (23% of AGI, reported on 43.9% of returns)
Here:
$17,866
State:
$19,464
Here:
23.4% of AGI
State:
22.7% of AGI
(% of AGI for various income ranges: 16.8% for AGIs below $10k, 12.4% for AGIs $10k-25k, 16.1% for AGIs $25k-50k, 17.1% for AGIs $50k-75k, 18.7% for AGIs $75k-100k, 15.3% for AGIs over 100k)
Charity contributions deductions: $3,843 (5% of AGI, reported on 38.6% of returns)
Here:
$3,843
State:
$4,035
Here:
4.9% of AGI
State:
4.5% of AGI
(% of AGI for various income ranges: 1.2% for AGIs below $10k, 2.2% for AGIs $10k-25k, 2.6% for AGIs $25k-50k, 2.9% for AGIs $50k-75k, 3.8% for AGIs $75k-100k, 3.4% for AGIs over 100k)
Total tax: $6,373 (reported on 79.2% of returns)
27313:
$6,373
State:
$7,257
(% of AGI for various income ranges: 4.8% for AGIs below $10k, 4.1% for AGIs $10k-25k, 6.5% for AGIs $25k-50k, 8.2% for AGIs $50k-75k, 9.5% for AGIs $75k-100k, 17.4% for AGIs over 100k)
Earned income credit: $1,609 (reported on 12.7% of returns)
Here:
$1,609
State:
$1,851
Percentage of individuals using paid preparers for their 2004 taxes: 59.7%
Here:
60%
State:
62%
(% for various income ranges: 51.1% for AGIs below $10k, 60.8% for AGIs $10k-25k, 63.5% for AGIs $25k-50k, 60.8% for AGIs $50k-75k, 58.8% for AGIs $75k-100k, 62.4% for AGIs over 100k)
Likely homosexual households (counted as self-reported same-sex unmarried-partner households)
Lesbian couples: 0.0% of all households
Gay men: 0.6% of all households
Household received Food Stamps/SNAP in the past 12 months: 162 Household did not receive Food Stamps/SNAP in the past 12 months: 2,629
Women who had a birth in the past 12 months: 48 (50 now married, 0 unmarried) Women who did not have a birth in the past 12 months: 1,393 (728 now married, 667 unmarried)
Housing units in zip code 27313 with a mortgage: 1,692 (285 second mortgage, 283 both second mortgage and home equity loan) Houses without a mortgage: 96
Median monthly owner costs for units with a mortgage: $1,195 Median monthly owner costs for units without a mortgage: $366
Residents with income below the poverty level in 2022:
This zip code:
7.4%
Whole state:
12.8%
Residents with income below 50% of the poverty level in 2022:
This zip code:
3.9%
Whole state:
6.8%
Median number of rooms in houses and condos:
Here:
6.6
State:
6.4
Median number of rooms in apartments:
Here:
4.6
State:
4.4
Notable locations in this zip code not listed on our city pages
In group quarters: 124 (-1 institutionalized population)
Size of family households: 990 2-persons, 286 3-persons, 537 4-persons, 146 5-persons, 18 6-persons
Size of nonfamily households: 706 1-person, 116 2-persons
1,049 married couples with children.
237 single-parent households (89 men, 148 women).
96.7% of residents of 27313 zip code speak English at home.
0.9% of residents speak Spanish at home (95% very well, 2% not well, 3% not at all).
1.2% of residents speak other Indo-European language at home (99% very well, 1% not well).
0.7% of residents speak Asian or Pacific Island language at home (24% well, 76% not well).
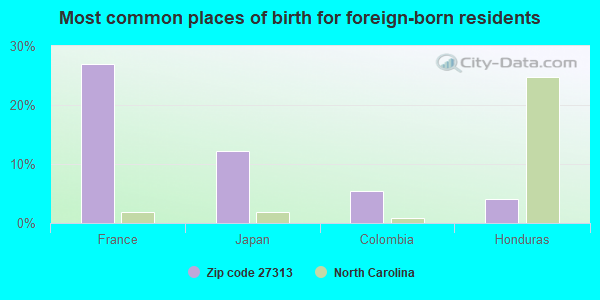
Foreign born population: 77 (1.1%) (81.4% of them are naturalized citizens)
This zip code:
1.1%
Whole state:
8.6%
27%France
12%Japan
5%Colombia
4%Honduras
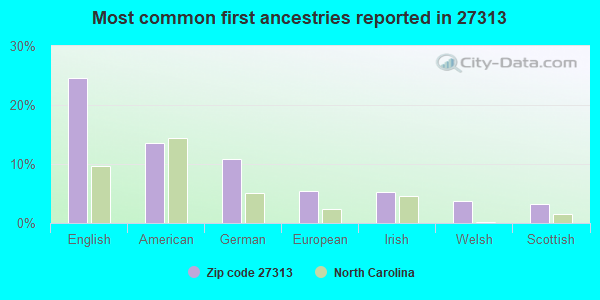
25%English
13%American
11%German
5%European
5%Irish
4%Welsh
3%Scottish
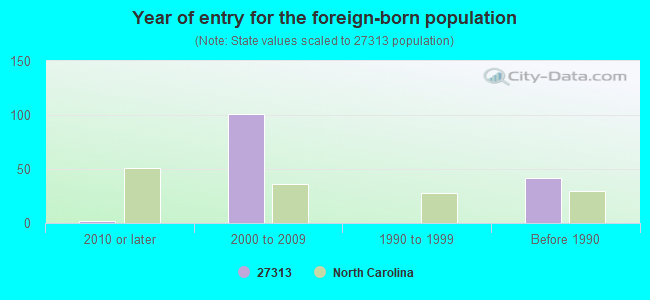
Year of entry for the foreign-born population
22010 or later
1012000 to 2009
01990 to 1999
42Before 1990
Facilities with environmental interests located in this zip code:
BOREN CLAY PRODUCTS - OLD PITS 1 AND 2 (STATE ROAD 2139 in GULF, NC)
AIR MINOR (AIRS/AFS) STATE MASTER (North Carolina facility info) - AIR PROGRAM, -2JF3E2F400MERWA4DVJYG15GRA, WASTEWATER FACILITY CRITERIA AND HAZARDOUS AIR POLLUTANT INVENTORY (Inventory of air pollution sources) Business SIC classification: CLAY, CERAMIC, AND REFRACTORY MINERALS; NONCLASSIFIABLE ESTABLISHMENTS Business NAICS classification: CLAY AND CERAMIC AND REFRACTORY MINERALS MINING. Alternative names: BOREN CLAY PRODUCTS - OLD PITS 1 & 2**IN
B.V. HEDRICK-GRAVEL & SAND (HWY 70 in PLEASANT GARDEN, NC)
STATE MASTER (North Carolina facility info) - -115DA4YG00M29W84AY3W0AU98E, WASTEWATER FACILITY National Pollutant Discharge Elimination System NON-MAJOR (Tracking pollutant discharge elimination systems) - permit Business SIC classification: CONSTRUCTION SAND AND GRAVEL Alternative names: B V HEDRICK
BOREN BRICK-PG #3 PLT. & MINE (6245 HUNT ROAD in PLEASANT GARDEN, NC)
STATE MASTER (North Carolina facility info) - UNDERGROUND STORAGE TANK PROGRAM, -115DA4YG00M69W84AY3V81E8SF, WASTEWATER FACILITY National Pollutant Discharge Elimination System NON-MAJOR (Tracking pollutant discharge elimination systems) - permit Business SIC classification: BRICK AND STRUCTURAL CLAY TILE; NONCLASSIFIABLE ESTABLISHMENTS Alternative names: HANSON BRICK E LLC HANSON BRIC
Housing units lacking complete plumbing facilities: 1.9% Housing units lacking complete kitchen facilities: 3.1%
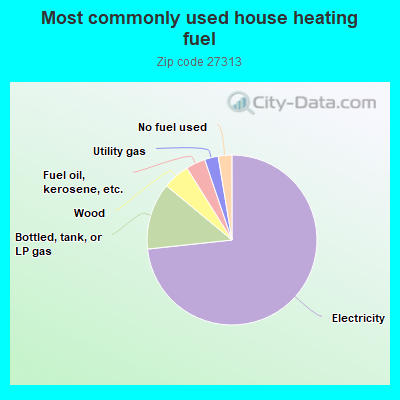
73.3%Electricity
12.7%Bottled, tank, or LP gas
5.1%Wood
3.7%Fuel oil, kerosene, etc.
2.6%Utility gas
2.6%No fuel used
Population in 1990: 4,064. Population change in the 1990s: +2,306 (+56.7%).
Place of birth for U.S.-born residents:
This state: 4,787
Northeast: 691
Midwest: 319
South: 797
West: 121
66% of the 27313 zip code residents lived in the same house 5 years ago. Out of people who lived in different houses, 50% lived in this county. Out of people who lived in different counties, 50% lived in North Carolina.
96% of the 27313 zip code residents lived in the same house 1 year ago. Out of people who lived in different houses, 47% moved from this county. Out of people who lived in different houses, 50% moved from different county within same state. Out of people who lived in different houses, 9% moved from different state. Out of people who lived in different houses, 5% moved from abroad.
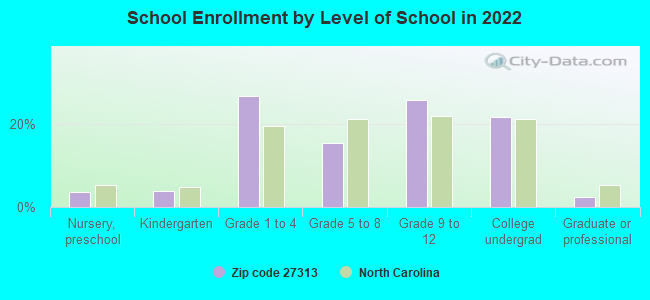
Private vs. public school enrollment:
Students in private schools in grades 1 to 8 (elementary and middle school): 133
Here:
20.2%
North Carolina:
13.8%
Students in private schools in grades 9 to 12 (high school): 87
Here:
21.8%
North Carolina:
11.9%
Students in private undergraduate colleges:
Here:
0.0%
North Carolina:
19.3%
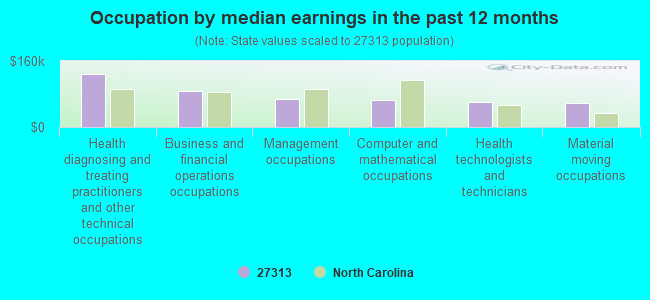
Occupation by median earnings in the past 12 months ($)
128,120Health diagnosing and treating practitioners and other technical occupations
87,946Business and financial operations occupations
67,190Management occupations
66,649Computer and mathematical occupations
61,378Health technologists and technicians
57,109Material moving occupations
Companies with federal contracts located in this zip code:
HILL EQUIPMENT, INC (6807 RUSTICWOOD CT in PLEASANT GARDE, NC; small business) : $82,000 in 4 contractsfrom 2003 to 2005
$30,000 with Navy for Maintenance, Repair and Rebuilding of Equipment -- Special Industry Machinery. Signed on 2005-12-05. Completion date: 2005-09-30.
$27,800, same as above.Signed on 2004-11-05. Completion date: 2005-09-30.
$19,200 with Navy for Fueling and Other Petroleum Services - Excluding Storage. Signed on 2003-07-28. Completion date: 2004-09-30.
$5,000, same as above.Signed on 2003-08-06. Completion date: 2004-09-30.
STAR AIR SYSTEMS (6122 HUNT ROAD in PLEASANT GARDE, NC; small business) : $19,517 in 2 contractsfrom 2003 to 2005
$14,253 with Army for Commercial and Industrial Gas Cylinders. Signed on 2003-11-14. Completion date: 2003-11-30.
$5,264 with Army for Safety and Rescue Equipment. Signed on 2005-12-06. Completion date: 2006-11-30.
Top industries in this zip code by the number of employees in 2005:
Health Care and Social Assistance: Nursing Care Facilities (100-249 employees: 1 establishment)
Management of Companies and Enterprises: Corporate, Subsidiary, and Regional Managing Offices (50-99: 1)
Other Services (except Public Administration): Religious Organizations (20-49: 2, 1-4: 2)
Construction: Plumbing, Heating, and Air-Conditioning Contractors (10-19: 1, 1-4: 6)
Construction: New Single-Family Housing Construction (except Operative Builders) (5-9: 1, 1-4: 7)
Construction: Tile and Terrazzo Contractors (10-19: 1, 1-4: 2)
Administrative and Support and Waste Management and Remediation Services: Landscaping Services (10-19: 1, 1-4: 1)
People in group quarters in 2010:
117 people in nursing facilities/skilled-nursing facilities
12 people in emergency and transitional shelters (with sleeping facilities) for people experiencing homelessness
Fatal accident statistics in 2010:
Fatal accident count: 1
Vehicles involved in fatal accidents: 1
Fatal accidents caused by drunken drivers: 0
Fatalities: 1
Persons involved in fatal accidents: 1
Pedestrians involved in fatal accidents: 0
Home Mortgage Disclosure Act Aggregated Statistics For Year 2009 (Based on 6 partial tracts)
A) FHA, FSA/RHS & VA Home Purchase Loans
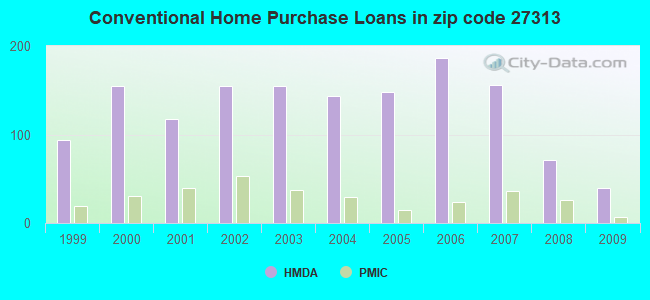
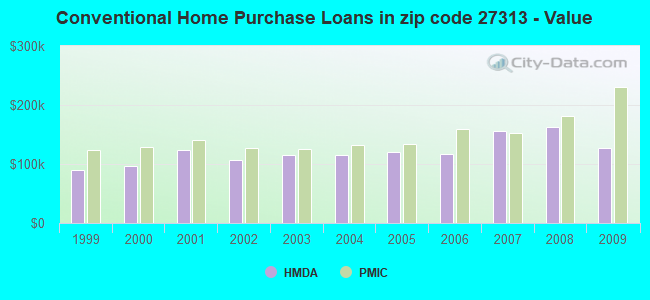
B) Conventional Home Purchase Loans
C) Refinancings
D) Home Improvement Loans
F) Non-occupant Loans on < 5 Family Dwellings (A B C & D)
G) Loans On Manufactured Home Dwelling (A B C & D)
Number
Average Value
Number
Average Value
Number
Average Value
Number
Average Value
Number
Average Value
Number
Average Value
LOANS ORIGINATED
40
$134,984
40
$126,961
253
$148,674
7
$57,026
11
$120,422
13
$60,654
APPLICATIONS APPROVED, NOT ACCEPTED
2
$225,865
2
$155,450
18
$152,542
0
$0
0
$0
2
$118,035
APPLICATIONS DENIED
7
$106,433
6
$94,767
120
$142,524
5
$36,028
9
$73,940
10
$80,477
APPLICATIONS WITHDRAWN
10
$121,287
9
$195,828
57
$141,908
3
$94,993
3
$89,147
3
$115,177
FILES CLOSED FOR INCOMPLETENESS
2
$89,890
1
$140,940
19
$136,510
0
$0
1
$62,640
1
$89,860
Aggregated Statistics For Year 2008 (Based on 6 partial tracts)
A) FHA, FSA/RHS & VA Home Purchase Loans
B) Conventional Home Purchase Loans
C) Refinancings
D) Home Improvement Loans
F) Non-occupant Loans on < 5 Family Dwellings (A B C & D)
G) Loans On Manufactured Home Dwelling (A B C & D)
Number
Average Value
Number
Average Value
Number
Average Value
Number
Average Value
Number
Average Value
Number
Average Value
LOANS ORIGINATED
42
$139,203
71
$162,180
158
$144,807
12
$72,308
13
$108,729
16
$70,677
APPLICATIONS APPROVED, NOT ACCEPTED
2
$151,900
6
$154,092
35
$150,429
1
$55,830
2
$52,930
1
$35,770
APPLICATIONS DENIED
9
$148,909
18
$110,032
153
$140,097
32
$61,006
9
$98,549
17
$66,967
APPLICATIONS WITHDRAWN
6
$143,187
10
$109,202
67
$154,431
2
$144,150
3
$72,037
4
$107,605
FILES CLOSED FOR INCOMPLETENESS
0
$0
0
$0
17
$166,445
1
$72,520
0
$0
1
$64,560
Aggregated Statistics For Year 2007 (Based on 6 partial tracts)
A) FHA, FSA/RHS & VA Home Purchase Loans
B) Conventional Home Purchase Loans
C) Refinancings
D) Home Improvement Loans
E) Loans on Dwellings For 5+ Families
F) Non-occupant Loans on < 5 Family Dwellings (A B C & D)
G) Loans On Manufactured Home Dwelling (A B C & D)
Number
Average Value
Number
Average Value
Number
Average Value
Number
Average Value
Number
Average Value
Number
Average Value
Number
Average Value
LOANS ORIGINATED
32
$133,471
156
$155,654
179
$130,481
15
$56,548
1
$2,063,360
27
$121,633
22
$86,946
APPLICATIONS APPROVED, NOT ACCEPTED
2
$193,345
20
$120,620
48
$121,375
3
$37,133
0
$0
6
$133,575
4
$55,090
APPLICATIONS DENIED
13
$138,719
50
$123,219
169
$131,588
28
$56,624
0
$0
17
$115,624
17
$72,849
APPLICATIONS WITHDRAWN
2
$139,025
35
$137,360
84
$152,982
8
$51,210
0
$0
9
$121,373
7
$89,104
FILES CLOSED FOR INCOMPLETENESS
0
$0
12
$187,712
22
$153,610
2
$47,975
0
$0
3
$133,317
1
$53,220
Aggregated Statistics For Year 2006 (Based on 6 partial tracts)
A) FHA, FSA/RHS & VA Home Purchase Loans
B) Conventional Home Purchase Loans
C) Refinancings
D) Home Improvement Loans
F) Non-occupant Loans on < 5 Family Dwellings (A B C & D)
G) Loans On Manufactured Home Dwelling (A B C & D)
Number
Average Value
Number
Average Value
Number
Average Value
Number
Average Value
Number
Average Value
Number
Average Value
LOANS ORIGINATED
24
$120,566
186
$117,038
225
$113,146
16
$91,011
24
$85,608
25
$75,779
APPLICATIONS APPROVED, NOT ACCEPTED
2
$72,015
20
$103,709
45
$99,397
3
$47,617
4
$66,272
9
$50,111
APPLICATIONS DENIED
4
$85,530
38
$109,630
191
$129,850
31
$52,150
10
$111,679
22
$60,808
APPLICATIONS WITHDRAWN
4
$142,100
15
$148,509
104
$131,717
11
$104,753
6
$95,777
3
$72,700
FILES CLOSED FOR INCOMPLETENESS
0
$0
13
$137,522
31
$170,285
0
$0
0
$0
0
$0
Aggregated Statistics For Year 2005 (Based on 6 partial tracts)
A) FHA, FSA/RHS & VA Home Purchase Loans
B) Conventional Home Purchase Loans
C) Refinancings
D) Home Improvement Loans
F) Non-occupant Loans on < 5 Family Dwellings (A B C & D)
G) Loans On Manufactured Home Dwelling (A B C & D)
Number
Average Value
Number
Average Value
Number
Average Value
Number
Average Value
Number
Average Value
Number
Average Value
LOANS ORIGINATED
18
$129,579
148
$120,887
274
$109,583
20
$77,173
32
$88,558
27
$70,139
APPLICATIONS APPROVED, NOT ACCEPTED
2
$163,395
21
$106,600
53
$128,361
6
$25,997
5
$90,154
9
$71,228
APPLICATIONS DENIED
5
$143,824
51
$89,165
244
$118,529
45
$45,189
8
$62,979
41
$66,770
APPLICATIONS WITHDRAWN
7
$136,496
27
$100,939
107
$132,368
15
$153,376
7
$84,677
10
$89,144
FILES CLOSED FOR INCOMPLETENESS
0
$0
5
$98,694
39
$152,289
2
$84,760
3
$173,700
2
$90,325
Aggregated Statistics For Year 2004 (Based on 6 partial tracts)
A) FHA, FSA/RHS & VA Home Purchase Loans
B) Conventional Home Purchase Loans
C) Refinancings
D) Home Improvement Loans
F) Non-occupant Loans on < 5 Family Dwellings (A B C & D)
G) Loans On Manufactured Home Dwelling (A B C & D)
Number
Average Value
Number
Average Value
Number
Average Value
Number
Average Value
Number
Average Value
Number
Average Value
LOANS ORIGINATED
18
$105,139
143
$115,345
256
$113,800
26
$45,301
27
$93,863
24
$68,892
APPLICATIONS APPROVED, NOT ACCEPTED
3
$141,257
21
$91,776
57
$101,562
7
$23,854
3
$58,263
14
$49,559
APPLICATIONS DENIED
2
$116,135
52
$94,015
267
$118,305
28
$70,398
13
$138,475
38
$68,604
APPLICATIONS WITHDRAWN
5
$129,820
29
$122,310
107
$132,061
14
$111,439
7
$110,281
11
$67,849
FILES CLOSED FOR INCOMPLETENESS
2
$110,595
8
$113,872
32
$134,333
0
$0
1
$114,610
2
$93,510
Aggregated Statistics For Year 2003 (Based on 6 partial tracts)
A) FHA, FSA/RHS & VA Home Purchase Loans
B) Conventional Home Purchase Loans
C) Refinancings
D) Home Improvement Loans
F) Non-occupant Loans on < 5 Family Dwellings (A B C & D)
Number
Average Value
Number
Average Value
Number
Average Value
Number
Average Value
Number
Average Value
LOANS ORIGINATED
27
$123,430
155
$114,431
584
$115,055
19
$32,917
30
$96,949
APPLICATIONS APPROVED, NOT ACCEPTED
3
$149,557
33
$101,716
72
$108,058
1
$27,630
3
$96,577
APPLICATIONS DENIED
3
$131,530
54
$93,945
213
$125,211
25
$29,558
12
$134,225
APPLICATIONS WITHDRAWN
4
$117,375
29
$113,766
109
$123,077
5
$57,088
4
$89,432
FILES CLOSED FOR INCOMPLETENESS
1
$36,960
3
$147,973
25
$127,766
1
$11,630
4
$99,642
Aggregated Statistics For Year 2002 (Based on 6 partial tracts)
A) FHA, FSA/RHS & VA Home Purchase Loans
B) Conventional Home Purchase Loans
C) Refinancings
D) Home Improvement Loans
F) Non-occupant Loans on < 5 Family Dwellings (A B C & D)
Number
Average Value
Number
Average Value
Number
Average Value
Number
Average Value
Number
Average Value
LOANS ORIGINATED
28
$123,738
155
$106,554
402
$116,784
18
$28,104
21
$94,245
APPLICATIONS APPROVED, NOT ACCEPTED
1
$52,930
26
$79,894
55
$99,163
3
$51,217
1
$175,730
APPLICATIONS DENIED
7
$111,150
77
$63,942
184
$102,867
22
$19,491
6
$92,385
APPLICATIONS WITHDRAWN
4
$97,142
13
$108,228
74
$139,609
3
$36,000
1
$116,550
FILES CLOSED FOR INCOMPLETENESS
2
$96,890
3
$105,187
22
$129,239
0
$0
0
$0
Aggregated Statistics For Year 2001 (Based on 6 partial tracts)
A) FHA, FSA/RHS & VA Home Purchase Loans
B) Conventional Home Purchase Loans
C) Refinancings
D) Home Improvement Loans
E) Loans on Dwellings For 5+ Families
F) Non-occupant Loans on < 5 Family Dwellings (A B C & D)
Number
Average Value
Number
Average Value
Number
Average Value
Number
Average Value
Number
Average Value
Number
Average Value
LOANS ORIGINATED
43
$110,766
118
$123,568
375
$110,749
32
$24,135
1
$8,456,400
14
$66,459
APPLICATIONS APPROVED, NOT ACCEPTED
2
$129,375
43
$63,150
53
$90,080
10
$16,654
0
$0
5
$43,606
APPLICATIONS DENIED
3
$120,707
89
$55,495
168
$94,475
28
$29,536
0
$0
6
$51,047
APPLICATIONS WITHDRAWN
2
$144,860
16
$84,519
63
$95,955
5
$9,134
0
$0
0
$0
FILES CLOSED FOR INCOMPLETENESS
1
$88,520
3
$186,320
17
$109,317
1
$78,340
0
$0
0
$0
Aggregated Statistics For Year 2000 (Based on 6 partial tracts)
A) FHA, FSA/RHS & VA Home Purchase Loans
B) Conventional Home Purchase Loans
C) Refinancings
D) Home Improvement Loans
F) Non-occupant Loans on < 5 Family Dwellings (A B C & D)
Number
Average Value
Number
Average Value
Number
Average Value
Number
Average Value
Number
Average Value
LOANS ORIGINATED
34
$118,488
155
$96,925
130
$83,440
22
$21,311
20
$64,186
APPLICATIONS APPROVED, NOT ACCEPTED
21
$42,538
48
$52,074
36
$75,259
14
$24,632
4
$53,225
APPLICATIONS DENIED
19
$68,538
125
$50,729
129
$78,506
25
$16,160
5
$73,460
APPLICATIONS WITHDRAWN
8
$90,661
15
$95,095
71
$83,741
3
$89,253
1
$83,080
FILES CLOSED FOR INCOMPLETENESS
1
$74,540
2
$122,265
12
$110,783
0
$0
0
$0
Aggregated Statistics For Year 1999 (Based on 3 partial tracts)
A) FHA, FSA/RHS & VA Home Purchase Loans
B) Conventional Home Purchase Loans
C) Refinancings
D) Home Improvement Loans
F) Non-occupant Loans on < 5 Family Dwellings (A B C & D)
2002 - 2018 National Fire Incident Reporting System (NFIRS) incidents
Based on the data from the years 2002 - 2018 the average number of fires per year is 44. The highest number of reported fires - 75 took place in 2014, and the least - 11 in 2017. The data has a growing trend.
When looking into fire subcategories, the most reports belonged to: Structure Fires (50.6%), and Outside Fires (39.0%).
Fire incident types reported to NFIRS in Zip Code 27313


 Nearest zip codes: 27233, 27406, 27317, 27283, 27401, 27407.


 Based on the data from the years 2002 - 2018 the average number of fires per year is 44. The highest number of reported fires - 75 took place in 2014, and the least - 11 in 2017. The data has a growing trend.
 When looking into fire subcategories, the most reports belonged to: Structure Fires (50.6%), and Outside Fires (39.0%).