Cities: Elon, NC (6.83%) ,
Altamahaw, NC (2.73%) ,
Ossipee, NC (1.22%) ,
Glen Raven, NC (0.69%) ,
Burlington, NC (0.28%) ,
Gibsonville, NC (0.25%) Counties: Alamance County, NC (51.75%) ,
Caswell County, NC (37.89%) ,
Guilford County, NC (10.36%) Estimated zip code population in 2022: 16,443
Zip code population in 2010: 14,173
Zip code population in 2000: 10,762
Houses and condos: 5,809
Renter-occupied apartments: 1,277
% of renters here:
25%State:
33%
March 2022 cost of living index in zip code 27244: 92.0
(less than average, U.S. average is 100)
Land area: 50.5
sq. mi.
Water area: 0.7
sq. mi.
Population density: 326 people per square mile (very low).
OSM Map
General Map
Google Map
MSN Map
OSM Map
General Map
Google Map
MSN Map
OSM Map
General Map
Google Map
MSN Map
OSM Map
General Map
Google Map
MSN Map
Please wait while loading the map...
Real estate property taxes paid for housing units in 2022:
This zip code:
0.6% ($1,813)North Carolina:
0.6% ($1,769)
Median real estate property taxes paid for housing units with mortgages in 2022: $2,049 (0.6%)
Median real estate property taxes paid for housing units with no mortgage in 2022: $1,465 (0.6%)
Profiles of local businesses
Business Search - 14 Million verified businesses
Males: 7,879 Females: 8,565
For population 25 years and over in 27244:
High school or higher: 91.2%Bachelor's degree or higher: 36.4%Graduate or professional degree: 15.2%Unemployed: 3.5%Mean travel time to work (commute): 25.1 minutes
For population 15 years and over in 27244:
Never married: 50.3%Now married: 38.1%Separated: 0.5%Widowed: 6.6%Divorced: 4.6%
Zip code 27244 compared to state average:
Black race population percentage below state average. Hispanic race population percentage below state average. Median age significantly below state average. Foreign-born population percentage below state average. Number of college students significantly above state average. 13,196 80.3% White 1,742 10.6% Black 671 4.1% Hispanic or Latino 449 2.7% Asian 384 2.3% Two or more races
Data:
Median household income ($)
Median household income (% change since 2000)
Household income diversity
Ratio of average income to average house value (%)
Ratio of average income to average rent
Median household income ($) - White
Median household income ($) - Black or African American
Median household income ($) - Asian
Median household income ($) - Hispanic or Latino
Median household income ($) - American Indian and Alaska Native
Median household income ($) - Multirace
Median household income ($) - Other Race
Median household income for houses/condos with a mortgage ($)
Median household income for apartments without a mortgage ($)
Races - White alone (%)
Races - White alone (% change since 2000)
Races - Black alone (%)
Races - Black alone (% change since 2000)
Races - American Indian alone (%)
Races - American Indian alone (% change since 2000)
Races - Asian alone (%)
Races - Asian alone (% change since 2000)
Races - Hispanic (%)
Races - Hispanic (% change since 2000)
Races - Native Hawaiian and Other Pacific Islander alone (%)
Races - Native Hawaiian and Other Pacific Islander alone (% change since 2000)
Races - Two or more races (%)
Races - Two or more races (% change since 2000)
Races - Other race alone (%)
Races - Other race alone (% change since 2000)
Racial diversity
Unemployment (%)
Unemployment (% change since 2000)
Unemployment (%) - White
Unemployment (%) - Black or African American
Unemployment (%) - Asian
Unemployment (%) - Hispanic or Latino
Unemployment (%) - American Indian and Alaska Native
Unemployment (%) - Multirace
Unemployment (%) - Other Race
Population density (people per square mile)
Population - Males (%)
Population - Females (%)
Population - Males (%) - White
Population - Males (%) - Black or African American
Population - Males (%) - Asian
Population - Males (%) - Hispanic or Latino
Population - Males (%) - American Indian and Alaska Native
Population - Males (%) - Multirace
Population - Males (%) - Other Race
Population - Females (%) - White
Population - Females (%) - Black or African American
Population - Females (%) - Asian
Population - Females (%) - Hispanic or Latino
Population - Females (%) - American Indian and Alaska Native
Population - Females (%) - Multirace
Population - Females (%) - Other Race
Coronavirus confirmed cases (May 22, 2024)
Deaths caused by coronavirus (May 22, 2024)
Coronavirus confirmed cases (per 100k population) (May 22, 2024)
Deaths caused by coronavirus (per 100k population) (May 22, 2024)
Daily increase in number of cases (May 22, 2024)
Weekly increase in number of cases (May 22, 2024)
Cases doubled (in days) (May 22, 2024)
Hospitalized patients (Apr 18, 2022)
Negative test results (Apr 18, 2022)
Total test results (Apr 18, 2022)
COVID Vaccine doses distributed (per 100k population) (Sep 19, 2023)
COVID Vaccine doses administered (per 100k population) (Sep 19, 2023)
COVID Vaccine doses distributed (Sep 19, 2023)
COVID Vaccine doses administered (Sep 19, 2023)
Likely homosexual households (%)
Likely homosexual households (% change since 2000)
Likely homosexual households - Lesbian couples (%)
Likely homosexual households - Lesbian couples (% change since 2000)
Likely homosexual households - Gay men (%)
Likely homosexual households - Gay men (% change since 2000)
Cost of living index
Median gross rent ($)
Median contract rent ($)
Median monthly housing costs ($)
Median house or condo value ($)
Median house or condo value ($ change since 2000)
Mean house or condo value by units in structure - 1, detached ($)
Mean house or condo value by units in structure - 1, attached ($)
Mean house or condo value by units in structure - 2 ($)
Mean house or condo value by units in structure by units in structure - 3 or 4 ($)
Mean house or condo value by units in structure - 5 or more ($)
Mean house or condo value by units in structure - Boat, RV, van, etc. ($)
Mean house or condo value by units in structure - Mobile home ($)
Median house or condo value ($) - White
Median house or condo value ($) - Black or African American
Median house or condo value ($) - Asian
Median house or condo value ($) - Hispanic or Latino
Median house or condo value ($) - American Indian and Alaska Native
Median house or condo value ($) - Multirace
Median house or condo value ($) - Other Race
Median resident age
Resident age diversity
Median resident age - Males
Median resident age - Females
Median resident age - White
Median resident age - Black or African American
Median resident age - Asian
Median resident age - Hispanic or Latino
Median resident age - American Indian and Alaska Native
Median resident age - Multirace
Median resident age - Other Race
Median resident age - Males - White
Median resident age - Males - Black or African American
Median resident age - Males - Asian
Median resident age - Males - Hispanic or Latino
Median resident age - Males - American Indian and Alaska Native
Median resident age - Males - Multirace
Median resident age - Males - Other Race
Median resident age - Females - White
Median resident age - Females - Black or African American
Median resident age - Females - Asian
Median resident age - Females - Hispanic or Latino
Median resident age - Females - American Indian and Alaska Native
Median resident age - Females - Multirace
Median resident age - Females - Other Race
Commute - mean travel time to work (minutes)
Travel time to work - Less than 5 minutes (%)
Travel time to work - Less than 5 minutes (% change since 2000)
Travel time to work - 5 to 9 minutes (%)
Travel time to work - 5 to 9 minutes (% change since 2000)
Travel time to work - 10 to 19 minutes (%)
Travel time to work - 10 to 19 minutes (% change since 2000)
Travel time to work - 20 to 29 minutes (%)
Travel time to work - 20 to 29 minutes (% change since 2000)
Travel time to work - 30 to 39 minutes (%)
Travel time to work - 30 to 39 minutes (% change since 2000)
Travel time to work - 40 to 59 minutes (%)
Travel time to work - 40 to 59 minutes (% change since 2000)
Travel time to work - 60 to 89 minutes (%)
Travel time to work - 60 to 89 minutes (% change since 2000)
Travel time to work - 90 or more minutes (%)
Travel time to work - 90 or more minutes (% change since 2000)
Marital status - Never married (%)
Marital status - Now married (%)
Marital status - Separated (%)
Marital status - Widowed (%)
Marital status - Divorced (%)
Median family income ($)
Median family income (% change since 2000)
Median non-family income ($)
Median non-family income (% change since 2000)
Median per capita income ($)
Median per capita income (% change since 2000)
Median family income ($) - White
Median family income ($) - Black or African American
Median family income ($) - Asian
Median family income ($) - Hispanic or Latino
Median family income ($) - American Indian and Alaska Native
Median family income ($) - Multirace
Median family income ($) - Other Race
Median year house/condo built
Median year apartment built
Year house built - Built 2005 or later (%)
Year house built - Built 2000 to 2004 (%)
Year house built - Built 1990 to 1999 (%)
Year house built - Built 1980 to 1989 (%)
Year house built - Built 1970 to 1979 (%)
Year house built - Built 1960 to 1969 (%)
Year house built - Built 1950 to 1959 (%)
Year house built - Built 1940 to 1949 (%)
Year house built - Built 1939 or earlier (%)
Average household size
Household density (households per square mile)
Average household size - White
Average household size - Black or African American
Average household size - Asian
Average household size - Hispanic or Latino
Average household size - American Indian and Alaska Native
Average household size - Multirace
Average household size - Other Race
Occupied housing units (%)
Vacant housing units (%)
Owner occupied housing units (%)
Renter occupied housing units (%)
Vacancy status - For rent (%)
Vacancy status - For sale only (%)
Vacancy status - Rented or sold, not occupied (%)
Vacancy status - For seasonal, recreational, or occasional use (%)
Vacancy status - For migrant workers (%)
Vacancy status - Other vacant (%)
Residents with income below the poverty level (%)
Residents with income below 50% of the poverty level (%)
Children below poverty level (%)
Poor families by family type - Married-couple family (%)
Poor families by family type - Male, no wife present (%)
Poor families by family type - Female, no husband present (%)
Poverty status for native-born residents (%)
Poverty status for foreign-born residents (%)
Poverty among high school graduates not in families (%)
Poverty among people who did not graduate high school not in families (%)
Residents with income below the poverty level (%) - White
Residents with income below the poverty level (%) - Black or African American
Residents with income below the poverty level (%) - Asian
Residents with income below the poverty level (%) - Hispanic or Latino
Residents with income below the poverty level (%) - American Indian and Alaska Native
Residents with income below the poverty level (%) - Multirace
Residents with income below the poverty level (%) - Other Race
Air pollution - Air Quality Index (AQI)
Air pollution - CO
Air pollution - NO2
Air pollution - SO2
Air pollution - Ozone
Air pollution - PM10
Air pollution - PM25
Air pollution - Pb
Crime - Murders per 100,000 population
Crime - Rapes per 100,000 population
Crime - Robberies per 100,000 population
Crime - Assaults per 100,000 population
Crime - Burglaries per 100,000 population
Crime - Thefts per 100,000 population
Crime - Auto thefts per 100,000 population
Crime - Arson per 100,000 population
Crime - City-data.com crime index
Crime - Violent crime index
Crime - Property crime index
Crime - Murders per 100,000 population (5 year average)
Crime - Rapes per 100,000 population (5 year average)
Crime - Robberies per 100,000 population (5 year average)
Crime - Assaults per 100,000 population (5 year average)
Crime - Burglaries per 100,000 population (5 year average)
Crime - Thefts per 100,000 population (5 year average)
Crime - Auto thefts per 100,000 population (5 year average)
Crime - Arson per 100,000 population (5 year average)
Crime - City-data.com crime index (5 year average)
Crime - Violent crime index (5 year average)
Crime - Property crime index (5 year average)
1996 Presidential Elections Results (%) - Democratic Party (Clinton)
1996 Presidential Elections Results (%) - Republican Party (Dole)
1996 Presidential Elections Results (%) - Other
2000 Presidential Elections Results (%) - Democratic Party (Gore)
2000 Presidential Elections Results (%) - Republican Party (Bush)
2000 Presidential Elections Results (%) - Other
2004 Presidential Elections Results (%) - Democratic Party (Kerry)
2004 Presidential Elections Results (%) - Republican Party (Bush)
2004 Presidential Elections Results (%) - Other
2008 Presidential Elections Results (%) - Democratic Party (Obama)
2008 Presidential Elections Results (%) - Republican Party (McCain)
2008 Presidential Elections Results (%) - Other
2012 Presidential Elections Results (%) - Democratic Party (Obama)
2012 Presidential Elections Results (%) - Republican Party (Romney)
2012 Presidential Elections Results (%) - Other
2016 Presidential Elections Results (%) - Democratic Party (Clinton)
2016 Presidential Elections Results (%) - Republican Party (Trump)
2016 Presidential Elections Results (%) - Other
2020 Presidential Elections Results (%) - Democratic Party (Biden)
2020 Presidential Elections Results (%) - Republican Party (Trump)
2020 Presidential Elections Results (%) - Other
Ancestries Reported - Arab (%)
Ancestries Reported - Czech (%)
Ancestries Reported - Danish (%)
Ancestries Reported - Dutch (%)
Ancestries Reported - English (%)
Ancestries Reported - French (%)
Ancestries Reported - French Canadian (%)
Ancestries Reported - German (%)
Ancestries Reported - Greek (%)
Ancestries Reported - Hungarian (%)
Ancestries Reported - Irish (%)
Ancestries Reported - Italian (%)
Ancestries Reported - Lithuanian (%)
Ancestries Reported - Norwegian (%)
Ancestries Reported - Polish (%)
Ancestries Reported - Portuguese (%)
Ancestries Reported - Russian (%)
Ancestries Reported - Scotch-Irish (%)
Ancestries Reported - Scottish (%)
Ancestries Reported - Slovak (%)
Ancestries Reported - Subsaharan African (%)
Ancestries Reported - Swedish (%)
Ancestries Reported - Swiss (%)
Ancestries Reported - Ukrainian (%)
Ancestries Reported - United States (%)
Ancestries Reported - Welsh (%)
Ancestries Reported - West Indian (%)
Ancestries Reported - Other (%)
Educational Attainment - No schooling completed (%)
Educational Attainment - Less than high school (%)
Educational Attainment - High school or equivalent (%)
Educational Attainment - Less than 1 year of college (%)
Educational Attainment - 1 or more years of college (%)
Educational Attainment - Associate degree (%)
Educational Attainment - Bachelor's degree (%)
Educational Attainment - Master's degree (%)
Educational Attainment - Professional school degree (%)
Educational Attainment - Doctorate degree (%)
School Enrollment - Nursery, preschool (%)
School Enrollment - Kindergarten (%)
School Enrollment - Grade 1 to 4 (%)
School Enrollment - Grade 5 to 8 (%)
School Enrollment - Grade 9 to 12 (%)
School Enrollment - College undergrad (%)
School Enrollment - Graduate or professional (%)
School Enrollment - Not enrolled in school (%)
School enrollment - Public schools (%)
School enrollment - Private schools (%)
School enrollment - Not enrolled (%)
Median number of rooms in houses and condos
Median number of rooms in apartments
Housing units lacking complete plumbing facilities (%)
Housing units lacking complete kitchen facilities (%)
Density of houses
Urban houses (%)
Rural houses (%)
Households with people 60 years and over (%)
Households with people 65 years and over (%)
Households with people 75 years and over (%)
Households with one or more nonrelatives (%)
Households with no nonrelatives (%)
Population in households (%)
Family households (%)
Nonfamily households (%)
Population in families (%)
Family households with own children (%)
Median number of bedrooms in owner occupied houses
Mean number of bedrooms in owner occupied houses
Median number of bedrooms in renter occupied houses
Mean number of bedrooms in renter occupied houses
Median number of vehichles in owner occupied houses
Mean number of vehichles in owner occupied houses
Median number of vehichles in renter occupied houses
Mean number of vehichles in renter occupied houses
Mortgage status - with mortgage (%)
Mortgage status - with second mortgage (%)
Mortgage status - with home equity loan (%)
Mortgage status - with both second mortgage and home equity loan (%)
Mortgage status - without a mortgage (%)
Average family size
Average family size - White
Average family size - Black or African American
Average family size - Asian
Average family size - Hispanic or Latino
Average family size - American Indian and Alaska Native
Average family size - Multirace
Average family size - Other Race
Geographical mobility - Same house 1 year ago (%)
Geographical mobility - Moved within same county (%)
Geographical mobility - Moved from different county within same state (%)
Geographical mobility - Moved from different state (%)
Geographical mobility - Moved from abroad (%)
Place of birth - Born in state of residence (%)
Place of birth - Born in other state (%)
Place of birth - Native, outside of US (%)
Place of birth - Foreign born (%)
Housing units in structures - 1, detached (%)
Housing units in structures - 1, attached (%)
Housing units in structures - 2 (%)
Housing units in structures - 3 or 4 (%)
Housing units in structures - 5 to 9 (%)
Housing units in structures - 10 to 19 (%)
Housing units in structures - 20 to 49 (%)
Housing units in structures - 50 or more (%)
Housing units in structures - Mobile home (%)
Housing units in structures - Boat, RV, van, etc. (%)
House/condo owner moved in on average (years ago)
Renter moved in on average (years ago)
Year householder moved into unit - Moved in 1999 to March 2000 (%)
Year householder moved into unit - Moved in 1995 to 1998 (%)
Year householder moved into unit - Moved in 1990 to 1994 (%)
Year householder moved into unit - Moved in 1980 to 1989 (%)
Year householder moved into unit - Moved in 1970 to 1979 (%)
Year householder moved into unit - Moved in 1969 or earlier (%)
Means of transportation to work - Drove car alone (%)
Means of transportation to work - Carpooled (%)
Means of transportation to work - Public transportation (%)
Means of transportation to work - Bus or trolley bus (%)
Means of transportation to work - Streetcar or trolley car (%)
Means of transportation to work - Subway or elevated (%)
Means of transportation to work - Railroad (%)
Means of transportation to work - Ferryboat (%)
Means of transportation to work - Taxicab (%)
Means of transportation to work - Motorcycle (%)
Means of transportation to work - Bicycle (%)
Means of transportation to work - Walked (%)
Means of transportation to work - Other means (%)
Working at home (%)
Industry diversity
Most Common Industries - Agriculture, forestry, fishing and hunting, and mining (%)
Most Common Industries - Agriculture, forestry, fishing and hunting (%)
Most Common Industries - Mining, quarrying, and oil and gas extraction (%)
Most Common Industries - Construction (%)
Most Common Industries - Manufacturing (%)
Most Common Industries - Wholesale trade (%)
Most Common Industries - Retail trade (%)
Most Common Industries - Transportation and warehousing, and utilities (%)
Most Common Industries - Transportation and warehousing (%)
Most Common Industries - Utilities (%)
Most Common Industries - Information (%)
Most Common Industries - Finance and insurance, and real estate and rental and leasing (%)
Most Common Industries - Finance and insurance (%)
Most Common Industries - Real estate and rental and leasing (%)
Most Common Industries - Professional, scientific, and management, and administrative and waste management services (%)
Most Common Industries - Professional, scientific, and technical services (%)
Most Common Industries - Management of companies and enterprises (%)
Most Common Industries - Administrative and support and waste management services (%)
Most Common Industries - Educational services, and health care and social assistance (%)
Most Common Industries - Educational services (%)
Most Common Industries - Health care and social assistance (%)
Most Common Industries - Arts, entertainment, and recreation, and accommodation and food services (%)
Most Common Industries - Arts, entertainment, and recreation (%)
Most Common Industries - Accommodation and food services (%)
Most Common Industries - Other services, except public administration (%)
Most Common Industries - Public administration (%)
Occupation diversity
Most Common Occupations - Management, business, science, and arts occupations (%)
Most Common Occupations - Management, business, and financial occupations (%)
Most Common Occupations - Management occupations (%)
Most Common Occupations - Business and financial operations occupations (%)
Most Common Occupations - Computer, engineering, and science occupations (%)
Most Common Occupations - Computer and mathematical occupations (%)
Most Common Occupations - Architecture and engineering occupations (%)
Most Common Occupations - Life, physical, and social science occupations (%)
Most Common Occupations - Education, legal, community service, arts, and media occupations (%)
Most Common Occupations - Community and social service occupations (%)
Most Common Occupations - Legal occupations (%)
Most Common Occupations - Education, training, and library occupations (%)
Most Common Occupations - Arts, design, entertainment, sports, and media occupations (%)
Most Common Occupations - Healthcare practitioners and technical occupations (%)
Most Common Occupations - Health diagnosing and treating practitioners and other technical occupations (%)
Most Common Occupations - Health technologists and technicians (%)
Most Common Occupations - Service occupations (%)
Most Common Occupations - Healthcare support occupations (%)
Most Common Occupations - Protective service occupations (%)
Most Common Occupations - Fire fighting and prevention, and other protective service workers including supervisors (%)
Most Common Occupations - Law enforcement workers including supervisors (%)
Most Common Occupations - Food preparation and serving related occupations (%)
Most Common Occupations - Building and grounds cleaning and maintenance occupations (%)
Most Common Occupations - Personal care and service occupations (%)
Most Common Occupations - Sales and office occupations (%)
Most Common Occupations - Sales and related occupations (%)
Most Common Occupations - Office and administrative support occupations (%)
Most Common Occupations - Natural resources, construction, and maintenance occupations (%)
Most Common Occupations - Farming, fishing, and forestry occupations (%)
Most Common Occupations - Construction and extraction occupations (%)
Most Common Occupations - Installation, maintenance, and repair occupations (%)
Most Common Occupations - Production, transportation, and material moving occupations (%)
Most Common Occupations - Production occupations (%)
Most Common Occupations - Transportation occupations (%)
Most Common Occupations - Material moving occupations (%)
People in Group quarters - Institutionalized population (%)
People in Group quarters - Correctional institutions (%)
People in Group quarters - Federal prisons and detention centers (%)
People in Group quarters - Halfway houses (%)
People in Group quarters - Local jails and other confinement facilities (including police lockups) (%)
People in Group quarters - Military disciplinary barracks (%)
People in Group quarters - State prisons (%)
People in Group quarters - Other types of correctional institutions (%)
People in Group quarters - Nursing homes (%)
People in Group quarters - Hospitals/wards, hospices, and schools for the handicapped (%)
People in Group quarters - Hospitals/wards and hospices for chronically ill (%)
People in Group quarters - Hospices or homes for chronically ill (%)
People in Group quarters - Military hospitals or wards for chronically ill (%)
People in Group quarters - Other hospitals or wards for chronically ill (%)
People in Group quarters - Hospitals or wards for drug/alcohol abuse (%)
People in Group quarters - Mental (Psychiatric) hospitals or wards (%)
People in Group quarters - Schools, hospitals, or wards for the mentally retarded (%)
People in Group quarters - Schools, hospitals, or wards for the physically handicapped (%)
People in Group quarters - Institutions for the deaf (%)
People in Group quarters - Institutions for the blind (%)
People in Group quarters - Orthopedic wards and institutions for the physically handicapped (%)
People in Group quarters - Wards in general hospitals for patients who have no usual home elsewhere (%)
People in Group quarters - Wards in military hospitals for patients who have no usual home elsewhere (%)
People in Group quarters - Juvenile institutions (%)
People in Group quarters - Long-term care (%)
People in Group quarters - Homes for abused, dependent, and neglected children (%)
People in Group quarters - Residential treatment centers for emotionally disturbed children (%)
People in Group quarters - Training schools for juvenile delinquents (%)
People in Group quarters - Short-term care, detention or diagnostic centers for delinquent children (%)
People in Group quarters - Type of juvenile institution unknown (%)
People in Group quarters - Noninstitutionalized population (%)
People in Group quarters - College dormitories (includes college quarters off campus) (%)
People in Group quarters - Military quarters (%)
People in Group quarters - On base (%)
People in Group quarters - Barracks, unaccompanied personnel housing (UPH), (Enlisted/Officer), ;and similar group living quarters for military personnel (%)
People in Group quarters - Transient quarters for temporary residents (%)
People in Group quarters - Military ships (%)
People in Group quarters - Group homes (%)
People in Group quarters - Homes or halfway houses for drug/alcohol abuse (%)
People in Group quarters - Homes for the mentally ill (%)
People in Group quarters - Homes for the mentally retarded (%)
People in Group quarters - Homes for the physically handicapped (%)
People in Group quarters - Other group homes (%)
People in Group quarters - Religious group quarters (%)
People in Group quarters - Dormitories (%)
People in Group quarters - Agriculture workers' dormitories on farms (%)
People in Group quarters - Job Corps and vocational training facilities (%)
People in Group quarters - Other workers' dormitories (%)
People in Group quarters - Crews of maritime vessels (%)
People in Group quarters - Other nonhousehold living situations (%)
People in Group quarters - Other noninstitutional group quarters (%)
Residents speaking English at home (%)
Residents speaking English at home - Born in the United States (%)
Residents speaking English at home - Native, born elsewhere (%)
Residents speaking English at home - Foreign born (%)
Residents speaking Spanish at home (%)
Residents speaking Spanish at home - Born in the United States (%)
Residents speaking Spanish at home - Native, born elsewhere (%)
Residents speaking Spanish at home - Foreign born (%)
Residents speaking other language at home (%)
Residents speaking other language at home - Born in the United States (%)
Residents speaking other language at home - Native, born elsewhere (%)
Residents speaking other language at home - Foreign born (%)
Class of Workers - Employee of private company (%)
Class of Workers - Self-employed in own incorporated business (%)
Class of Workers - Private not-for-profit wage and salary workers (%)
Class of Workers - Local government workers (%)
Class of Workers - State government workers (%)
Class of Workers - Federal government workers (%)
Class of Workers - Self-employed workers in own not incorporated business and Unpaid family workers (%)
House heating fuel used in houses and condos - Utility gas (%)
House heating fuel used in houses and condos - Bottled, tank, or LP gas (%)
House heating fuel used in houses and condos - Electricity (%)
House heating fuel used in houses and condos - Fuel oil, kerosene, etc. (%)
House heating fuel used in houses and condos - Coal or coke (%)
House heating fuel used in houses and condos - Wood (%)
House heating fuel used in houses and condos - Solar energy (%)
House heating fuel used in houses and condos - Other fuel (%)
House heating fuel used in houses and condos - No fuel used (%)
House heating fuel used in apartments - Utility gas (%)
House heating fuel used in apartments - Bottled, tank, or LP gas (%)
House heating fuel used in apartments - Electricity (%)
House heating fuel used in apartments - Fuel oil, kerosene, etc. (%)
House heating fuel used in apartments - Coal or coke (%)
House heating fuel used in apartments - Wood (%)
House heating fuel used in apartments - Solar energy (%)
House heating fuel used in apartments - Other fuel (%)
House heating fuel used in apartments - No fuel used (%)
Armed forces status - In Armed Forces (%)
Armed forces status - Civilian (%)
Armed forces status - Civilian - Veteran (%)
Armed forces status - Civilian - Nonveteran (%)
Fatal accidents locations in years 2005-2021
Fatal accidents locations in 2005
Fatal accidents locations in 2006
Fatal accidents locations in 2007
Fatal accidents locations in 2008
Fatal accidents locations in 2009
Fatal accidents locations in 2010
Fatal accidents locations in 2011
Fatal accidents locations in 2012
Fatal accidents locations in 2013
Fatal accidents locations in 2014
Fatal accidents locations in 2015
Fatal accidents locations in 2016
Fatal accidents locations in 2017
Fatal accidents locations in 2018
Fatal accidents locations in 2019
Fatal accidents locations in 2020
Fatal accidents locations in 2021
Alcohol use - People drinking some alcohol every month (%)
Alcohol use - People not drinking at all (%)
Alcohol use - Average days/month drinking alcohol
Alcohol use - Average drinks/week
Alcohol use - Average days/year people drink much
Audiometry - Average condition of hearing (%)
Audiometry - People that can hear a whisper from across a quiet room (%)
Audiometry - People that can hear normal voice from across a quiet room (%)
Audiometry - Ears ringing, roaring, buzzing (%)
Audiometry - Had a job exposure to loud noise (%)
Audiometry - Had off-work exposure to loud noise (%)
Blood Pressure & Cholesterol - Has high blood pressure (%)
Blood Pressure & Cholesterol - Checking blood pressure at home (%)
Blood Pressure & Cholesterol - Frequently checking blood cholesterol (%)
Blood Pressure & Cholesterol - Has high cholesterol level (%)
Consumer Behavior - Money monthly spent on food at supermarket/grocery store
Consumer Behavior - Money monthly spent on food at other stores
Consumer Behavior - Money monthly spent on eating out
Consumer Behavior - Money monthly spent on carryout/delivered foods
Consumer Behavior - Income spent on food at supermarket/grocery store (%)
Consumer Behavior - Income spent on food at other stores (%)
Consumer Behavior - Income spent on eating out (%)
Consumer Behavior - Income spent on carryout/delivered foods (%)
Current Health Status - General health condition (%)
Current Health Status - Blood donors (%)
Current Health Status - Has blood ever tested for HIV virus (%)
Current Health Status - Left-handed people (%)
Dermatology - People using sunscreen (%)
Diabetes - Diabetics (%)
Diabetes - Had a blood test for high blood sugar (%)
Diabetes - People taking insulin (%)
Diet Behavior & Nutrition - Diet health (%)
Diet Behavior & Nutrition - Milk product consumption (# of products/month)
Diet Behavior & Nutrition - Meals not home prepared (#/week)
Diet Behavior & Nutrition - Meals from fast food or pizza place (#/week)
Diet Behavior & Nutrition - Ready-to-eat foods (#/month)
Diet Behavior & Nutrition - Frozen meals/pizza (#/month)
Drug Use - People that ever used marijuana or hashish (%)
Drug Use - Ever used hard drugs (%)
Drug Use - Ever used any form of cocaine (%)
Drug Use - Ever used heroin (%)
Drug Use - Ever used methamphetamine (%)
Health Insurance - People covered by health insurance (%)
Kidney Conditions-Urology - Avg. # of times urinating at night
Medical Conditions - People with asthma (%)
Medical Conditions - People with anemia (%)
Medical Conditions - People with psoriasis (%)
Medical Conditions - People with overweight (%)
Medical Conditions - Elderly people having difficulties in thinking or remembering (%)
Medical Conditions - People who ever received blood transfusion (%)
Medical Conditions - People having trouble seeing even with glass/contacts (%)
Medical Conditions - People with arthritis (%)
Medical Conditions - People with gout (%)
Medical Conditions - People with congestive heart failure (%)
Medical Conditions - People with coronary heart disease (%)
Medical Conditions - People with angina pectoris (%)
Medical Conditions - People who ever had heart attack (%)
Medical Conditions - People who ever had stroke (%)
Medical Conditions - People with emphysema (%)
Medical Conditions - People with thyroid problem (%)
Medical Conditions - People with chronic bronchitis (%)
Medical Conditions - People with any liver condition (%)
Medical Conditions - People who ever had cancer or malignancy (%)
Mental Health - People who have little interest in doing things (%)
Mental Health - People feeling down, depressed, or hopeless (%)
Mental Health - People who have trouble sleeping or sleeping too much (%)
Mental Health - People feeling tired or having little energy (%)
Mental Health - People with poor appetite or overeating (%)
Mental Health - People feeling bad about themself (%)
Mental Health - People who have trouble concentrating on things (%)
Mental Health - People moving or speaking slowly or too fast (%)
Mental Health - People having thoughts they would be better off dead (%)
Oral Health - Average years since last visit a dentist
Oral Health - People embarrassed because of mouth (%)
Oral Health - People with gum disease (%)
Oral Health - General health of teeth and gums (%)
Oral Health - Average days a week using dental floss/device
Oral Health - Average days a week using mouthwash for dental problem
Oral Health - Average number of teeth
Pesticide Use - Households using pesticides to control insects (%)
Pesticide Use - Households using pesticides to kill weeds (%)
Physical Activity - People doing vigorous-intensity work activities (%)
Physical Activity - People doing moderate-intensity work activities (%)
Physical Activity - People walking or bicycling (%)
Physical Activity - People doing vigorous-intensity recreational activities (%)
Physical Activity - People doing moderate-intensity recreational activities (%)
Physical Activity - Average hours a day doing sedentary activities
Physical Activity - Average hours a day watching TV or videos
Physical Activity - Average hours a day using computer
Physical Functioning - People having limitations keeping them from working (%)
Physical Functioning - People limited in amount of work they can do (%)
Physical Functioning - People that need special equipment to walk (%)
Physical Functioning - People experiencing confusion/memory problems (%)
Physical Functioning - People requiring special healthcare equipment (%)
Prescription Medications - Average number of prescription medicines taking
Preventive Aspirin Use - Adults 40+ taking low-dose aspirin (%)
Reproductive Health - Vaginal deliveries (%)
Reproductive Health - Cesarean deliveries (%)
Reproductive Health - Deliveries resulted in a live birth (%)
Reproductive Health - Pregnancies resulted in a delivery (%)
Reproductive Health - Women breastfeeding newborns (%)
Reproductive Health - Women that had a hysterectomy (%)
Reproductive Health - Women that had both ovaries removed (%)
Reproductive Health - Women that have ever taken birth control pills (%)
Reproductive Health - Women taking birth control pills (%)
Reproductive Health - Women that have ever used Depo-Provera or injectables (%)
Reproductive Health - Women that have ever used female hormones (%)
Sexual Behavior - People 18+ that ever had sex (vaginal, anal, or oral) (%)
Sexual Behavior - Males 18+ that ever had vaginal sex with a woman (%)
Sexual Behavior - Males 18+ that ever performed oral sex on a woman (%)
Sexual Behavior - Males 18+ that ever had anal sex with a woman (%)
Sexual Behavior - Males 18+ that ever had any sex with a man (%)
Sexual Behavior - Females 18+ that ever had vaginal sex with a man (%)
Sexual Behavior - Females 18+ that ever performed oral sex on a man (%)
Sexual Behavior - Females 18+ that ever had anal sex with a man (%)
Sexual Behavior - Females 18+ that ever had any kind of sex with a woman (%)
Sexual Behavior - Average age people first had sex
Sexual Behavior - Average number of female sex partners in lifetime (males 18+)
Sexual Behavior - Average number of female vaginal sex partners in lifetime (males 18+)
Sexual Behavior - Average age people first performed oral sex on a woman (18+)
Sexual Behavior - Average number of woman performed oral sex on in lifetime (18+)
Sexual Behavior - Average number of male sex partners in lifetime (males 18+)
Sexual Behavior - Average number of male anal sex partners in lifetime (males 18+)
Sexual Behavior - Average age people first performed oral sex on a man (18+)
Sexual Behavior - Average number of male oral sex partners in lifetime (18+)
Sexual Behavior - People using protection when performing oral sex (%)
Sexual Behavior - Average number of times people have vaginal or anal sex a year
Sexual Behavior - People having sex without condom (%)
Sexual Behavior - Average number of male sex partners in lifetime (females 18+)
Sexual Behavior - Average number of male vaginal sex partners in lifetime (females 18+)
Sexual Behavior - Average number of female sex partners in lifetime (females 18+)
Sexual Behavior - Circumcised males 18+ (%)
Sleep Disorders - Average hours sleeping at night
Sleep Disorders - People that has trouble sleeping (%)
Smoking-Cigarette Use - People smoking cigarettes (%)
Taste & Smell - People 40+ having problems with smell (%)
Taste & Smell - People 40+ having problems with taste (%)
Taste & Smell - People 40+ that ever had wisdom teeth removed (%)
Taste & Smell - People 40+ that ever had tonsils teeth removed (%)
Taste & Smell - People 40+ that ever had a loss of consciousness because of a head injury (%)
Taste & Smell - People 40+ that ever had a broken nose or other serious injury to face or skull (%)
Taste & Smell - People 40+ that ever had two or more sinus infections (%)
Weight - Average height (inches)
Weight - Average weight (pounds)
Weight - Average BMI
Weight - People that are obese (%)
Weight - People that ever were obese (%)
Weight - People trying to lose weight (%)
Urban population: 9,498
Rural population: 6,944
Estimated median house/condo value in 2022: $281,317
27244:
$281,317North Carolina:
$280,600
According to our research of North Carolina and other state lists, there were 21 registered sex offenders living in 27244 zip code as of May 22, 2024 . The ratio of all residents to sex offenders in zip code 27244 is 701 to 1.The ratio of registered sex offenders to all residents in this zip code is lower than the state average.
Median resident age: This zip code:
26.4 yearsNorth Carolina median age:
39.2 years
Average household size: This zip code:
2.5 peopleNorth Carolina:
2.4 people
Averages for the 2020 tax year for zip code 27244, filed in 2021:
Average Adjusted Gross Income (AGI) in 2020: $72,941 (Individual Income Tax Returns) Here:
$72,941State:
$70,020
Salary/wage: $61,422 (reported on 80.6% of returns )Here:
$61,422State:
$58,387
(% of AGI for various income ranges: 1099.6% for AGIs below $25k , 3729.1% for AGIs $25k-50k , 6508.6% for AGIs $50k-75k , 10045.0% for AGIs $75k-100k , 19177.3% for AGIs $100k-200k , 90682.9% for AGIs over 200k ) Taxable interest for individuals: $1,517 (reported on 35.7% of returns )This zip code:
$1,517North Carolina:
$1,479
(% of AGI for various income ranges: 25.8% for AGIs below $25k , 25.2% for AGIs $25k-50k , 58.0% for AGIs $50k-75k , 81.4% for AGIs $75k-100k , 166.4% for AGIs $100k-200k , 1488.6% for AGIs over 200k ) Ordinary dividends: $5,364 (reported on 22.2% of returns )(% of AGI for various income ranges: 39.4% for AGIs below $25k , 50.2% for AGIs $25k-50k , 146.1% for AGIs $50k-75k , 233.9% for AGIs $75k-100k , 464.5% for AGIs $100k-200k , 2580.0% for AGIs over 200k ) Net capital gain/loss in AGI: +$19,436 (reported on 20.3% of returns )Here:
+$19,436State:
+$23,652
(% of AGI for various income ranges: 11.2% for AGIs below $25k , 40.2% for AGIs $25k-50k , 116.1% for AGIs $50k-75k , 257.5% for AGIs $75k-100k , 877.3% for AGIs $100k-200k , 21612.9% for AGIs over 200k ) Profit/loss from business: +$14,711 (reported on 15.0% of returns )Here:
+$14,711State:
+$11,710
(% of AGI for various income ranges: 144.6% for AGIs below $25k , 153.9% for AGIs $25k-50k , 154.9% for AGIs $50k-75k , 195.0% for AGIs $75k-100k , 815.5% for AGIs $100k-200k , 5178.6% for AGIs over 200k ) Taxable individual retirement arrangement distribution: $16,922 (reported on 12.8% of returns )27244:
$16,922North Carolina:
$20,247
(% of AGI for various income ranges: 91.8% for AGIs below $25k , 174.4% for AGIs $25k-50k , 266.3% for AGIs $50k-75k , 384.7% for AGIs $75k-100k , 917.5% for AGIs $100k-200k , 2991.4% for AGIs over 200k ) Self-employed (Keogh) retirement plans: $25,567 (reported on 0.6% of returns )27244:
$25,567North Carolina:
$26,749
(% of AGI for various income ranges: 174.3% for AGIs $100k-200k ) Total itemized deductions: $35,636 (reported on 8.3% of returns )Here:
$35,636State:
$34,549
(% of AGI for various income ranges: 54.4% for AGIs below $25k , 166.1% for AGIs $25k-50k , 310.8% for AGIs $50k-75k , 318.1% for AGIs $75k-100k , 970.0% for AGIs $100k-200k , 9375.7% for AGIs over 200k ) Charity contributions: $15,790 (reported on 7.3% of returns )Here:
$15,790State:
$13,360
(% of AGI for various income ranges: 35.6% for AGIs $25k-50k , 71.2% for AGIs $50k-75k , 94.7% for AGIs $75k-100k , 322.5% for AGIs $100k-200k , 5305.7% for AGIs over 200k ) Taxes paid: $7,302 (reported on 7.9% of returns )(% of AGI for various income ranges: 6.3% for AGIs below $25k , 22.1% for AGIs $25k-50k , 46.7% for AGIs $50k-75k , 66.9% for AGIs $75k-100k , 268.6% for AGIs $100k-200k , 1621.4% for AGIs over 200k ) Earned income credit: $2,281 (reported on 13.9% of returns )(% of AGI for various income ranges: 89.9% for AGIs below $25k , 70.5% for AGIs $25k-50k ) Percentage of individuals using paid preparers for their 2020 taxes: 91.9%(% for various income ranges: 90.5% for AGIs below $25k , 92.0% for AGIs $25k-50k , 91.5% for AGIs $50k-75k , 93.0% for AGIs $75k-100k , 94.0% for AGIs $100k-200k , 92.9% for AGIs over 200k )
Averages for the 2012 tax year for zip code 27244, filed in 2013:
Average Adjusted Gross Income (AGI) in 2012: $61,167 (Individual Income Tax Returns) Here:
$61,167State:
$54,937
Salary/wage: $50,060 (reported on 82.3% of returns )Here:
$50,060State:
$46,336
(% of AGI for various income ranges: 70.0% for AGIs below $25k , 78.7% for AGIs $25k-50k , 72.8% for AGIs $50k-75k , 70.8% for AGIs $75k-100k , 75.6% for AGIs $100k-200k , 46.3% for AGIs over 200k ) Taxable interest for individuals: $1,379 (reported on 41.6% of returns )This zip code:
$1,379North Carolina:
$1,298
(% of AGI for various income ranges: 1.7% for AGIs below $25k , 1.1% for AGIs $25k-50k , 0.7% for AGIs $50k-75k , 1.0% for AGIs $75k-100k , 0.7% for AGIs $100k-200k , 0.9% for AGIs over 200k ) Ordinary dividends: $6,262 (reported on 24.1% of returns )(% of AGI for various income ranges: 2.4% for AGIs below $25k , 1.2% for AGIs $25k-50k , 1.1% for AGIs $50k-75k , 2.0% for AGIs $75k-100k , 2.1% for AGIs $100k-200k , 4.6% for AGIs over 200k ) Net capital gain/loss in AGI: +$4,726 (reported on 20.1% of returns )Here:
+$4,726State:
+$12,740
(% of AGI for various income ranges: 0.5% for AGIs below $25k , 0.4% for AGIs $50k-75k , 0.5% for AGIs $75k-100k , 1.3% for AGIs $100k-200k , 4.4% for AGIs over 200k ) Profit/loss from business: +$14,419 (reported on 15.1% of returns )Here:
+$14,419State:
+$10,311
(% of AGI for various income ranges: 6.7% for AGIs below $25k , 1.6% for AGIs $25k-50k , 2.8% for AGIs $50k-75k , 3.3% for AGIs $75k-100k , 3.6% for AGIs $100k-200k , 4.3% for AGIs over 200k ) Taxable individual retirement arrangement distribution: $11,835 (reported on 15.1% of returns )27244:
$11,835North Carolina:
$15,575
(% of AGI for various income ranges: 5.5% for AGIs below $25k , 3.5% for AGIs $25k-50k , 3.3% for AGIs $50k-75k , 4.1% for AGIs $75k-100k , 3.2% for AGIs $100k-200k , 0.6% for AGIs over 200k ) Self-employment retirement plans: $15,700 (reported on 0.7% of returns )27244:
$15,700North Carolina:
$21,078
Total itemized deductions: $25,265 (22% of AGI, reported on 38.3% of returns )Here:
$25,265State:
$23,438
Here:
22.3% of AGIState:
21.5% of AGI
(% of AGI for various income ranges: 13.3% for AGIs below $25k , 11.5% for AGIs $25k-50k , 14.2% for AGIs $50k-75k , 16.2% for AGIs $75k-100k , 17.5% for AGIs $100k-200k , 17.9% for AGIs over 200k ) Charity contributions: $4,875 (reported on 33.3% of returns )(% of AGI for various income ranges: 1.5% for AGIs below $25k , 1.6% for AGIs $25k-50k , 2.6% for AGIs $50k-75k , 3.0% for AGIs $75k-100k , 3.5% for AGIs $100k-200k , 2.5% for AGIs over 200k ) Taxes paid: $9,057 (reported on 38.1% of returns )(% of AGI for various income ranges: 1.9% for AGIs below $25k , 2.4% for AGIs $25k-50k , 3.9% for AGIs $50k-75k , 5.4% for AGIs $75k-100k , 7.4% for AGIs $100k-200k , 7.8% for AGIs over 200k ) Earned income credit: $2,203 (reported on 16.4% of returns )(% of AGI for various income ranges: 6.0% for AGIs below $25k , 1.2% for AGIs $25k-50k ) Percentage of individuals using paid preparers for their 2012 taxes: 52.5%(% for various income ranges: 47.6% for AGIs below $25k , 50.0% for AGIs $25k-50k , 56.2% for AGIs $50k-75k , 58.7% for AGIs $75k-100k , 54.5% for AGIs $100k-200k , 81.2% for AGIs over 200k )
Averages for the 2004 tax year for zip code 27244, filed in 2005:
Average Adjusted Gross Income (AGI) in 2004: $54,092 (Individual Income Tax Returns) Here:
$54,092State:
$45,376
Salary/wage: $43,275 (reported on 85.8% of returns )Here:
$43,275State:
$39,442
(% of AGI for various income ranges: 98.3% for AGIs below $10k , 77.3% for AGIs $10k-25k , 82.1% for AGIs $25k-50k , 77.8% for AGIs $50k-75k , 78.0% for AGIs $75k-100k , 55.0% for AGIs over 100k ) Taxable interest for individuals: $1,658 (reported on 46.5% of returns )This zip code:
$1,658North Carolina:
$1,515
(% of AGI for various income ranges: 6.7% for AGIs below $10k , 2.0% for AGIs $10k-25k , 0.9% for AGIs $25k-50k , 1.6% for AGIs $50k-75k , 1.1% for AGIs $75k-100k , 1.4% for AGIs over 100k ) Taxable dividends: $3,055 (reported on 26.4% of returns )(% of AGI for various income ranges: 3.1% for AGIs below $10k , 1.6% for AGIs $10k-25k , 1.0% for AGIs $25k-50k , 1.5% for AGIs $50k-75k , 1.4% for AGIs $75k-100k , 1.6% for AGIs over 100k ) Net capital gain/loss: +$15,402 (reported on 21.1% of returns )Here:
+$15,402State:
+$11,152
(% of AGI for various income ranges: -3.2% for AGIs below $10k , 0.1% for AGIs $10k-25k , 0.4% for AGIs $25k-50k , 0.8% for AGIs $50k-75k , 2.3% for AGIs $75k-100k , 12.4% for AGIs over 100k ) Profit/loss from business: +$11,483 (reported on 14.9% of returns )Here:
+$11,483State:
+$9,490
(% of AGI for various income ranges: 6.3% for AGIs below $10k , 5.0% for AGIs $10k-25k , 1.7% for AGIs $25k-50k , 2.4% for AGIs $50k-75k , 3.2% for AGIs $75k-100k , 3.6% for AGIs over 100k ) IRA payment deduction: $2,970 (reported on 3.1% of returns )27244:
$2,970North Carolina:
$2,967
(% of AGI for various income ranges: 0.2% for AGIs $10k-25k , 0.3% for AGIs $25k-50k , 0.3% for AGIs $50k-75k , 0.1% for AGIs $75k-100k , 0.1% for AGIs over 100k ) Self-employed pension: $13,176 (reported on 0.8% of returns )Here:
$13,176North Carolina:
$14,754
Total itemized deductions: $19,963 (21% of AGI, reported on 40.4% of returns )Here:
$19,963State:
$19,464
Here:
20.6% of AGIState:
22.7% of AGI
(% of AGI for various income ranges: 13.2% for AGIs below $10k , 9.6% for AGIs $10k-25k , 14.1% for AGIs $25k-50k , 17.6% for AGIs $50k-75k , 18.6% for AGIs $75k-100k , 14.0% for AGIs over 100k ) Charity contributions deductions: $4,445 (4% of AGI, reported on 35.8% of returns )Here:
4.3% of AGIState:
4.5% of AGI
(% of AGI for various income ranges: 0.8% for AGIs below $10k , 1.4% for AGIs $10k-25k , 2.1% for AGIs $25k-50k , 2.9% for AGIs $50k-75k , 3.3% for AGIs $75k-100k , 3.5% for AGIs over 100k ) Total tax: $8,796 (reported on 75.3% of returns )(% of AGI for various income ranges: 2.7% for AGIs below $10k , 3.9% for AGIs $10k-25k , 6.2% for AGIs $25k-50k , 8.2% for AGIs $50k-75k , 9.8% for AGIs $75k-100k , 18.4% for AGIs over 100k ) Earned income credit: $1,702 (reported on 15.0% of returns )Percentage of individuals using paid preparers for their 2004 taxes: 59.6%(% for various income ranges: 52.8% for AGIs below $10k , 61.1% for AGIs $10k-25k , 60.1% for AGIs $25k-50k , 62.7% for AGIs $50k-75k , 59.0% for AGIs $75k-100k , 63.7% for AGIs over 100k )
Estimated median household income in 2022: This zip code:
$67,033North Carolina:
$67,481
Nearest zip codes: 27217 ,
27249 ,
27201 ,
27215 ,
27214 ,
27301 .
Glen Raven Zip Code Map
Percentage of family households: This zip code:
44.5%North Carolina:
46.1%
Percentage of households with unmarried partners: This zip code:
3.2%North Carolina:
47.9%
Likely homosexual households (counted as self-reported same-sex unmarried-partner households)
Lesbian couples: 0.0% of all households Gay men: 0.0% of all households
Household received Food Stamps/SNAP in the past 12 months: 302Household did not receive Food Stamps/SNAP in the past 12 months: 4,813
Women who had a birth in the past 12 months: 113 (51 now married , 59 unmarried) Women who did not have a birth in the past 12 months: 4,996 (1,111 now married , 3,863 unmarried)
Housing units in zip code 27244 with a mortgage: 2,393 (307
second mortgage , 7
home equity loan , 304
both second mortgage and home equity loan )
Houses without a mortgage: 107
Median monthly owner costs for units with a mortgage: $1,436
Median monthly owner costs for units without a mortgage: $438
Residents with income below the poverty level in 2022:
This zip code:
17.4%Whole state:
12.8%
Residents with income below 50% of the poverty level in 2022:
This zip code:
5.6%Whole state:
6.8%
Median number of rooms in houses and condos: Median number of rooms in apartments: Notable locations in this zip code not listed on our city pages
Click to draw/clear zip code borders Churches in zip code 27244 include: (A) , Bera Church (B) , Browns Arbor Church (C) , Riverside Church (D) , Fairview Church (E) , Freedom Church (F) , Gilliam Church (G) . Display/hide their locations on the map
Streams, rivers, and creeks: (A) , Tickle Creek (B) , Reedy Fork (C) , Grays Branch (D) . Display/hide their locations on the map
Parks in zip code 27244 include: (1) , Morgan Place Park (2) . Display/hide their locations on the map
Tourist attraction (not listed on the city page) : (1) . Display/hide its approximate location on the map
Year house built (houses)
0 2020 or later1,054 2010 to 20191,288 2000 to 2009852 1990 to 1999845 1980 to 1989737 1970 to 1979189 1960 to 1969409 1950 to 1959151 1940 to 1949216 1939 or earlier
Zip code 27244 household income distribution in 2022 345 Less than $10,000216 $10,000 to $14,999144 $15,000 to $19,999319 $20,000 to $24,999336 $25,000 to $29,99998 $30,000 to $34,999271 $35,000 to $39,999141 $40,000 to $44,99985 $45,000 to $49,999420 $50,000 to $59,999425 $60,000 to $74,999541 $75,000 to $99,999530 $100,000 to $124,999216 $125,000 to $149,999701 $150,000 to $199,999337 $200,000 or moreEstimate of home value of owner-occupied houses/condos in 2022 in zip code 27244 195 Less than $10,00010 $30,000 to $34,9998 $40,000 to $49,9999 $50,000 to $59,99916 $60,000 to $69,99934 $70,000 to $79,99990 $80,000 to $89,99941 $90,000 to $99,999186 $100,000 to $124,999157 $125,000 to $149,999143 $150,000 to $174,999331 $175,000 to $199,999451 $200,000 to $249,999408 $250,000 to $299,999819 $300,000 to $399,999565 $400,000 to $499,999125 $500,000 to $749,99954 $750,000 to $999,99937 $1,000,000 to $1,499,99991 $1,500,000 to $1,999,999Rent paid by renters in 2022 in zip code 27244 3 $200 to $249107 $250 to $29935 $350 to $39988 $400 to $44931 $450 to $49987 $500 to $5498 $550 to $59948 $600 to $64991 $650 to $69922 $700 to $74992 $750 to $79969 $800 to $89928 $900 to $99969 $1,000 to $1,249112 $1,250 to $1,499147 $1,500 to $1,999228 $2,000 to $2,49912 $3,000 to $3,49962 No cash rent
Median gross rent in 2022: $1,000.
Estimated median house (or condo) value in 2022 for: White Non-Hispanic householders: $341,826Black or African American householders: $236,199American Indian or Alaska Native householders: $1,658,707Asian householders: $46,443Some other race householders: $145,966Two or more races householders: $99,522Hispanic or Latino householders: $147,293Estimated median house or condo value in 2022: $281,317
27244:
$281,317North Carolina:
$280,600
Lower value quartile - upper value quartile: $178,406 - $419,965
Mean price in 2022: Detached houses: $330,766Here:
$330,766State:
$375,326
Townhouses or other attached units: $260,657Here:
$260,657State:
$317,935
Mobile homes: $92,853Here:
$92,853State:
$124,933
Housing units in structures:
One, detached: 4,180One, attached: 210Two: 923 or 4: 1595 to 9: 15110 to 19: 6820 to 49: 17850 or more: 34Mobile homes: 708Unemployment : 3.5%
Means of transportation to work in zip code 27244 71.1% 4,911 Drove a car alone5.6% 387 Carpooled6.9% 474 Walked0.2% 11 Other means16.6% 1,147 Worked at homeTravel time to work (commute) in zip code 27244 294 Less than 5 minutes635 5 to 9 minutes778 10 to 14 minutes718 15 to 19 minutes873 20 to 24 minutes524 25 to 29 minutes494 30 to 34 minutes230 35 to 39 minutes347 40 to 44 minutes537 45 to 59 minutes153 60 to 89 minutes163 90 or more minutes
Percentage of zip code residents living and working in this county: 66.6%
Household type by relationship:
Households: 16,443
Male householders: 2,876 (621 living alone ), Female householders: 2,266 (588 living alone )2,694 spouses (2,683 opposite-sex spouses ), 170 unmarried partners , (170 opposite-sex unmarried partners ), 3,026 children (2,882 natural , 31 adopted , 114 stepchildren ), 294 grandchildren , 77 brothers or sisters , 108 parents , 0 foster children , 24 other relatives , 1,196 non-relatives In group quarters: 3,570 (-1 institutionalized population )
Size of family households: 1,582 2-persons , 711 3-persons , 611 4-persons , 234 5-persons , 105 6-persons , 11 7-or-more-persons
Size of nonfamily households: 1,210 1-person , 274 2-persons , 318 3-persons , 17 4-persons , 16 5-persons , 40 6-persons
1,847 married couples with children. single-parent households (98 men , 143 women ).
93.9% of residents of 27244 zip code speak English at home. of residents speak Spanish at home (46% very well, 54% well ).of residents speak other Indo-European language at home (75% very well, 25% well ).of residents speak Asian or Pacific Island language at home (96% very well, 4% well ).
Foreign born population: 634 (3.9%)
(56.8%
of them are naturalized citizens )
This zip code:
3.9%Whole state:
8.6%
30% Azores Islands 17% Burma (Myanmar) 17% Bhutan 12% Honduras 9% Sweden 4% India 3% Nepal 16% English 15% German 9% American 6% Italian 5% Irish 4% Scotch-Irish 2% Scottish
Year of entry for the foreign-born population
309 2010 or later 36 2000 to 2009 114 1990 to 1999 302 Before 1990
Facilities with environmental interests located in this zip code:
ALAMANCE-BURLINGTON SCHOOL SYSTEM (2832 NORTH NC 87 in ELON COLLEGE, NC)
STATE MASTER (North Carolina facility info) - -115DA4YG00M29W84AX3X85KYEK, WASTEWATER FACILITY STATE MASTER (North Carolina facility info) - UNDERGROUND STORAGE TANK PROGRAM National Pollutant Discharge Elimination System NON-MAJOR (Tracking pollutant discharge elimination systems) - permit Business SIC classification: ELEMENTARY AND SECONDARY SCHOOLS; NONCLASSIFIABLE ESTABLISHMENTSAlternative names: ALAMANCE CO SCH-ALTAMAHAW-OSSI, ALAMANCE BURLINGTON SCH SYS AL, ALTAMAHAW-OSSIPEE ELEMENTARY, ALTAMAHAW/OSSIPEE ELEMENTARY S
ALAMANCE-BURLINGTON SCHOOL SYSTEM (1731 NC HIGHWAY 87 NORTH in ELON COLLEGE, NC)
STATE MASTER (North Carolina facility info) - -115DA4YG00M29W84AX3X83R8FN, WASTEWATER FACILITY National Pollutant Discharge Elimination System NON-MAJOR (Tracking pollutant discharge elimination systems) - permit Business SIC classification: ELEMENTARY AND SECONDARY SCHOOLSAlternative names: ALAMANCE CO SCH-W ALAMANCE HS, ALAMANCE BURLINGTON SCH SYS W, WESTERN ALAMANCE HS
BLACKWELL'S REST HOME WATER SYS (TUCKER ST in ELON COLLEGE, NC)
(Integrated Compliance Information System) - ICIS-04-2000-0539, FORMAL ENFORCEMENT ACTION Business SIC classification: WATER SUPPLY
Housing units lacking complete plumbing facilities: 1.4%
Housing units lacking complete kitchen facilities: 1.9%
49.1% Electricity 37.8% Utility gas 8.4% Bottled, tank, or LP gas 1.6% Wood 1.5% Other fuel 1.4% Fuel oil, kerosene, etc.
Population in 1990: 10,269. Population change in the 1990s: +493 (+4.8%).
Place of birth for U.S.-born residents:
This state: 7,816Northeast: 3,002Midwest: 1,445South: 3,048West: 414
48% of the 27244 zip code residents lived in the same house 5 years ago.
Out of people who lived in different houses, 35% lived in this county.
Out of people who lived in different counties, 50% lived in North Carolina.
92% of the 27244 zip code residents lived in the same house 1 year ago.
Out of people who lived in different houses, 21% moved from this county.
Out of people who lived in different houses, 57% moved from different county within same state.
Out of people who lived in different houses, 31% moved from different state.
Private vs. public school enrollment:
Students in private schools in grades 1 to 8 (elementary and middle school): 85
Here:
7.5%North Carolina:
13.8%
Students in private schools in grades 9 to 12 (high school): 77
Here:
10.0%North Carolina:
11.9%
Students in private undergraduate colleges: 4,198
Here:
85.1%North Carolina:
19.3%
Occupation by median earnings in the past 12 months ($)
110,966 Computer and mathematical occupations 99,140 Management occupations 60,989 Health diagnosing and treating practitioners and other technical occupations 58,096 Production occupations 52,878 Life, physical, and social science occupations 52,605 Business and financial operations occupations
Companies with federal contracts located in this zip code:
ELON COLLEGE (101 W HAGGARD AVE in ELON, NC) in 7 contracts from 2003 to 2005
Contracts for Educational Services, Tuition, Registration, and Membership Fees by Army, Air ForceSigned by year: 2000: $0; 2001: $0; 2002: $0; 2003: $179,365; 2004: $107,705; 2005: $255,495; 2006: $0.
Biggest contracts: with Army for Educational Services. Signed on 2003-06-20. Completion date: 2003-06-20.
, same as above. Signed on 2005-08-05. Completion date: 2005-08-05.
, same as above. Signed on 2004-04-13. Completion date: 2004-04-13.
, same as above. Signed on 2004-07-19. Completion date: 2004-07-19.
Top industries in this zip code by the number of employees in 2005:
Educational Services: Colleges, Universities, and Professional Schools (over 1000 employees: 1 establishment)Accommodation and Food Services: Food Service Contractors (100-249: 1, 20-49: 1)Other Services (except Public Administration): Religious Organizations (20-49: 1, 10-19: 2, 5-9: 3, 1-4: 7)Accommodation and Food Services: Limited-Service Restaurants (20-49: 2, 10-19: 1)Health Care and Social Assistance: Other Residential Care Facilities (50-99: 1)Accommodation and Food Services: Full-Service Restaurants (20-49: 1, 10-19: 1, 5-9: 2)Health Care and Social Assistance: Offices of Physicians (except Mental Health Specialists) (20-49: 1, 5-9: 1, 1-4: 1)
People in group quarters in 2010:
2,755 people in college/university student housing
151 people in local jails and other municipal confinement facilities
22 people in group homes intended for adults
People in group quarters in 2000:
1,874 people in college dormitories (includes college quarters off campus)
43 people in other noninstitutional group quarters
42 people in local jails and other confinement facilities (including police lockups)
28 people in residential treatment centers for emotionally disturbed children
11 people in homes for the physically handicapped
Fatal accident statistics in 2013:
Fatal accident count: 4Vehicles involved in fatal accidents: 8Fatal accidents caused by drunken drivers: 0Fatalities: 6Persons involved in fatal accidents: 11Pedestrians involved in fatal accidents: 0
Fatal accident statistics in 2011:
Fatal accident count: 1Vehicles involved in fatal accidents: 2Fatal accidents caused by drunken drivers: 0Fatalities: 1Persons involved in fatal accidents: 4Pedestrians involved in fatal accidents: 0
Home Mortgage Disclosure Act Aggregated Statistics For Year 2009(Based on 10 partial tracts) A) FHA, FSA/RHS & VA B) Conventional C) Refinancings D) Home Improvement Loans F) Non-occupant Loans on G) Loans On Manufactured Number Average Value Number Average Value Number Average Value Number Average Value Number Average Value Number Average Value
LOANS ORIGINATED 77 $143,119 102 $155,017 355 $163,291 11 $67,041 27 $153,316 5 $51,078 APPLICATIONS APPROVED, NOT ACCEPTED 5 $127,712 5 $248,376 29 $143,182 1 $196,640 1 $77,000 0 $0 APPLICATIONS DENIED 18 $139,621 18 $130,845 141 $140,150 12 $57,288 7 $109,287 5 $84,962 APPLICATIONS WITHDRAWN 8 $129,048 18 $165,655 86 $151,867 3 $74,863 2 $92,110 1 $224,980 FILES CLOSED FOR INCOMPLETENESS 3 $94,307 4 $294,900 16 $146,618 1 $167,950 0 $0 0 $0
Aggregated Statistics For Year 2008(Based on 10 partial tracts) A) FHA, FSA/RHS & VA B) Conventional C) Refinancings D) Home Improvement Loans F) Non-occupant Loans on G) Loans On Manufactured Number Average Value Number Average Value Number Average Value Number Average Value Number Average Value Number Average Value
LOANS ORIGINATED 69 $147,036 170 $152,783 215 $138,746 21 $51,432 72 $122,125 8 $68,444 APPLICATIONS APPROVED, NOT ACCEPTED 3 $148,243 11 $170,529 37 $128,446 1 $44,410 6 $148,142 2 $49,835 APPLICATIONS DENIED 14 $149,122 15 $93,725 155 $135,671 18 $69,447 10 $143,464 13 $82,302 APPLICATIONS WITHDRAWN 12 $140,621 30 $150,837 77 $146,838 5 $134,956 5 $131,806 5 $93,420 FILES CLOSED FOR INCOMPLETENESS 1 $164,820 6 $163,158 12 $139,080 2 $69,580 1 $114,750 0 $0
Aggregated Statistics For Year 2007(Based on 10 partial tracts) A) FHA, FSA/RHS & VA B) Conventional C) Refinancings D) Home Improvement Loans E) Loans on Dwellings For 5+ Families F) Non-occupant Loans on G) Loans On Manufactured Number Average Value Number Average Value Number Average Value Number Average Value Number Average Value Number Average Value Number Average Value
LOANS ORIGINATED 46 $141,655 300 $140,894 209 $127,332 22 $44,034 2 $5,820,630 67 $103,308 7 $83,233 APPLICATIONS APPROVED, NOT ACCEPTED 1 $79,250 32 $146,431 61 $136,341 7 $57,373 0 $0 14 $102,494 2 $23,635 APPLICATIONS DENIED 6 $118,213 61 $121,040 232 $131,899 37 $52,036 2 $48,900 27 $98,626 17 $85,416 APPLICATIONS WITHDRAWN 3 $171,750 32 $152,675 76 $137,385 10 $100,083 0 $0 14 $125,482 3 $88,817 FILES CLOSED FOR INCOMPLETENESS 0 $0 5 $139,032 22 $153,182 2 $32,600 0 $0 2 $118,425 0 $0
Aggregated Statistics For Year 2006(Based on 10 partial tracts) A) FHA, FSA/RHS & VA B) Conventional C) Refinancings D) Home Improvement Loans E) Loans on Dwellings For 5+ Families F) Non-occupant Loans on G) Loans On Manufactured Number Average Value Number Average Value Number Average Value Number Average Value Number Average Value Number Average Value Number Average Value
LOANS ORIGINATED 51 $121,067 351 $113,787 303 $104,407 26 $56,647 1 $1,044,220 122 $98,646 21 $83,097 APPLICATIONS APPROVED, NOT ACCEPTED 8 $128,956 36 $109,794 50 $102,094 8 $30,656 0 $0 17 $111,382 6 $73,067 APPLICATIONS DENIED 9 $112,049 83 $85,462 265 $120,693 38 $56,951 0 $0 46 $93,922 35 $70,835 APPLICATIONS WITHDRAWN 9 $118,942 33 $112,508 86 $118,986 8 $111,068 0 $0 17 $89,714 4 $80,990 FILES CLOSED FOR INCOMPLETENESS 0 $0 11 $102,192 51 $134,515 2 $16,300 0 $0 3 $70,653 1 $34,160
Aggregated Statistics For Year 2005(Based on 10 partial tracts) A) FHA, FSA/RHS & VA B) Conventional C) Refinancings D) Home Improvement Loans E) Loans on Dwellings For 5+ Families F) Non-occupant Loans on G) Loans On Manufactured Number Average Value Number Average Value Number Average Value Number Average Value Number Average Value Number Average Value Number Average Value
LOANS ORIGINATED 40 $129,586 287 $120,761 275 $113,999 38 $54,563 5 $3,017,684 82 $99,248 18 $76,754 APPLICATIONS APPROVED, NOT ACCEPTED 1 $69,160 30 $92,699 56 $92,598 11 $47,046 0 $0 7 $70,201 6 $54,785 APPLICATIONS DENIED 9 $73,024 64 $92,587 244 $116,732 32 $39,191 0 $0 13 $82,608 38 $62,669 APPLICATIONS WITHDRAWN 9 $137,111 48 $118,942 130 $132,750 13 $90,221 0 $0 11 $94,929 4 $93,460 FILES CLOSED FOR INCOMPLETENESS 2 $56,395 3 $85,207 28 $145,001 2 $77,345 0 $0 0 $0 2 $63,315
Aggregated Statistics For Year 2004(Based on 10 partial tracts) A) FHA, FSA/RHS & VA B) Conventional C) Refinancings D) Home Improvement Loans E) Loans on Dwellings For 5+ Families F) Non-occupant Loans on G) Loans On Manufactured Number Average Value Number Average Value Number Average Value Number Average Value Number Average Value Number Average Value Number Average Value
LOANS ORIGINATED 33 $114,943 276 $116,945 317 $120,343 32 $41,515 1 $1,027,850 79 $91,472 17 $56,308 APPLICATIONS APPROVED, NOT ACCEPTED 1 $106,280 26 $79,587 51 $107,916 4 $60,780 0 $0 2 $95,905 8 $62,101 APPLICATIONS DENIED 11 $109,402 59 $87,308 277 $114,079 27 $44,237 0 $0 7 $66,394 46 $70,975 APPLICATIONS WITHDRAWN 4 $125,310 47 $132,678 110 $114,815 10 $74,386 0 $0 5 $88,330 8 $93,711 FILES CLOSED FOR INCOMPLETENESS 4 $82,972 7 $151,916 19 $138,177 2 $75,520 0 $0 2 $66,830 3 $80,453
Aggregated Statistics For Year 2003(Based on 10 partial tracts) A) FHA, FSA/RHS & VA B) Conventional C) Refinancings D) Home Improvement Loans F) Non-occupant Loans on Number Average Value Number Average Value Number Average Value Number Average Value Number Average Value
LOANS ORIGINATED 34 $118,746 221 $128,377 721 $120,144 13 $26,871 65 $97,316 APPLICATIONS APPROVED, NOT ACCEPTED 1 $195,960 29 $91,838 79 $116,975 5 $51,072 6 $88,467 APPLICATIONS DENIED 3 $115,547 94 $72,877 206 $106,911 16 $35,062 5 $71,874 APPLICATIONS WITHDRAWN 10 $118,544 35 $128,556 137 $116,106 4 $37,540 7 $71,210 FILES CLOSED FOR INCOMPLETENESS 2 $44,010 7 $150,284 9 $88,589 0 $0 0 $0
Aggregated Statistics For Year 2002(Based on 10 partial tracts) A) FHA, FSA/RHS & VA B) Conventional C) Refinancings D) Home Improvement Loans E) Loans on Dwellings For 5+ Families F) Non-occupant Loans on Number Average Value Number Average Value Number Average Value Number Average Value Number Average Value Number Average Value
LOANS ORIGINATED 36 $117,062 221 $119,267 439 $119,720 16 $21,956 1 $1,965,600 60 $94,803 APPLICATIONS APPROVED, NOT ACCEPTED 1 $87,060 42 $87,396 61 $92,345 4 $26,578 0 $0 3 $59,803 APPLICATIONS DENIED 5 $91,202 86 $59,537 176 $98,069 16 $16,260 0 $0 4 $58,220 APPLICATIONS WITHDRAWN 2 $79,435 29 $130,976 80 $102,911 7 $55,310 0 $0 2 $70,665 FILES CLOSED FOR INCOMPLETENESS 1 $88,820 6 $132,542 17 $115,652 0 $0 0 $0 2 $58,335
Aggregated Statistics For Year 2001(Based on 10 partial tracts) A) FHA, FSA/RHS & VA B) Conventional C) Refinancings D) Home Improvement Loans F) Non-occupant Loans on Number Average Value Number Average Value Number Average Value Number Average Value Number Average Value
LOANS ORIGINATED 44 $105,492 214 $104,277 408 $114,994 16 $18,408 40 $78,398 APPLICATIONS APPROVED, NOT ACCEPTED 1 $102,330 48 $64,646 55 $89,747 4 $30,458 2 $79,630 APPLICATIONS DENIED 1 $102,120 113 $59,499 140 $80,856 17 $20,206 12 $41,441 APPLICATIONS WITHDRAWN 2 $141,975 31 $78,103 72 $88,255 3 $23,007 3 $75,860 FILES CLOSED FOR INCOMPLETENESS 0 $0 4 $132,325 18 $95,728 0 $0 1 $26,400
Aggregated Statistics For Year 2000(Based on 10 partial tracts) A) FHA, FSA/RHS & VA B) Conventional C) Refinancings D) Home Improvement Loans F) Non-occupant Loans on Number Average Value Number Average Value Number Average Value Number Average Value Number Average Value
LOANS ORIGINATED 30 $100,598 212 $101,684 148 $89,932 16 $19,829 27 $69,357 APPLICATIONS APPROVED, NOT ACCEPTED 16 $36,770 61 $50,479 41 $75,040 12 $18,493 0 $0 APPLICATIONS DENIED 18 $67,482 162 $48,289 108 $77,895 26 $16,261 7 $59,974 APPLICATIONS WITHDRAWN 7 $67,131 21 $81,343 60 $69,980 2 $25,180 1 $42,810 FILES CLOSED FOR INCOMPLETENESS 0 $0 1 $141,210 13 $93,960 1 $38,440 0 $0
Aggregated Statistics For Year 1999(Based on 5 partial tracts) A) FHA, FSA/RHS & VA B) Conventional C) Refinancings D) Home Improvement Loans F) Non-occupant Loans on Number Average Value Number Average Value Number Average Value Number Average Value Number Average Value
LOANS ORIGINATED 16 $102,963 111 $92,372 121 $89,651 12 $35,682 19 $62,288 APPLICATIONS APPROVED, NOT ACCEPTED 0 $0 27 $52,353 34 $77,811 4 $31,375 3 $74,393 APPLICATIONS DENIED 1 $142,540 91 $51,631 71 $65,031 7 $18,704 4 $52,475 APPLICATIONS WITHDRAWN 3 $99,847 14 $91,383 40 $73,287 1 $85,310 0 $0 FILES CLOSED FOR INCOMPLETENESS 0 $0 1 $95,820 13 $67,510 0 $0 0 $0
Private Mortgage Insurance Companies Aggregated Statistics For Year 2009(Based on 10 partial tracts) A) Conventional B) Refinancings Number Average Value Number Average Value
LOANS ORIGINATED 14 $187,077 17 $199,976 APPLICATIONS APPROVED, NOT ACCEPTED 2 $312,080 7 $262,026 APPLICATIONS DENIED 5 $206,836 1 $84,170 APPLICATIONS WITHDRAWN 0 $0 2 $96,170 FILES CLOSED FOR INCOMPLETENESS 0 $0 1 $131,190
Aggregated Statistics For Year 2008(Based on 10 partial tracts) A) Conventional B) Refinancings C) Non-occupant Loans on Number Average Value Number Average Value Number Average Value
LOANS ORIGINATED 48 $166,898 17 $191,465 5 $103,046 APPLICATIONS APPROVED, NOT ACCEPTED 13 $194,975 9 $225,342 0 $0 APPLICATIONS DENIED 0 $0 2 $189,250 1 $57,120 APPLICATIONS WITHDRAWN 0 $0 0 $0 0 $0 FILES CLOSED FOR INCOMPLETENESS 0 $0 1 $45,770 0 $0
Aggregated Statistics For Year 2007(Based on 10 partial tracts) A) Conventional B) Refinancings C) Non-occupant Loans on Number Average Value Number Average Value Number Average Value
LOANS ORIGINATED 99 $145,526 27 $175,474 13 $119,234 APPLICATIONS APPROVED, NOT ACCEPTED 14 $140,356 8 $142,898 5 $111,026 APPLICATIONS DENIED 2 $71,550 0 $0 0 $0 APPLICATIONS WITHDRAWN 6 $162,055 3 $186,493 2 $128,770 FILES CLOSED FOR INCOMPLETENESS 1 $100,790 0 $0 0 $0
Aggregated Statistics For Year 2006(Based on 10 partial tracts) A) Conventional B) Refinancings C) Non-occupant Loans on Number Average Value Number Average Value Number Average Value
LOANS ORIGINATED 61 $130,803 17 $141,939 20 $96,424 APPLICATIONS APPROVED, NOT ACCEPTED 1 $271,490 3 $131,890 0 $0 APPLICATIONS DENIED 1 $121,870 0 $0 0 $0 APPLICATIONS WITHDRAWN 3 $138,430 0 $0 2 $71,720 FILES CLOSED FOR INCOMPLETENESS 0 $0 0 $0 0 $0
Aggregated Statistics For Year 2005(Based on 10 partial tracts) A) Conventional B) Refinancings C) Non-occupant Loans on Number Average Value Number Average Value Number Average Value
LOANS ORIGINATED 48 $135,437 25 $157,899 8 $112,480 APPLICATIONS APPROVED, NOT ACCEPTED 3 $147,083 7 $151,276 2 $58,680 APPLICATIONS DENIED 1 $78,570 0 $0 0 $0 APPLICATIONS WITHDRAWN 2 $133,505 3 $95,843 0 $0 FILES CLOSED FOR INCOMPLETENESS 0 $0 0 $0 0 $0
Aggregated Statistics For Year 2004(Based on 10 partial tracts) A) Conventional B) Refinancings C) Non-occupant Loans on Number Average Value Number Average Value Number Average Value
LOANS ORIGINATED 51 $131,830 28 $131,692 11 $84,295 APPLICATIONS APPROVED, NOT ACCEPTED 5 $142,894 13 $145,556 0 $0 APPLICATIONS DENIED 0 $0 2 $172,710 0 $0 APPLICATIONS WITHDRAWN 2 $209,405 3 $123,487 1 $94,660 FILES CLOSED FOR INCOMPLETENESS 0 $0 0 $0 0 $0
Aggregated Statistics For Year 2003(Based on 10 partial tracts) A) Conventional B) Refinancings C) Non-occupant Loans on Number Average Value Number Average Value Number Average Value
LOANS ORIGINATED 63 $133,036 108 $137,766 6 $99,815 APPLICATIONS APPROVED, NOT ACCEPTED 7 $149,014 28 $148,083 1 $45,480 APPLICATIONS DENIED 0 $0 0 $0 0 $0 APPLICATIONS WITHDRAWN 0 $0 5 $92,082 0 $0 FILES CLOSED FOR INCOMPLETENESS 0 $0 2 $91,860 0 $0
Aggregated Statistics For Year 2002(Based on 10 partial tracts) A) Conventional B) Refinancings C) Non-occupant Loans on Number Average Value Number Average Value Number Average Value
LOANS ORIGINATED 73 $134,939 81 $132,220 5 $89,406 APPLICATIONS APPROVED, NOT ACCEPTED 6 $101,472 13 $136,901 0 $0 APPLICATIONS DENIED 2 $82,360 2 $111,580 0 $0 APPLICATIONS WITHDRAWN 2 $178,520 2 $129,010 0 $0 FILES CLOSED FOR INCOMPLETENESS 0 $0 2 $143,440 0 $0
Aggregated Statistics For Year 2001(Based on 10 partial tracts) A) Conventional B) Refinancings C) Non-occupant Loans on Number Average Value Number Average Value Number Average Value
LOANS ORIGINATED 66 $117,866 60 $133,386 4 $92,768 APPLICATIONS APPROVED, NOT ACCEPTED 8 $120,975 13 $131,926 1 $53,220 APPLICATIONS DENIED 1 $122,620 3 $165,837 0 $0 APPLICATIONS WITHDRAWN 3 $143,463 0 $0 0 $0 FILES CLOSED FOR INCOMPLETENESS 1 $156,980 1 $171,730 0 $0
Aggregated Statistics For Year 2000(Based on 10 partial tracts) A) Conventional B) Refinancings C) Non-occupant Loans on Number Average Value Number Average Value Number Average Value
LOANS ORIGINATED 59 $129,470 13 $120,863 6 $74,237 APPLICATIONS APPROVED, NOT ACCEPTED 6 $140,200 2 $77,900 1 $62,850 APPLICATIONS DENIED 2 $101,750 2 $119,865 0 $0 APPLICATIONS WITHDRAWN 1 $202,290 0 $0 0 $0 FILES CLOSED FOR INCOMPLETENESS 0 $0 0 $0 0 $0
Aggregated Statistics For Year 1999(Based on 5 partial tracts) A) Conventional B) Refinancings C) Non-occupant Loans on Number Average Value Number Average Value Number Average Value
LOANS ORIGINATED 28 $119,802 10 $113,399 1 $54,700 APPLICATIONS APPROVED, NOT ACCEPTED 2 $104,705 1 $172,880 0 $0 APPLICATIONS DENIED 3 $107,110 1 $78,500 0 $0 APPLICATIONS WITHDRAWN 0 $0 1 $104,960 0 $0 FILES CLOSED FOR INCOMPLETENESS 0 $0 0 $0 0 $0
2002 - 2018 National Fire Incident Reporting System (NFIRS) incidents See full 2006 National Fire Incident Reporting System statistics for zip code 27244, North Carolina
Most common first names in zip code 27244 among deceased individuals Name Count Lived (average)
William 72 71.7 years James 68 72.1 years John 56 73.5 years Mary 53 79.6 years Robert 42 75.0 years George 27 75.1 years Charles 23 74.8 years Charlie 22 75.6 years Thomas 21 66.4 years Margaret 20 74.5 years
Most common last names in zip code 27244 among deceased individuals Last name Count Lived (average)
Jones 27 75.2 years Smith 27 70.6 years Simmons 26 76.4 years Barber 24 77.4 years Simpson 24 77.2 years Somers 23 78.9 years Gerringer 21 75.1 years Moore 20 73.9 years Walker 19 74.2 years Page 18 79.6 years
Businesses in zip code 27244
Chick-Fil-A: 1Domino's Pizza: 1U-Haul: 1
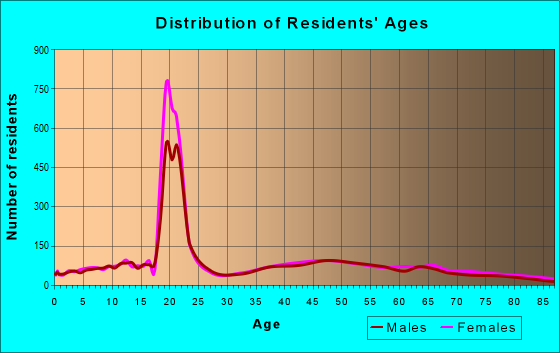


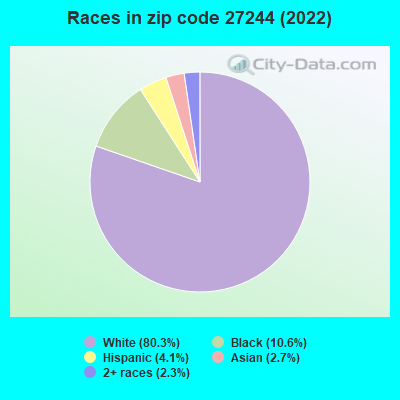


 Nearest zip codes: 27217, 27249, 27201, 27215, 27214, 27301.
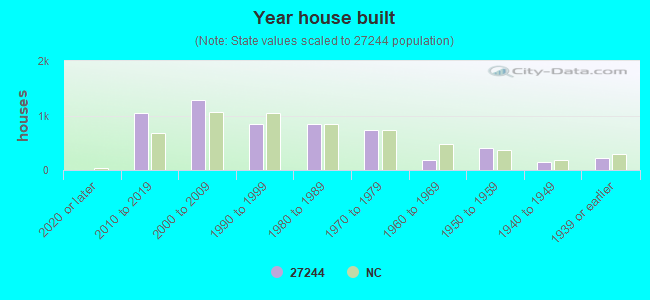


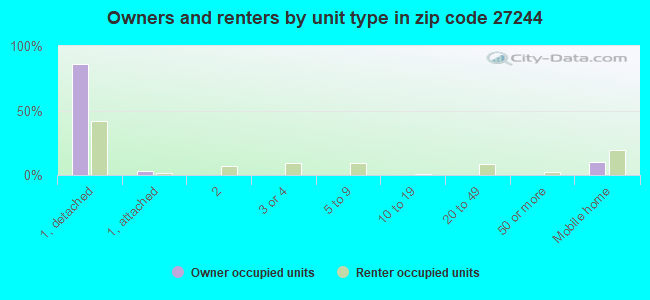
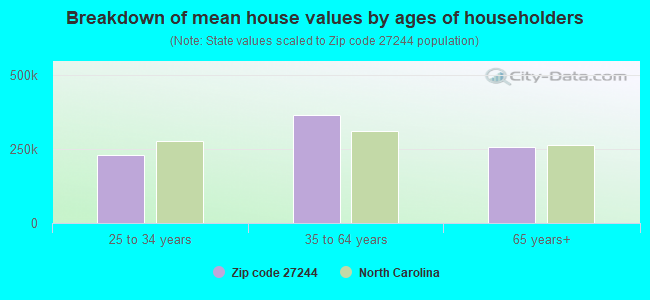


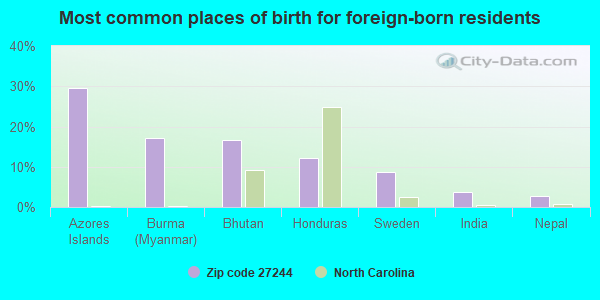
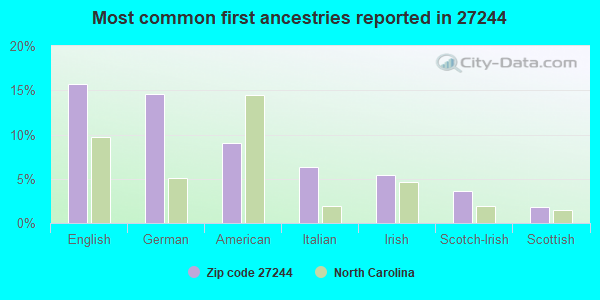
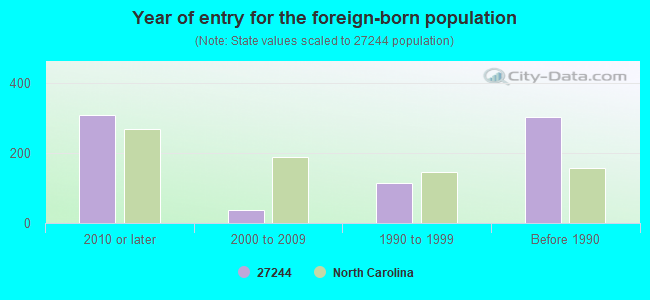


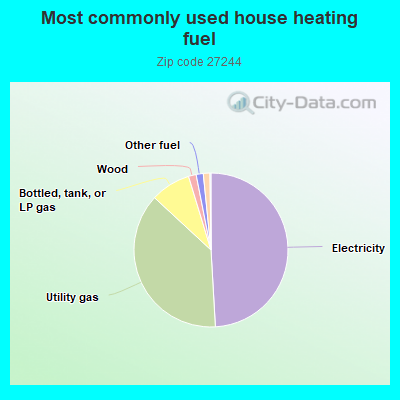
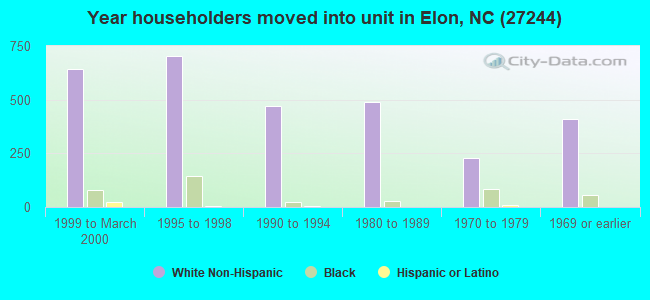
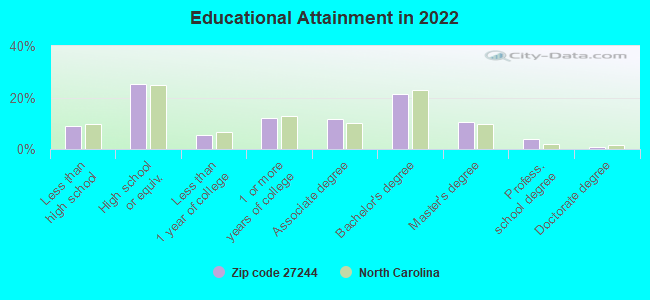
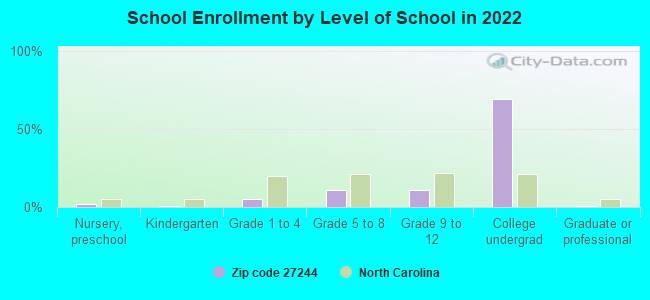
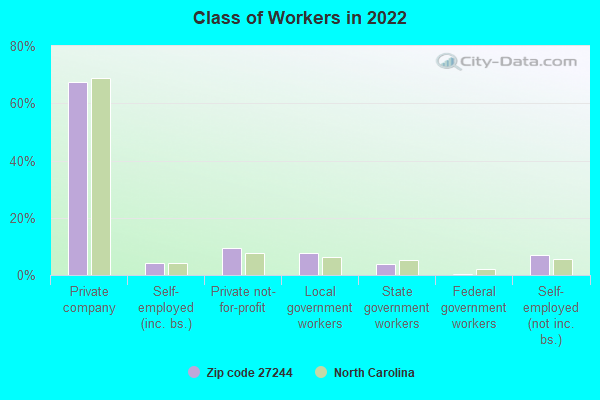
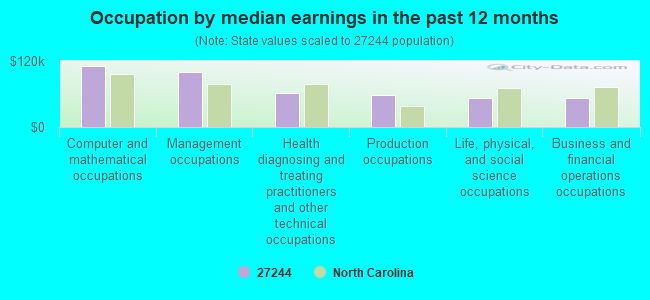
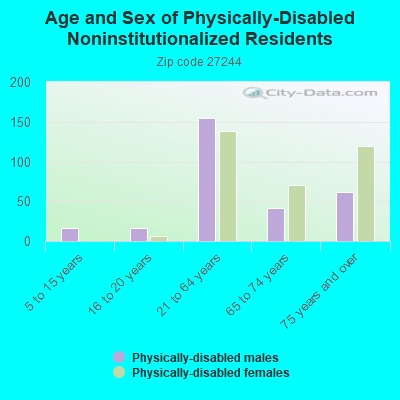
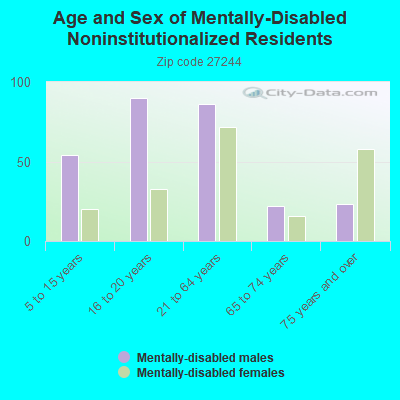
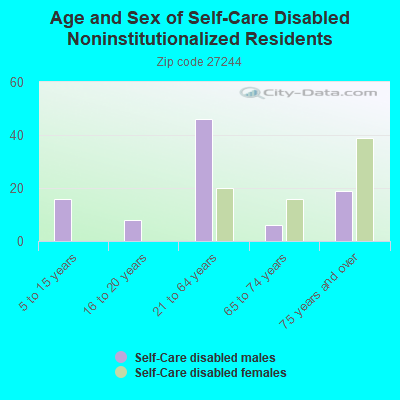
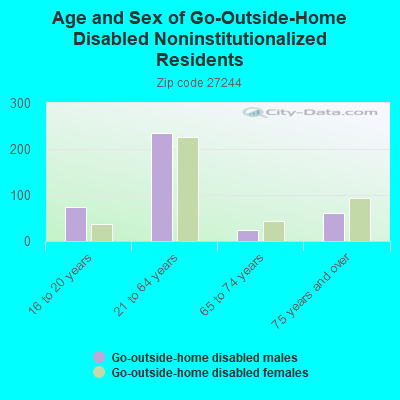
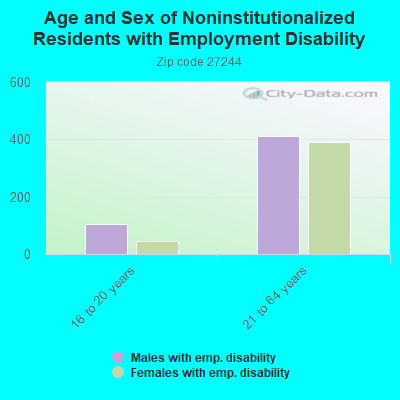
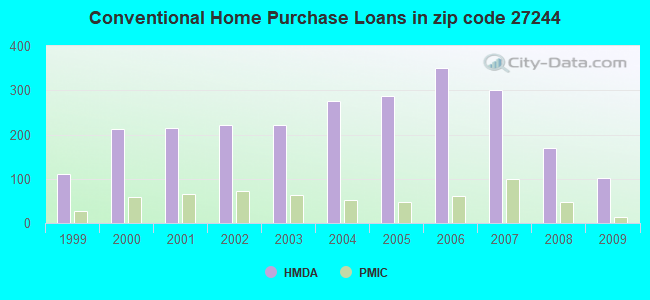
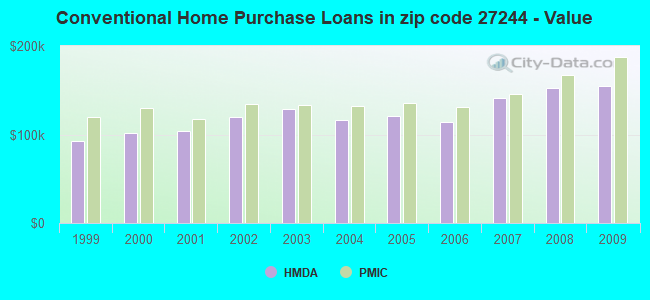
 Based on the data from the years 2002 - 2018 the average number of fires per year is 60. The highest number of fire incidents - 93 took place in 2011, and the least - 28 in 2002. The data has a growing trend.
 When looking into fire subcategories, the most incidents belonged to: Structure Fires (47.3%), and Outside Fires (36.6%).