Estimated zip code population in 2022: 10,122 Zip code population in 2010: 8,536 Zip code population in 2000: 7,179
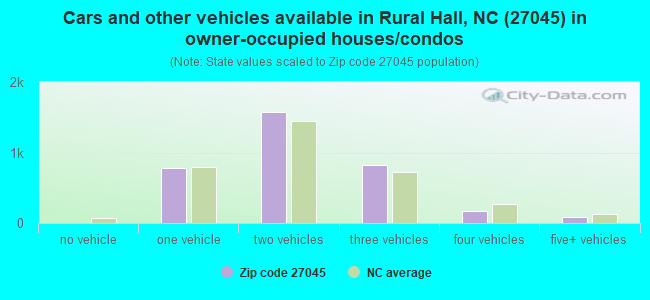
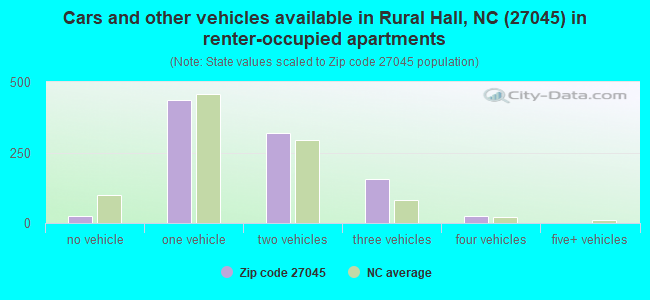
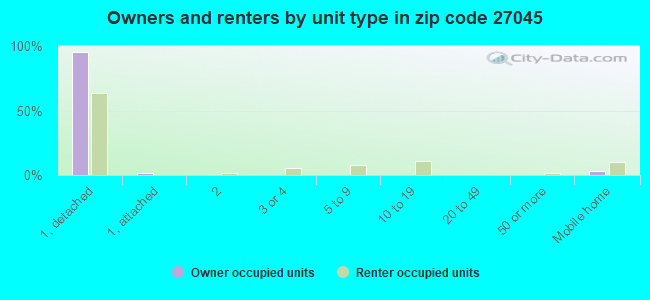
Houses and condos: 4,683 Renter-occupied apartments: 955
% of renters here:
22%
State:
33%
March 2022 cost of living index in zip code 27045: 88.0 (less than average, U.S. average is 100)
Land area: 23.2 sq. mi. Water area: 0.1 sq. mi.
Population density: 437 people per square mile
(low).
OSM Map
General Map
Google Map
MSN Map
OSM Map
General Map
Google Map
MSN Map
OSM Map
General Map
Google Map
MSN Map
OSM Map
General Map
Google Map
MSN Map
Please wait while loading the map...
Real estate property taxes paid for housing units in 2022:
This zip code:
0.7% ($1,423)
North Carolina:
0.6% ($1,769)
Median real estate property taxes paid for housing units with mortgages in 2022: $1,482 (0.7%) Median real estate property taxes paid for housing units with no mortgage in 2022: $1,311 (0.7%)
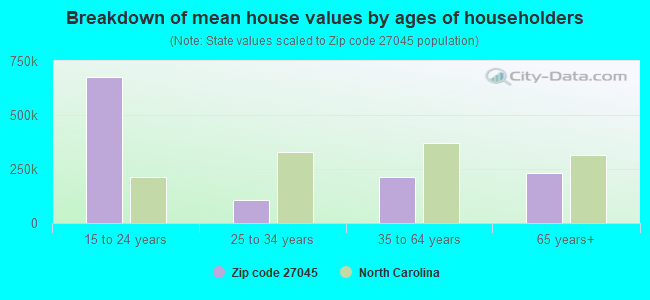
Estimated median house/condo value in 2022: $202,715
27045:
$202,715
North Carolina:
$280,600
According to our research of North Carolina and other state lists, there were 17 registered sex offenders living in 27045 zip code as of June 01, 2024. The ratio of all residents to sex offenders in zip code 27045 is 529 to 1. The ratio of registered sex offenders to all residents in this zip code is near the state average.
Median resident age:
This zip code:
42.4 years
North Carolina median age:
39.2 years
Average household size:
This zip code:
2.3 people
North Carolina:
2.4 people
Averages for the 2020 tax year for zip code 27045, filed in 2021:
Average Adjusted Gross Income (AGI) in 2020: $52,118 (Individual Income Tax Returns)
Here:
$52,118
State:
$70,020
Salary/wage: $46,856 (reported on 82.0% of returns)
Here:
$46,856
State:
$58,387
(% of AGI for various income ranges: 1074.9% for AGIs below $25k, 3691.5% for AGIs $25k-50k, 6540.2% for AGIs $50k-75k, 9579.7% for AGIs $75k-100k, 17449.0% for AGIs $100k-200k, 69045.0% for AGIs over 200k)
Taxable interest for individuals: $963 (reported on 26.0% of returns)
This zip code:
$963
North Carolina:
$1,479
(% of AGI for various income ranges: 9.7% for AGIs below $25k, 21.3% for AGIs $25k-50k, 33.3% for AGIs $50k-75k, 79.4% for AGIs $75k-100k, 84.8% for AGIs $100k-200k, 840.0% for AGIs over 200k)
Ordinary dividends: $4,594 (reported on 13.1% of returns)
Here:
$4,594
State:
$7,888
(% of AGI for various income ranges: 20.7% for AGIs below $25k, 35.3% for AGIs $25k-50k, 56.7% for AGIs $50k-75k, 105.8% for AGIs $75k-100k, 282.1% for AGIs $100k-200k, 3995.0% for AGIs over 200k)
Net capital gain/loss in AGI: +$5,944 (reported on 11.0% of returns)
Here:
+$5,944
State:
+$23,652
(% of AGI for various income ranges: 2.7% for AGIs below $25k, 15.0% for AGIs $25k-50k, 73.6% for AGIs $50k-75k, 115.5% for AGIs $75k-100k, 495.2% for AGIs $100k-200k, 3835.0% for AGIs over 200k)
Profit/loss from business: +$8,121 (reported on 14.5% of returns)
Here:
+$8,121
State:
+$11,710
(% of AGI for various income ranges: 129.0% for AGIs below $25k, 67.6% for AGIs $25k-50k, 130.3% for AGIs $50k-75k, 162.7% for AGIs $75k-100k, 734.5% for AGIs $100k-200k)
Taxable individual retirement arrangement distribution: $16,904 (reported on 9.6% of returns)
27045:
$16,904
North Carolina:
$20,247
(% of AGI for various income ranges: 45.3% for AGIs below $25k, 104.3% for AGIs $25k-50k, 222.1% for AGIs $50k-75k, 357.3% for AGIs $75k-100k, 1299.7% for AGIs $100k-200k)
Total itemized deductions: $28,996 (reported on 5.1% of returns)
Here:
$28,996
State:
$34,549
(% of AGI for various income ranges: 135.8% for AGIs $25k-50k, 184.1% for AGIs $50k-75k, 495.8% for AGIs $75k-100k, 665.5% for AGIs $100k-200k, 5605.0% for AGIs over 200k)
Charity contributions: $11,121 (reported on 3.9% of returns)
Here:
$11,121
State:
$13,360
(% of AGI for various income ranges: 23.0% for AGIs $25k-50k, 55.5% for AGIs $50k-75k, 81.8% for AGIs $75k-100k, 227.6% for AGIs $100k-200k, 3040.0% for AGIs over 200k)
Taxes paid: $5,668 (reported on 5.1% of returns)
27045:
$5,668
State:
$7,586
(% of AGI for various income ranges: 16.4% for AGIs $25k-50k, 29.3% for AGIs $50k-75k, 80.3% for AGIs $75k-100k, 191.7% for AGIs $100k-200k, 1230.0% for AGIs over 200k)
Earned income credit: $2,279 (reported on 19.4% of returns)
Here:
$2,279
State:
$2,337
(% of AGI for various income ranges: 109.9% for AGIs below $25k, 72.9% for AGIs $25k-50k)
Percentage of individuals using paid preparers for their 2020 taxes: 94.3%
Here:
94%
State:
93%
(% for various income ranges: 93.7% for AGIs below $25k, 94.3% for AGIs $25k-50k, 95.1% for AGIs $50k-75k, 93.8% for AGIs $75k-100k, 94.3% for AGIs $100k-200k, 100.0% for AGIs over 200k)
Averages for the 2012 tax year for zip code 27045, filed in 2013:
Average Adjusted Gross Income (AGI) in 2012: $46,524 (Individual Income Tax Returns)
Here:
$46,524
State:
$54,937
Salary/wage: $41,036 (reported on 82.3% of returns)
Here:
$41,036
State:
$46,336
(% of AGI for various income ranges: 69.7% for AGIs below $25k, 77.3% for AGIs $25k-50k, 74.4% for AGIs $50k-75k, 74.5% for AGIs $75k-100k, 71.9% for AGIs $100k-200k, 56.8% for AGIs over 200k)
Taxable interest for individuals: $930 (reported on 32.7% of returns)
This zip code:
$930
North Carolina:
$1,298
(% of AGI for various income ranges: 1.1% for AGIs below $25k, 0.6% for AGIs $25k-50k, 0.5% for AGIs $50k-75k, 0.9% for AGIs $75k-100k, 0.6% for AGIs $100k-200k, 0.4% for AGIs over 200k)
Ordinary dividends: $3,949 (reported on 17.4% of returns)
Here:
$3,949
State:
$6,213
(% of AGI for various income ranges: 1.3% for AGIs below $25k, 0.8% for AGIs $25k-50k, 1.3% for AGIs $50k-75k, 1.6% for AGIs $75k-100k, 2.0% for AGIs $100k-200k, 2.3% for AGIs over 200k)
Net capital gain/loss in AGI: +$2,375 (reported on 13.0% of returns)
Here:
+$2,375
State:
+$12,740
(% of AGI for various income ranges: 0.7% for AGIs $50k-75k, 1.0% for AGIs $75k-100k, 0.8% for AGIs $100k-200k, 1.9% for AGIs over 200k)
Profit/loss from business: +$7,502 (reported on 14.5% of returns)
Here:
+$7,502
State:
+$10,311
(% of AGI for various income ranges: 5.9% for AGIs below $25k, 3.0% for AGIs $25k-50k, 1.7% for AGIs $50k-75k, 1.3% for AGIs $75k-100k, 2.3% for AGIs $100k-200k)
Taxable individual retirement arrangement distribution: $13,317 (reported on 12.8% of returns)
27045:
$13,317
North Carolina:
$15,575
(% of AGI for various income ranges: 4.0% for AGIs below $25k, 2.5% for AGIs $25k-50k, 3.0% for AGIs $50k-75k, 3.5% for AGIs $75k-100k, 6.5% for AGIs $100k-200k)
Total itemized deductions: $18,738 (24% of AGI, reported on 34.2% of returns)
Here:
$18,738
State:
$23,438
Here:
23.9% of AGI
State:
21.5% of AGI
(% of AGI for various income ranges: 11.1% for AGIs below $25k, 12.3% for AGIs $25k-50k, 13.6% for AGIs $50k-75k, 14.6% for AGIs $75k-100k, 15.3% for AGIs $100k-200k, 14.8% for AGIs over 200k)
Charity contributions: $4,107 (reported on 29.5% of returns)
Here:
$4,107
State:
$4,687
(% of AGI for various income ranges: 0.9% for AGIs below $25k, 2.0% for AGIs $25k-50k, 2.7% for AGIs $50k-75k, 2.9% for AGIs $75k-100k, 3.3% for AGIs $100k-200k, 3.5% for AGIs over 200k)
Taxes paid: $6,076 (reported on 34.2% of returns)
27045:
$6,076
State:
$8,823
(% of AGI for various income ranges: 1.3% for AGIs below $25k, 2.8% for AGIs $25k-50k, 3.9% for AGIs $50k-75k, 5.2% for AGIs $75k-100k, 6.5% for AGIs $100k-200k, 6.9% for AGIs over 200k)
Earned income credit: $2,213 (reported on 20.4% of returns)
Here:
$2,213
State:
$2,376
(% of AGI for various income ranges: 7.0% for AGIs below $25k, 1.2% for AGIs $25k-50k)
Percentage of individuals using paid preparers for their 2012 taxes: 55.8%
Here:
56%
State:
53%
(% for various income ranges: 53.5% for AGIs below $25k, 54.3% for AGIs $25k-50k, 58.5% for AGIs $50k-75k, 57.1% for AGIs $75k-100k, 63.6% for AGIs $100k-200k, 60.0% for AGIs over 200k)
Averages for the 2004 tax year for zip code 27045, filed in 2005:
Average Adjusted Gross Income (AGI) in 2004: $42,015 (Individual Income Tax Returns)
Here:
$42,015
State:
$45,376
Salary/wage: $38,218 (reported on 84.5% of returns)
Here:
$38,218
State:
$39,442
(% of AGI for various income ranges: 79.0% for AGIs below $10k, 74.6% for AGIs $10k-25k, 77.8% for AGIs $25k-50k, 81.9% for AGIs $50k-75k, 82.0% for AGIs $75k-100k, 67.5% for AGIs over 100k)
Taxable interest for individuals: $1,190 (reported on 42.2% of returns)
This zip code:
$1,190
North Carolina:
$1,515
(% of AGI for various income ranges: 5.0% for AGIs below $10k, 1.9% for AGIs $10k-25k, 1.3% for AGIs $25k-50k, 1.1% for AGIs $50k-75k, 0.7% for AGIs $75k-100k, 1.0% for AGIs over 100k)
Taxable dividends: $2,364 (reported on 22.9% of returns)
Here:
$2,364
State:
$4,016
(% of AGI for various income ranges: 3.4% for AGIs below $10k, 0.9% for AGIs $10k-25k, 1.2% for AGIs $25k-50k, 0.6% for AGIs $50k-75k, 0.6% for AGIs $75k-100k, 2.6% for AGIs over 100k)
Net capital gain/loss: +$9,211 (reported on 14.8% of returns)
Here:
+$9,211
State:
+$11,152
(% of AGI for various income ranges: -2.3% for AGIs below $10k, 0.6% for AGIs $10k-25k, 0.4% for AGIs $25k-50k, 0.5% for AGIs $50k-75k, 1.8% for AGIs $75k-100k, 11.5% for AGIs over 100k)
Profit/loss from business: +$8,418 (reported on 14.3% of returns)
Here:
+$8,418
State:
+$9,490
(% of AGI for various income ranges: 15.1% for AGIs below $10k, 4.2% for AGIs $10k-25k, 3.1% for AGIs $25k-50k, 1.0% for AGIs $50k-75k, 2.1% for AGIs $75k-100k, 3.5% for AGIs over 100k)
IRA payment deduction: $2,736 (reported on 2.0% of returns)
27045:
$2,736
North Carolina:
$2,967
(% of AGI for various income ranges: 0.1% for AGIs $10k-25k, 0.2% for AGIs $25k-50k, 0.2% for AGIs $50k-75k, 0.1% for AGIs $75k-100k, 0.1% for AGIs over 100k)
Self-employed pension: $15,750 (reported on 0.3% of returns)
Here:
$15,750
North Carolina:
$14,754
Total itemized deductions: $15,801 (23% of AGI, reported on 40.4% of returns)
Here:
$15,801
State:
$19,464
Here:
23.0% of AGI
State:
22.7% of AGI
(% of AGI for various income ranges: 9.2% for AGIs below $10k, 9.2% for AGIs $10k-25k, 15.2% for AGIs $25k-50k, 16.2% for AGIs $50k-75k, 17.3% for AGIs $75k-100k, 15.7% for AGIs over 100k)
Charity contributions deductions: $3,707 (5% of AGI, reported on 36.0% of returns)
Here:
$3,707
State:
$4,035
Here:
5.2% of AGI
State:
4.5% of AGI
(% of AGI for various income ranges: 0.9% for AGIs below $10k, 1.5% for AGIs $10k-25k, 2.6% for AGIs $25k-50k, 3.1% for AGIs $50k-75k, 3.7% for AGIs $75k-100k, 4.3% for AGIs over 100k)
Total tax: $5,338 (reported on 73.9% of returns)
27045:
$5,338
State:
$7,257
(% of AGI for various income ranges: 3.1% for AGIs below $10k, 3.4% for AGIs $10k-25k, 6.4% for AGIs $25k-50k, 8.3% for AGIs $50k-75k, 10.1% for AGIs $75k-100k, 16.0% for AGIs over 100k)
Earned income credit: $1,731 (reported on 17.0% of returns)
Here:
$1,731
State:
$1,851
Percentage of individuals using paid preparers for their 2004 taxes: 62.6%
Here:
63%
State:
62%
(% for various income ranges: 54.6% for AGIs below $10k, 67.1% for AGIs $10k-25k, 61.5% for AGIs $25k-50k, 65.2% for AGIs $50k-75k, 62.8% for AGIs $75k-100k, 64.6% for AGIs over 100k)
Likely homosexual households (counted as self-reported same-sex unmarried-partner households)
Lesbian couples: 0.0% of all households
Gay men: 0.2% of all households
Household received Food Stamps/SNAP in the past 12 months: 349 Household did not receive Food Stamps/SNAP in the past 12 months: 3,998
Women who had a birth in the past 12 months: 128 (67 now married, 59 unmarried) Women who did not have a birth in the past 12 months: 2,348 (1,161 now married, 1,189 unmarried)
Housing units in zip code 27045 with a mortgage: 2,265 (464 second mortgage, 365 both second mortgage and home equity loan) Houses without a mortgage: 147
Median monthly owner costs for units with a mortgage: $1,164 Median monthly owner costs for units without a mortgage: $393
Residents with income below the poverty level in 2022:
This zip code:
8.3%
Whole state:
12.8%
Residents with income below 50% of the poverty level in 2022:
This zip code:
4.4%
Whole state:
6.8%
Median number of rooms in houses and condos:
Here:
5.8
State:
6.4
Median number of rooms in apartments:
Here:
5.4
State:
4.4
Notable locations in this zip code not listed on our city pages
Churches in zip code 27045 include: Jefferson Church (A), Antioch Church (B), Mizpah Church (C), Nazareth Church (D), Oak Grove Church (E), Saint James Church (F). Display/hide their locations on the map
Cemeteries: Banner Cemetery (1), Montview Memorial Park (2), Flint Cemetery (3), Carmichael Cemetery (4), Griffin Cemetery (5), Sullivan Cemetery (6). Display/hide their locations on the map
Streams, rivers, and creeks: Beaver Dam Creek (A), Barkers Creek (B), Trick-Um Creek (C), Rough Fork (D), Paynes Branch (E), Parkers Creek (F), Lucy Branch (G), Leak Branch (H). Display/hide their locations on the map
In group quarters: 3 (-1 institutionalized population)
Size of family households: 1,642 2-persons, 836 3-persons, 272 4-persons, 82 5-persons, 65 6-persons, 35 7-or-more-persons
Size of nonfamily households: 1,157 1-person, 284 2-persons, 13 3-persons
1,051 married couples with children.
625 single-parent households (157 men, 468 women).
96.6% of residents of 27045 zip code speak English at home.
2.4% of residents speak Spanish at home (100% very well).
0.6% of residents speak other Indo-European language at home (100% very well).
Foreign born population: 161 (1.6%) (41.0% of them are naturalized citizens)
This zip code:
1.6%
Whole state:
8.6%
27%Honduras
22%Barbados
16%Switzerland
12%North Macedonia (Macedonia)
10%Scotland
7%Colombia
4%Greece
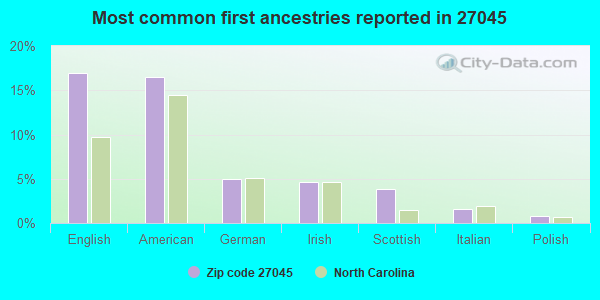
17%English
16%American
5%German
5%Irish
4%Scottish
2%Italian
1%Polish
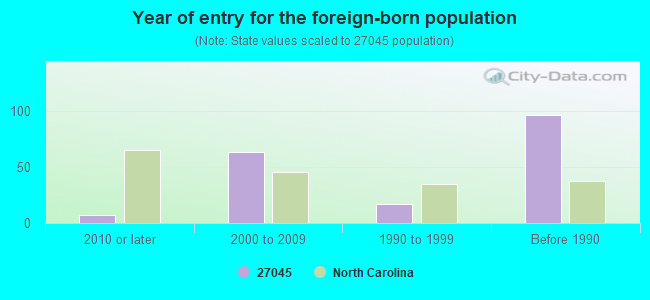
Year of entry for the foreign-born population
72010 or later
632000 to 2009
171990 to 1999
96Before 1990
Facilities with environmental interests located in this zip code:
ALUMINUM PRODUCTS COMPANY (645 MONTROYAL ROAD in RURAL HALL, NC)
STATE MASTER (North Carolina facility info) - UNDERGROUND STORAGE TANK PROGRAM Conditionally Exempt Small Quantity Generators, less than 100 kg/month of hazardous waste (Resource Conservation and Recovery Act (tracking hazardous waste)) - notification Business SIC classification: NONCLASSIFIABLE ESTABLISHMENTS Organizations: JOHN ELLISON (CONTACT/OWNER)
DUKE POWER RUAL HALL GARAGE & OPS CTR (8700 CIRCLE DR in RURAL HALL, NC)
STATE MASTER (North Carolina facility info) - UNDERGROUND STORAGE TANK PROGRAM Conditionally Exempt Small Quantity Generators, less than 100 kg/month of hazardous waste (Resource Conservation and Recovery Act (tracking hazardous waste)) - notification Business SIC classification: NONCLASSIFIABLE ESTABLISHMENTS Organizations: DUKE POWER COMPANY (CONTACT/OWNER)
Alternative names: RURAL HALL GARAGE
BRADY FURNITURE (8250 DEPOT STREET in RURAL HALL, NC)
STATE MASTER (North Carolina facility info) - UNDERGROUND STORAGE TANK PROGRAM CRITERIA AND HAZARDOUS AIR POLLUTANT INVENTORY (Inventory of air pollution sources) Business SIC classification: WOOD HOUSEHOLD FURNITURE, EXCEPT UPHOLSTERED; NONCLASSIFIABLE ESTABLISHMENTS
CHESAPEAKE DISPLAY RURAL HALL (300 FORUM PARKWAY in RURAL HALL, NC)
Conditionally Exempt Small Quantity Generators, less than 100 kg/month of hazardous waste (Resource Conservation and Recovery Act (tracking hazardous waste)) - notification Conditionally Exempt Small Quantity Generators, less than 100 kg/month of hazardous waste (Resource Conservation and Recovery Act (tracking hazardous waste)) - notification Organizations: FORSYTH PARTNERS (CONTACT/OWNER)
, HIGHWOODS PROPERTIES (CONTACT/OWNER)
Alternative names: CHESAPEAKE DISPLAY & PACKING
CRITERIA AND HAZARDOUS AIR POLLUTANT INVENTORY (Inventory of air pollution sources) TRI REPORTER (Tracking of toxic chemicals releasing facilities) Business SIC classification: STEAM, GAS, AND HYDRAULIC TURBINES, AND TURBINE GENERATOR SET UNITS
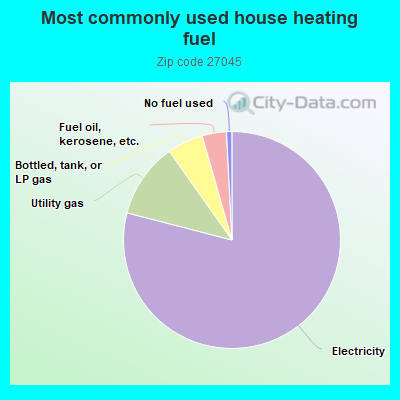
78.4%Electricity
11.1%Utility gas
5.3%Bottled, tank, or LP gas
3.6%Fuel oil, kerosene, etc.
0.8%No fuel used
Population in 1990: 6,635. Population change in the 1990s: +544 (+8.2%).
Place of birth for U.S.-born residents:
This state: 6,699
Northeast: 407
Midwest: 353
South: 2,189
West: 200
68% of the 27045 zip code residents lived in the same house 5 years ago. Out of people who lived in different houses, 67% lived in this county. Out of people who lived in different counties, 50% lived in North Carolina.
92% of the 27045 zip code residents lived in the same house 1 year ago. Out of people who lived in different houses, 44% moved from this county. Out of people who lived in different houses, 17% moved from different county within same state. Out of people who lived in different houses, 39% moved from different state. Out of people who lived in different houses, 2% moved from abroad.
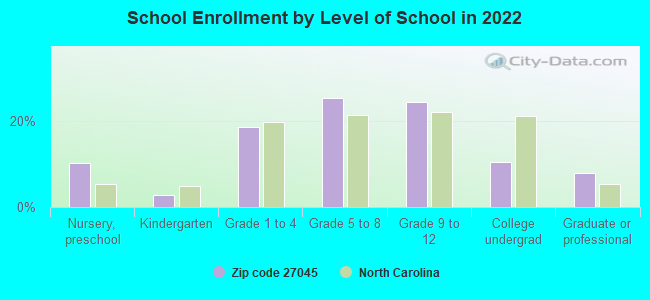
Private vs. public school enrollment:
Students in private schools in grades 1 to 8 (elementary and middle school): 119
Here:
12.4%
North Carolina:
13.8%
Students in private schools in grades 9 to 12 (high school): 66
Here:
12.6%
North Carolina:
11.9%
Students in private undergraduate colleges: 60
Here:
26.3%
North Carolina:
19.3%
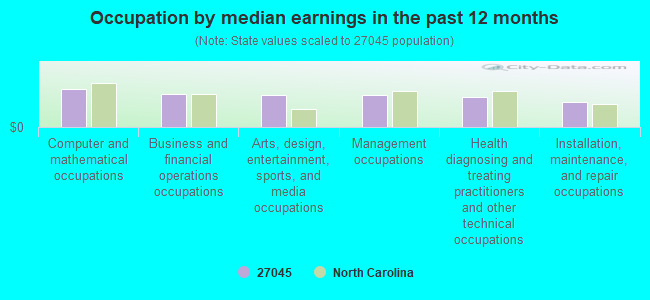
Occupation by median earnings in the past 12 months ($)
88,218Computer and mathematical occupations
75,119Business and financial operations occupations
73,801Arts, design, entertainment, sports, and media occupations
73,628Management occupations
68,143Health diagnosing and treating practitioners and other technical occupations
56,346Installation, maintenance, and repair occupations
Companies with federal contracts located in this zip code:
IMAGING AFFILIATES INC (320 FORUM PARKWAY in RURAL HALL, NC; small business) : $75,255 in 4 contractsfrom 2000 to 2006
$27,855 with Department of Veterans Affairs for X-Ray Equipment and Supplies: Medical, Dental, Veterinary. Signed on 2003-04-15. Completion date: 2003-06-15.
$26,000 with Department of Veterans Affairs for Medical and Surgical Instruments, Equipment, and Supplies. Signed on 2000-09-15. Completion date: 2000-09-15.
$16,000 with Air Force for Medical and Surgical Instruments, Equipment, and Supplies. Signed on 2005-03-14. Completion date: 2005-04-19.
$5,400, same as above.Signed on 2006-01-13. Completion date: 2006-01-14.
ROBERT H WAGER CO INC (570 MONTROYAL RD in RURAL HALL, NC; small business) : $24,180 in 7 contractsfrom 2004 to 2005
Contracts for Electric Portable and Hand Lighting Equipment, Indoor and Outdoor Electric Lighting Fixtures, In Vitro Diagnostic Substances, Reagents, Test Kits, and Sets, Motor Vehicle Maintenance and Repair Shop Specialized Equipment, and moreby Navy, Air Force, Army Signed by year:2000: $0; 2001: $0; 2002: $0; 2003: $0; 2004: $16,535; 2005: $7,645; 2006: $0.
Biggest contracts:
$6,520 with Navy for Electric Portable and Hand Lighting Equipment. Signed on 2004-03-02. Completion date: 2004-03-05.
$6,182 with Navy for Indoor and Outdoor Electric Lighting Fixtures. Signed on 2004-08-30. Completion date: 2004-09-20.
$4,467 with Air Force for In Vitro Diagnostic Substances, Reagents, Test Kits, and Sets. Signed on 2005-09-21. Completion date: 2005-11-02.
$3,832 with Army for Motor Vehicle Maintenance and Repair Shop Specialized Equipment. Signed on 2004-09-02. Completion date: 2004-09-17.
Top industries in this zip code by the number of employees in 2005:
Construction: Power and Communication Line and Related Structures Construction (250-499 employees: 1 establishment)
Professional, Scientific, and Technical Services: Other Accounting Services (250-499: 1)
Management of Companies and Enterprises: Corporate, Subsidiary, and Regional Managing Offices (100-249: 1, 50-99: 1)
Administrative and Support and Waste Management and Remediation Services: Packaging and Labeling Services (100-249: 1)
Health Care and Social Assistance: Residential Mental Retardation Facilities (100-249: 1)
Professional, Scientific, and Technical Services: Process, Physical Distribution, and Logistics Consulting Services (100-249: 1)
Fatal accident statistics in 2014:
Fatal accident count: 2
Vehicles involved in fatal accidents: 7
Fatal accidents caused by drunken drivers: 1
Fatalities: 4
Persons involved in fatal accidents: 13
Pedestrians involved in fatal accidents: 0
Fatal accident statistics in 2010:
Fatal accident count: 1
Vehicles involved in fatal accidents: 1
Fatal accidents caused by drunken drivers: 1
Fatalities: 1
Persons involved in fatal accidents: 1
Pedestrians involved in fatal accidents: 0
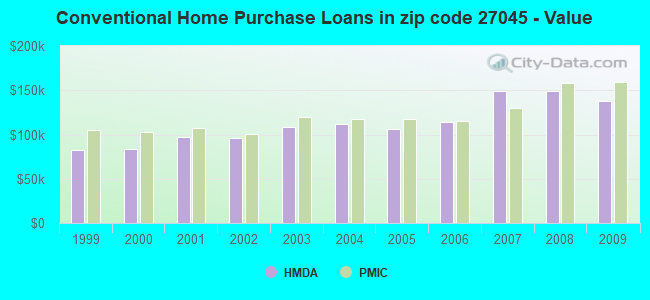
Home Mortgage Disclosure Act Aggregated Statistics For Year 2009 (Based on 4 partial tracts)
A) FHA, FSA/RHS & VA Home Purchase Loans
B) Conventional Home Purchase Loans
C) Refinancings
D) Home Improvement Loans
F) Non-occupant Loans on < 5 Family Dwellings (A B C & D)
G) Loans On Manufactured Home Dwelling (A B C & D)
Number
Average Value
Number
Average Value
Number
Average Value
Number
Average Value
Number
Average Value
Number
Average Value
LOANS ORIGINATED
119
$123,960
90
$137,802
310
$142,951
12
$53,993
20
$129,466
1
$47,070
APPLICATIONS APPROVED, NOT ACCEPTED
7
$142,697
3
$196,370
24
$154,895
1
$4,040
0
$0
2
$87,760
APPLICATIONS DENIED
16
$111,579
10
$135,152
153
$139,222
15
$49,239
7
$114,863
2
$111,995
APPLICATIONS WITHDRAWN
17
$116,430
8
$127,446
89
$161,023
0
$0
0
$0
0
$0
FILES CLOSED FOR INCOMPLETENESS
2
$106,145
9
$144,613
24
$147,698
1
$34,970
1
$162,750
0
$0
Aggregated Statistics For Year 2008 (Based on 4 partial tracts)
A) FHA, FSA/RHS & VA Home Purchase Loans
B) Conventional Home Purchase Loans
C) Refinancings
D) Home Improvement Loans
E) Loans on Dwellings For 5+ Families
F) Non-occupant Loans on < 5 Family Dwellings (A B C & D)
G) Loans On Manufactured Home Dwelling (A B C & D)
Number
Average Value
Number
Average Value
Number
Average Value
Number
Average Value
Number
Average Value
Number
Average Value
Number
Average Value
LOANS ORIGINATED
94
$137,667
147
$149,384
199
$133,201
23
$44,690
5
$160,772
22
$203,275
7
$90,719
APPLICATIONS APPROVED, NOT ACCEPTED
0
$0
12
$126,242
45
$93,592
5
$10,388
0
$0
5
$64,878
4
$77,768
APPLICATIONS DENIED
17
$133,751
21
$114,000
189
$124,276
25
$45,775
0
$0
6
$72,920
4
$72,295
APPLICATIONS WITHDRAWN
11
$116,969
16
$134,172
67
$118,539
1
$52,450
0
$0
3
$86,923
3
$63,663
FILES CLOSED FOR INCOMPLETENESS
0
$0
5
$145,488
10
$161,026
2
$15,880
0
$0
0
$0
0
$0
Aggregated Statistics For Year 2007 (Based on 4 partial tracts)
A) FHA, FSA/RHS & VA Home Purchase Loans
B) Conventional Home Purchase Loans
C) Refinancings
D) Home Improvement Loans
E) Loans on Dwellings For 5+ Families
F) Non-occupant Loans on < 5 Family Dwellings (A B C & D)
G) Loans On Manufactured Home Dwelling (A B C & D)
Number
Average Value
Number
Average Value
Number
Average Value
Number
Average Value
Number
Average Value
Number
Average Value
Number
Average Value
LOANS ORIGINATED
40
$143,319
246
$149,354
202
$106,565
30
$61,270
2
$137,070
43
$108,144
17
$151,756
APPLICATIONS APPROVED, NOT ACCEPTED
1
$205,790
20
$128,750
84
$88,691
6
$21,123
0
$0
13
$78,264
0
$0
APPLICATIONS DENIED
11
$124,707
56
$186,227
278
$119,784
40
$49,181
0
$0
12
$109,247
14
$85,512
APPLICATIONS WITHDRAWN
0
$0
18
$175,893
100
$118,823
5
$86,276
0
$0
3
$74,663
0
$0
FILES CLOSED FOR INCOMPLETENESS
0
$0
8
$353,399
22
$149,515
0
$0
0
$0
0
$0
1
$98,190
Aggregated Statistics For Year 2006 (Based on 4 partial tracts)
A) FHA, FSA/RHS & VA Home Purchase Loans
B) Conventional Home Purchase Loans
C) Refinancings
D) Home Improvement Loans
E) Loans on Dwellings For 5+ Families
F) Non-occupant Loans on < 5 Family Dwellings (A B C & D)
G) Loans On Manufactured Home Dwelling (A B C & D)
Number
Average Value
Number
Average Value
Number
Average Value
Number
Average Value
Number
Average Value
Number
Average Value
Number
Average Value
LOANS ORIGINATED
33
$116,750
307
$114,385
299
$97,352
49
$55,055
4
$2,569,042
42
$95,824
14
$72,814
APPLICATIONS APPROVED, NOT ACCEPTED
2
$68,535
31
$109,098
65
$87,226
3
$36,763
0
$0
6
$86,592
7
$60,223
APPLICATIONS DENIED
3
$138,187
77
$91,103
264
$105,875
52
$46,834
0
$0
9
$55,407
17
$77,548
APPLICATIONS WITHDRAWN
3
$136,150
33
$98,783
108
$115,588
14
$101,990
0
$0
7
$94,079
3
$105,037
FILES CLOSED FOR INCOMPLETENESS
1
$114,330
6
$134,593
35
$95,430
2
$102,805
0
$0
0
$0
0
$0
Aggregated Statistics For Year 2005 (Based on 4 partial tracts)
A) FHA, FSA/RHS & VA Home Purchase Loans
B) Conventional Home Purchase Loans
C) Refinancings
D) Home Improvement Loans
E) Loans on Dwellings For 5+ Families
F) Non-occupant Loans on < 5 Family Dwellings (A B C & D)
G) Loans On Manufactured Home Dwelling (A B C & D)
Number
Average Value
Number
Average Value
Number
Average Value
Number
Average Value
Number
Average Value
Number
Average Value
Number
Average Value
LOANS ORIGINATED
47
$116,363
288
$105,749
342
$92,019
42
$38,757
1
$598,520
57
$85,425
13
$63,829
APPLICATIONS APPROVED, NOT ACCEPTED
0
$0
36
$81,198
57
$92,136
11
$15,020
0
$0
5
$91,304
10
$50,070
APPLICATIONS DENIED
4
$90,700
63
$82,813
288
$101,783
26
$37,244
0
$0
19
$96,157
28
$80,378
APPLICATIONS WITHDRAWN
4
$129,458
38
$98,668
160
$105,880
4
$189,732
3
$3,012,790
14
$94,705
5
$88,700
FILES CLOSED FOR INCOMPLETENESS
1
$154,670
6
$147,658
33
$130,345
0
$0
0
$0
0
$0
2
$61,850
Aggregated Statistics For Year 2004 (Based on 4 partial tracts)
A) FHA, FSA/RHS & VA Home Purchase Loans
B) Conventional Home Purchase Loans
C) Refinancings
D) Home Improvement Loans
F) Non-occupant Loans on < 5 Family Dwellings (A B C & D)
G) Loans On Manufactured Home Dwelling (A B C & D)
Number
Average Value
Number
Average Value
Number
Average Value
Number
Average Value
Number
Average Value
Number
Average Value
LOANS ORIGINATED
27
$121,663
215
$111,411
342
$104,201
26
$31,845
38
$84,285
6
$86,998
APPLICATIONS APPROVED, NOT ACCEPTED
3
$88,320
26
$108,156
56
$88,142
11
$30,634
6
$123,438
7
$28,747
APPLICATIONS DENIED
3
$105,310
42
$87,056
282
$104,285
33
$43,707
11
$99,697
26
$63,708
APPLICATIONS WITHDRAWN
8
$111,859
7
$143,359
113
$93,627
2
$20,895
9
$106,290
1
$111,630
FILES CLOSED FOR INCOMPLETENESS
0
$0
13
$83,538
32
$109,398
0
$0
2
$56,835
0
$0
Aggregated Statistics For Year 2003 (Based on 4 partial tracts)
A) FHA, FSA/RHS & VA Home Purchase Loans
B) Conventional Home Purchase Loans
C) Refinancings
D) Home Improvement Loans
E) Loans on Dwellings For 5+ Families
F) Non-occupant Loans on < 5 Family Dwellings (A B C & D)
Number
Average Value
Number
Average Value
Number
Average Value
Number
Average Value
Number
Average Value
Number
Average Value
LOANS ORIGINATED
44
$108,839
181
$108,533
657
$102,940
19
$15,744
1
$497,650
21
$86,386
APPLICATIONS APPROVED, NOT ACCEPTED
2
$83,580
21
$95,869
76
$98,642
9
$27,954
0
$0
6
$72,488
APPLICATIONS DENIED
5
$93,522
42
$82,296
241
$99,084
24
$17,682
0
$0
3
$101,130
APPLICATIONS WITHDRAWN
2
$84,415
21
$99,863
117
$105,435
2
$50,150
0
$0
1
$90,110
FILES CLOSED FOR INCOMPLETENESS
0
$0
5
$48,476
23
$95,784
0
$0
0
$0
3
$62,407
Aggregated Statistics For Year 2002 (Based on 4 partial tracts)
A) FHA, FSA/RHS & VA Home Purchase Loans
B) Conventional Home Purchase Loans
C) Refinancings
D) Home Improvement Loans
E) Loans on Dwellings For 5+ Families
F) Non-occupant Loans on < 5 Family Dwellings (A B C & D)
Number
Average Value
Number
Average Value
Number
Average Value
Number
Average Value
Number
Average Value
Number
Average Value
LOANS ORIGINATED
56
$106,544
198
$96,541
446
$101,601
23
$12,280
0
$0
40
$80,532
APPLICATIONS APPROVED, NOT ACCEPTED
0
$0
33
$94,280
91
$90,086
8
$11,930
0
$0
2
$48,475
APPLICATIONS DENIED
6
$134,600
68
$79,589
173
$86,651
29
$8,656
1
$297,250
11
$51,745
APPLICATIONS WITHDRAWN
3
$91,937
21
$83,511
68
$90,567
3
$21,200
0
$0
3
$123,140
FILES CLOSED FOR INCOMPLETENESS
3
$114,227
8
$110,928
14
$111,029
0
$0
0
$0
3
$125,173
Aggregated Statistics For Year 2001 (Based on 4 partial tracts)
A) FHA, FSA/RHS & VA Home Purchase Loans
B) Conventional Home Purchase Loans
C) Refinancings
D) Home Improvement Loans
F) Non-occupant Loans on < 5 Family Dwellings (A B C & D)
Number
Average Value
Number
Average Value
Number
Average Value
Number
Average Value
Number
Average Value
LOANS ORIGINATED
59
$100,559
148
$97,574
389
$95,125
26
$13,565
31
$66,074
APPLICATIONS APPROVED, NOT ACCEPTED
0
$0
37
$55,837
73
$86,704
4
$16,348
3
$64,560
APPLICATIONS DENIED
4
$90,788
41
$71,614
168
$78,133
48
$10,653
3
$84,693
APPLICATIONS WITHDRAWN
3
$115,437
8
$85,090
87
$86,401
7
$11,199
0
$0
FILES CLOSED FOR INCOMPLETENESS
0
$0
6
$75,480
14
$90,418
1
$47,070
3
$60,177
Aggregated Statistics For Year 2000 (Based on 4 partial tracts)
A) FHA, FSA/RHS & VA Home Purchase Loans
B) Conventional Home Purchase Loans
C) Refinancings
D) Home Improvement Loans
F) Non-occupant Loans on < 5 Family Dwellings (A B C & D)
Number
Average Value
Number
Average Value
Number
Average Value
Number
Average Value
Number
Average Value
LOANS ORIGINATED
92
$98,055
133
$83,220
139
$71,958
28
$11,845
17
$51,649
APPLICATIONS APPROVED, NOT ACCEPTED
13
$54,922
39
$50,983
51
$73,342
23
$19,441
2
$6,685
APPLICATIONS DENIED
25
$57,573
97
$52,971
150
$63,942
42
$14,073
3
$27,443
APPLICATIONS WITHDRAWN
3
$86,977
18
$78,801
68
$68,674
6
$28,728
1
$127,770
FILES CLOSED FOR INCOMPLETENESS
1
$131,810
1
$181,570
24
$102,020
0
$0
0
$0
Aggregated Statistics For Year 1999 (Based on 2 partial tracts)
A) FHA, FSA/RHS & VA Home Purchase Loans
B) Conventional Home Purchase Loans
C) Refinancings
D) Home Improvement Loans
E) Loans on Dwellings For 5+ Families
F) Non-occupant Loans on < 5 Family Dwellings (A B C & D)
Detailed PMIC statistics for the following Tracts:0028.05
, 0028.07
2002 - 2018 National Fire Incident Reporting System (NFIRS) incidents
Based on the data from the years 2002 - 2018 the average number of fires per year is 77. The highest number of fires - 143 took place in 2004, and the least - 19 in 2003. The data has a dropping trend.
When looking into fire subcategories, the most reports belonged to: Other (33.4%), and Structure Fires (30.6%).
Fire incident types reported to NFIRS in Zip Code 27045

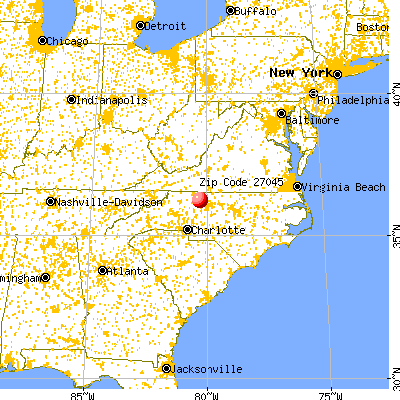


 Nearest zip codes: 27019, 27021, 27106, 27105, 27109, 27050.


 Based on the data from the years 2002 - 2018 the average number of fires per year is 77. The highest number of fires - 143 took place in 2004, and the least - 19 in 2003. The data has a dropping trend.
 When looking into fire subcategories, the most reports belonged to: Other (33.4%), and Structure Fires (30.6%).