Estimated zip code population in 2022: 2,660 Zip code population in 2010: 2,783 Zip code population in 2000: 2,833
Houses and condos: 1,002 Renter-occupied apartments: 76
% of renters here:
9%
State:
26%
March 2022 cost of living index in zip code 25535: 85.2 (less than average, U.S. average is 100)
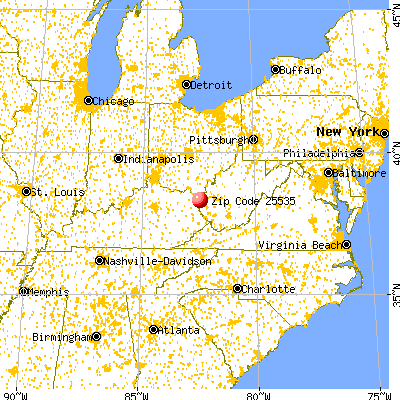
Land area: 17.9 sq. mi. Water area: 0.4 sq. mi.
Population density: 149 people per square mile
(very low).
OSM Map
General Map
Google Map
MSN Map
OSM Map
General Map
Google Map
MSN Map
OSM Map
General Map
Google Map
MSN Map
OSM Map
General Map
Google Map
MSN Map
Please wait while loading the map...
Real estate property taxes paid for housing units in 2022:
This zip code:
0.4% ($900)
West Virginia:
0.5% ($821)
Median real estate property taxes paid for housing units with mortgages in 2022: $942 (0.4%) Median real estate property taxes paid for housing units with no mortgage in 2022: $537 (0.4%)
Business Search- 14 Million verified businesses
Males: 1,537
(57.8%)
Females: 1,120
(42.2%)
For population 25 years and over in 25535:
High school or higher: 101.5%
Bachelor's degree or higher: 41.6%
Graduate or professional degree: 11.8%
Unemployed: 7.2%
Mean travel time to work (commute): 32.8 minutes
For population 15 years and over in 25535:
Never married: 29.1%
Now married: 57.4%
Separated: 0.0%
Widowed: 6.3%
Divorced: 7.2%
Zip code 25535 compared to state average:
Median house value above state average.
Black race population percentage significantly below state average.
Hispanic race population percentage significantly below state average.
Median age below state average.
Foreign-born population percentage significantly below state average.
Renting percentage significantly below state average.
Length of stay since moving in above state average.
House age below state average.
Percentage of population with a bachelor's degree or higher above state average.
Estimated median house/condo value in 2022: $233,927
25535:
$233,927
West Virginia:
$155,100
According to our research of West Virginia and other state lists, there were 3 registered sex offenders living in 25535 zip code as of May 23, 2024. The ratio of all residents to sex offenders in zip code 25535 is 1,015 to 1. The ratio of registered sex offenders to all residents in this zip code is much lower than the state average.
Median resident age:
This zip code:
37.1 years
West Virginia median age:
42.9 years
Average household size:
This zip code:
3.2 people
West Virginia:
2.3 people
Averages for the 2020 tax year for zip code 25535, filed in 2021:
Average Adjusted Gross Income (AGI) in 2020: $62,252 (Individual Income Tax Returns)
Here:
$62,252
State:
$56,292
Salary/wage: $55,942 (reported on 77.9% of returns)
Here:
$55,942
State:
$49,093
(% of AGI for various income ranges: 1049.6% for AGIs below $25k, 3057.0% for AGIs $25k-50k, 5289.1% for AGIs $50k-75k, 8961.2% for AGIs $75k-100k, 14205.5% for AGIs $100k-200k)
Taxable interest for individuals: $1,140 (reported on 31.0% of returns)
This zip code:
$1,140
West Virginia:
$1,141
(% of AGI for various income ranges: 16.8% for AGIs below $25k, 27.8% for AGIs $25k-50k, 40.9% for AGIs $50k-75k, 73.8% for AGIs $75k-100k, 133.6% for AGIs $100k-200k)
Ordinary dividends: $3,271 (reported on 12.4% of returns)
Here:
$3,271
State:
$5,456
(% of AGI for various income ranges: 27.9% for AGIs below $25k, 72.7% for AGIs $50k-75k, 82.5% for AGIs $75k-100k, 110.0% for AGIs $100k-200k)
Net capital gain/loss in AGI: +$2,917 (reported on 10.6% of returns)
Here:
+$2,917
State:
+$11,656
(% of AGI for various income ranges: 81.8% for AGIs $50k-75k, 239.1% for AGIs $100k-200k)
Profit/loss from business: +$19,893 (reported on 13.3% of returns)
Here:
+$19,893
State:
+$12,084
(% of AGI for various income ranges: 163.6% for AGIs below $25k, 204.5% for AGIs $50k-75k, 93.8% for AGIs $75k-100k, 2023.6% for AGIs $100k-200k)
Taxable individual retirement arrangement distribution: $11,567 (reported on 8.0% of returns)
25535:
$11,567
West Virginia:
$15,311
(% of AGI for various income ranges: 48.9% for AGIs below $25k, 119.1% for AGIs $25k-50k, 787.5% for AGIs $75k-100k)
Total itemized deductions: $25,850 (reported on 3.5% of returns)
Here:
$25,850
State:
$31,950
(% of AGI for various income ranges: 940.0% for AGIs $100k-200k)
Charity contributions: $9,267 (reported on 2.7% of returns)
Here:
$9,267
State:
$12,364
(% of AGI for various income ranges: 252.7% for AGIs $100k-200k)
Taxes paid: $7,350 (reported on 3.5% of returns)
25535:
$7,350
State:
$7,665
(% of AGI for various income ranges: 267.3% for AGIs $100k-200k)
Earned income credit: $2,017 (reported on 15.9% of returns)
Here:
$2,017
State:
$2,258
(% of AGI for various income ranges: 82.1% for AGIs below $25k, 57.8% for AGIs $25k-50k)
Percentage of individuals using paid preparers for their 2020 taxes: 90.3%
Here:
90%
State:
93%
(% for various income ranges: 90.0% for AGIs below $25k, 92.6% for AGIs $25k-50k, 86.7% for AGIs $50k-75k, 90.9% for AGIs $75k-100k, 93.3% for AGIs $100k-200k, 80.0% for AGIs over 200k)
Averages for the 2012 tax year for zip code 25535, filed in 2013:
Average Adjusted Gross Income (AGI) in 2012: $53,648 (Individual Income Tax Returns)
Here:
$53,648
State:
$48,628
Salary/wage: $47,941 (reported on 78.3% of returns)
Here:
$47,941
State:
$42,328
(% of AGI for various income ranges: 66.3% for AGIs below $25k, 71.3% for AGIs $25k-50k, 78.8% for AGIs $50k-75k, 74.2% for AGIs $75k-100k, 76.1% for AGIs $100k-200k, 51.3% for AGIs over 200k)
Taxable interest for individuals: $1,074 (reported on 30.4% of returns)
This zip code:
$1,074
West Virginia:
$1,211
(% of AGI for various income ranges: 1.2% for AGIs below $25k, 0.4% for AGIs $25k-50k, 0.8% for AGIs $50k-75k, 0.4% for AGIs $75k-100k, 0.4% for AGIs $100k-200k, 0.7% for AGIs over 200k)
Ordinary dividends: $1,617 (reported on 10.4% of returns)
Here:
$1,617
State:
$4,262
(% of AGI for various income ranges: 0.7% for AGIs below $25k, 0.1% for AGIs $25k-50k, 0.6% for AGIs $50k-75k, 0.5% for AGIs $100k-200k)
Net capital gain/loss in AGI: +$5,391 (reported on 9.6% of returns)
Here:
+$5,391
State:
+$8,875
(% of AGI for various income ranges: 1.3% for AGIs $50k-75k, 3.1% for AGIs $100k-200k)
Profit/loss from business: +$12,407 (reported on 13.0% of returns)
Here:
+$12,407
State:
+$13,636
(% of AGI for various income ranges: 6.8% for AGIs below $25k, 2.9% for AGIs $25k-50k, 2.5% for AGIs $50k-75k, 6.0% for AGIs $100k-200k)
Taxable individual retirement arrangement distribution: $14,270 (reported on 8.7% of returns)
25535:
$14,270
West Virginia:
$11,787
(% of AGI for various income ranges: 2.6% for AGIs below $25k, 3.8% for AGIs $25k-50k, 11.0% for AGIs $75k-100k)
Total itemized deductions: $23,986 (18% of AGI, reported on 18.3% of returns)
Here:
$23,986
State:
$21,148
Here:
17.9% of AGI
State:
18.1% of AGI
(% of AGI for various income ranges: 5.4% for AGIs $25k-50k, 5.6% for AGIs $50k-75k, 6.6% for AGIs $75k-100k, 13.0% for AGIs $100k-200k, 11.6% for AGIs over 200k)
Charity contributions: $4,694 (reported on 13.9% of returns)
Here:
$4,694
State:
$4,508
(% of AGI for various income ranges: 1.3% for AGIs $50k-75k, 1.6% for AGIs $75k-100k, 1.9% for AGIs $100k-200k, 1.6% for AGIs over 200k)
Taxes paid: $8,952 (reported on 18.3% of returns)
25535:
$8,952
State:
$8,103
(% of AGI for various income ranges: 0.8% for AGIs $25k-50k, 1.3% for AGIs $50k-75k, 2.1% for AGIs $75k-100k, 4.8% for AGIs $100k-200k, 6.3% for AGIs over 200k)
Earned income credit: $2,081 (reported on 18.3% of returns)
Here:
$2,081
State:
$2,140
(% of AGI for various income ranges: 6.0% for AGIs below $25k, 1.0% for AGIs $25k-50k)
Percentage of individuals using paid preparers for their 2012 taxes: 53.9%
Here:
54%
State:
49%
(% for various income ranges: 53.3% for AGIs below $25k, 50.0% for AGIs $25k-50k, 50.0% for AGIs $50k-75k, 60.0% for AGIs $75k-100k, 58.3% for AGIs $100k-200k, 75.0% for AGIs over 200k)
Averages for the 2004 tax year for zip code 25535, filed in 2005:
Average Adjusted Gross Income (AGI) in 2004: $38,965 (Individual Income Tax Returns)
Here:
$38,965
State:
$37,498
Salary/wage: $37,145 (reported on 83.0% of returns)
Here:
$37,145
State:
$33,645
(% of AGI for various income ranges: 91.3% for AGIs below $10k, 68.4% for AGIs $10k-25k, 82.6% for AGIs $25k-50k, 81.0% for AGIs $50k-75k, 87.1% for AGIs $75k-100k, 70.7% for AGIs over 100k)
Taxable interest for individuals: $1,477 (reported on 45.7% of returns)
This zip code:
$1,477
West Virginia:
$1,465
(% of AGI for various income ranges: 4.6% for AGIs below $10k, 3.5% for AGIs $10k-25k, 2.1% for AGIs $25k-50k, 1.7% for AGIs $50k-75k, 0.6% for AGIs $75k-100k, 0.9% for AGIs over 100k)
Taxable dividends: $951 (reported on 12.7% of returns)
Here:
$951
State:
$2,913
(% of AGI for various income ranges: 0.6% for AGIs below $10k, 0.6% for AGIs $10k-25k, 0.2% for AGIs $25k-50k, 0.3% for AGIs $50k-75k, 0.1% for AGIs $75k-100k, 0.5% for AGIs over 100k)
Net capital gain/loss: +$2,121 (reported on 11.0% of returns)
Here:
+$2,121
State:
+$6,331
(% of AGI for various income ranges: 0.1% for AGIs $10k-25k, -0.1% for AGIs $25k-50k, 0.5% for AGIs $50k-75k, 0.2% for AGIs $75k-100k, 2.3% for AGIs over 100k)
Profit/loss from business: +$8,244 (reported on 14.2% of returns)
Here:
+$8,244
State:
+$11,074
(% of AGI for various income ranges: 5.8% for AGIs below $10k, 4.1% for AGIs $10k-25k, 2.2% for AGIs $25k-50k, 1.1% for AGIs $50k-75k, 0.5% for AGIs $75k-100k, 7.8% for AGIs over 100k)
IRA payment deduction: $2,333 (reported on 1.3% of returns)
25535:
$2,333
West Virginia:
$2,796
Total itemized deductions: $16,142 (20% of AGI, reported on 19.4% of returns)
Here:
$16,142
State:
$16,976
Here:
19.9% of AGI
State:
19.0% of AGI
(% of AGI for various income ranges: 4.7% for AGIs $10k-25k, 5.5% for AGIs $25k-50k, 6.6% for AGIs $50k-75k, 10.2% for AGIs $75k-100k, 14.2% for AGIs over 100k)
Charity contributions deductions: $2,809 (3% of AGI, reported on 16.7% of returns)
Here:
$2,809
State:
$3,529
Here:
3.4% of AGI
State:
3.7% of AGI
(% of AGI for various income ranges: 0.3% for AGIs $10k-25k, 0.9% for AGIs $25k-50k, 1.2% for AGIs $50k-75k, 1.4% for AGIs $75k-100k, 2.1% for AGIs over 100k)
Total tax: $4,848 (reported on 74.5% of returns)
25535:
$4,848
State:
$5,372
(% of AGI for various income ranges: 2.2% for AGIs below $10k, 3.6% for AGIs $10k-25k, 6.2% for AGIs $25k-50k, 8.8% for AGIs $50k-75k, 10.6% for AGIs $75k-100k, 16.8% for AGIs over 100k)
Earned income credit: $1,476 (reported on 16.8% of returns)
Here:
$1,476
State:
$1,662
Percentage of individuals using paid preparers for their 2004 taxes: 55.2%
Here:
55%
State:
55%
(% for various income ranges: 46.4% for AGIs below $10k, 53.1% for AGIs $10k-25k, 55.2% for AGIs $25k-50k, 61.1% for AGIs $50k-75k, 60.7% for AGIs $75k-100k, 72.7% for AGIs over 100k)
Household received Food Stamps/SNAP in the past 12 months: 85 Household did not receive Food Stamps/SNAP in the past 12 months: 734
Women who did not have a birth in the past 12 months: 453 (267 now married, 184 unmarried)
Housing units in zip code 25535 with a mortgage: 586 (103 second mortgage, 104 both second mortgage and home equity loan) Median monthly owner costs for units with a mortgage: $1,152 Median monthly owner costs for units without a mortgage: $335
Residents with income below the poverty level in 2022:
This zip code:
14.3%
Whole state:
17.9%
Residents with income below 50% of the poverty level in 2022:
This zip code:
13.8%
Whole state:
9.7%
Median number of rooms in houses and condos:
Here:
7.4
State:
6.5
Median number of rooms in apartments:
Here:
10.0
State:
4.7
Notable locations in this zip code not listed on our city pages
Notable locations in zip code 25535: Twin Silos at Lavalette Golf Course (A), Sugarwood Golf Club (B), Lavalette Volunteer Fire Department (C). Display/hide their locations on the map
Churches in zip code 25535 include: Camp Creek Church (A), Lynn Chapel (B), Macedonia Church (C), Mays Church (D), Florence Memorial United Methodist Church (E). Display/hide their locations on the map
Streams, rivers, and creeks: Spring Branch (A), Millers Fork (B), Mays Branch (C), Lyons Branch (D), Lynn Creek (E), Falls Branch (F), Camp Creek (G), Beech Fork (H). Display/hide their locations on the map
Size of family households: 170 2-persons, 193 3-persons, 84 4-persons, 139 5-persons, 78 6-persons
Size of nonfamily households: 155 1-person, 12 2-persons
706 married couples with children.
38 single-parent households (38 women).
99.3% of residents of 25535 zip code speak English at home.
Foreign born population: 0 (0.0%)
:
0.0%
Whole state:
1.8%
48%English
34%American
2%European
1%German
1%Scotch-Irish
1%Irish
1%Polish
Year of entry for the foreign-born population
02010 or later
02000 to 2009
421990 to 1999
0Before 1990
Facilities with environmental interests located in this zip code:
BOBS PAINT SHOP (5308 RT 52 in LAVALETTE, WV)
(Resource Conservation and Recovery Act (tracking hazardous waste)) Organizations: ROBERT FANNIN (CONTACT/OWNER)
CORNWELLS AUTO (4805 BEURING ST RR in LAVALETTE, WV)
(Resource Conservation and Recovery Act (tracking hazardous waste)) Organizations: CORNWELL CHARLIE (CONTACT/OWNER)
EARP MOBILE HOME PARK (5298 RT 152 in LAVALETTE, WV)
National Pollutant Discharge Elimination System NON-MAJOR (Tracking pollutant discharge elimination systems) - permit Business SIC classification: OPERATORS OF RESIDENTIAL MOBILE HOME SITES Organizations: ADDIE L. EARP (CONTACT/OWNER)
Alternative names: ADDIE L EARP, EARP, ADDIE L
EASTERN STATES PUMP & EQUIP INC (4938 RT 152 in LAVALETTE, WV)
(Resource Conservation and Recovery Act (tracking hazardous waste)) Organizations: TOM FELLURE (CONTACT/OWNER)
FAIRVIEW APTS (5727 US ROUTE 152 in LAVALETTE, WV)
National Pollutant Discharge Elimination System NON-MAJOR (Tracking pollutant discharge elimination systems) - permit Business SIC classification: SEWERAGE SYSTEMS Organizations: APARTMENT CENTRAL LLC (CONTACT/OWNER)
Alternative names: WAYNE LTD
FINISH LINE CLEANERS (4541A FIFTH STREET ROAD in LAVALETTE, WV)
AIR MINOR (AIRS/AFS) Business SIC classification: DRYCLEANING PLANTS, EXCEPT RUG CLEANING
FOLLOWAY BLACKTOP, INC. (5171 MOORE ROAD in LAVALETTE, WV)
AIR MINOR (AIRS/AFS) Business SIC classification: ASPHALT PAVING MIXTURES AND BLOCKS
BOBS PAINT SHOP (5228 MOORE RD. in LAVALETTE, WV)
Conditionally Exempt Small Quantity Generators, less than 100 kg/month of hazardous waste (Resource Conservation and Recovery Act (tracking hazardous waste)) - notification Organizations: ROBERT L FANNIN (CONTACT/OWNER)
Alternative names: B0BS PAINT SHOP
FAST CHANGE LUBE & OIL (4619 RT 152 in LAVALETTE, WV)
Conditionally Exempt Small Quantity Generators, less than 100 kg/month of hazardous waste (Resource Conservation and Recovery Act (tracking hazardous waste)) - notification Organizations: KEVIN DAVIS (CONTACT/OWNER)
Housing units lacking complete plumbing facilities: 3.5% Housing units lacking complete kitchen facilities: 3.4%
62.4%Electricity
37.7%Utility gas
Population in 1990: 5,928.
Place of birth for U.S.-born residents:
This state: 2,284
Northeast: 21
Midwest: 139
South: 139
67% of the 25535 zip code residents lived in the same house 5 years ago. Out of people who lived in different houses, 64% lived in this county. Out of people who lived in different counties, 50% lived in West Virginia.
97% of the 25535 zip code residents lived in the same house 1 year ago. Out of people who lived in different houses, 104% moved from this county.
Private vs. public school enrollment:
Students in private schools in grades 1 to 8 (elementary and middle school): 72
Here:
21.3%
West Virginia:
12.2%
Students in private schools in grades 9 to 12 (high school):
Here:
0.0%
West Virginia:
8.8%
Occupation by median earnings in the past 12 months ($)
129,257Computer and mathematical occupations
88,909Health diagnosing and treating practitioners and other technical occupations
70,427Business and financial operations occupations
54,550Education, training, and library occupations
33,194Office and administrative support occupations
16,630Management occupations
Companies with federal contracts located in this zip code:
EASTERN STATES PUMP AND EQUIPM (4938 ROUTE 152 in LAVALETTE, WV; small business)
$3,235 with U.S. Army Corps of Engineers - civil program financing only for Maintenance, Repair and Rebuilding of Equipment -- Pumps and Compressors. Taking place in KY. Signed on 2003-05-28. Completion date: 2003-05-08.
Top industries in this zip code by the number of employees in 2005:
Accommodation and Food Services: Limited-Service Restaurants (10-19 employees: 3 establishments)
Real Estate and Rental and Leasing: Recreational Goods Rental (10-19: 1)
Construction: Site Preparation Contractors (10-19: 1)
Accommodation and Food Services: Full-Service Restaurants (10-19: 1)
Administrative and Support and Waste Management and Remediation Services: All Other Support Services (10-19: 1)
Health Care and Social Assistance: Services for the Elderly and Persons with Disabilities (10-19: 1)
Fatal accident statistics in 2013:
Fatal accident count: 1
Vehicles involved in fatal accidents: 1
Fatal accidents caused by drunken drivers: 0
Fatalities: 1
Persons involved in fatal accidents: 1
Pedestrians involved in fatal accidents: 0
Fatal accident statistics in 2010:
Fatal accident count: 2
Vehicles involved in fatal accidents: 5
Fatal accidents caused by drunken drivers: 1
Fatalities: 2
Persons involved in fatal accidents: 10
Pedestrians involved in fatal accidents: 0
Home Mortgage Disclosure Act Aggregated Statistics For Year 2009 (Based on 4 partial tracts)
A) FHA, FSA/RHS & VA Home Purchase Loans
B) Conventional Home Purchase Loans
C) Refinancings
D) Home Improvement Loans
E) Loans on Dwellings For 5+ Families
F) Non-occupant Loans on < 5 Family Dwellings (A B C & D)
G) Loans On Manufactured Home Dwelling (A B C & D)
Number
Average Value
Number
Average Value
Number
Average Value
Number
Average Value
Number
Average Value
Number
Average Value
Number
Average Value
LOANS ORIGINATED
11
$100,374
11
$104,887
41
$126,596
8
$60,856
1
$282,520
4
$111,328
1
$34,650
APPLICATIONS APPROVED, NOT ACCEPTED
1
$57,340
2
$74,110
3
$108,590
0
$0
0
$0
0
$0
1
$82,180
APPLICATIONS DENIED
3
$95,627
7
$63,247
28
$108,014
9
$33,768
0
$0
2
$56,515
6
$67,552
APPLICATIONS WITHDRAWN
1
$133,860
3
$51,750
11
$113,188
2
$102,655
0
$0
1
$93,380
0
$0
FILES CLOSED FOR INCOMPLETENESS
0
$0
1
$54,460
4
$98,308
0
$0
0
$0
0
$0
1
$109,680
Aggregated Statistics For Year 2008 (Based on 4 partial tracts)
A) FHA, FSA/RHS & VA Home Purchase Loans
B) Conventional Home Purchase Loans
C) Refinancings
D) Home Improvement Loans
F) Non-occupant Loans on < 5 Family Dwellings (A B C & D)
G) Loans On Manufactured Home Dwelling (A B C & D)
Number
Average Value
Number
Average Value
Number
Average Value
Number
Average Value
Number
Average Value
Number
Average Value
LOANS ORIGINATED
10
$121,053
20
$104,782
35
$99,454
13
$40,838
6
$58,777
3
$54,380
APPLICATIONS APPROVED, NOT ACCEPTED
1
$51,170
7
$61,740
3
$138,927
3
$17,843
1
$89,270
7
$54,513
APPLICATIONS DENIED
3
$91,417
11
$74,853
24
$95,725
13
$41,897
2
$38,900
11
$48,775
APPLICATIONS WITHDRAWN
1
$78,460
2
$91,705
13
$118,956
2
$142,695
1
$59,700
1
$96,370
FILES CLOSED FOR INCOMPLETENESS
0
$0
0
$0
2
$151,310
0
$0
0
$0
0
$0
Aggregated Statistics For Year 2007 (Based on 4 partial tracts)
A) FHA, FSA/RHS & VA Home Purchase Loans
B) Conventional Home Purchase Loans
C) Refinancings
D) Home Improvement Loans
F) Non-occupant Loans on < 5 Family Dwellings (A B C & D)
G) Loans On Manufactured Home Dwelling (A B C & D)
Number
Average Value
Number
Average Value
Number
Average Value
Number
Average Value
Number
Average Value
Number
Average Value
LOANS ORIGINATED
5
$86,372
29
$136,962
36
$98,295
13
$53,868
7
$195,673
5
$108,462
APPLICATIONS APPROVED, NOT ACCEPTED
1
$35,820
5
$77,860
6
$76,168
2
$28,115
0
$0
4
$43,492
APPLICATIONS DENIED
2
$79,175
17
$80,637
26
$86,337
13
$19,574
2
$40,860
10
$58,586
APPLICATIONS WITHDRAWN
0
$0
3
$106,413
12
$84,867
2
$54,360
1
$31,640
1
$63,160
FILES CLOSED FOR INCOMPLETENESS
0
$0
1
$55,220
3
$111,197
0
$0
0
$0
0
$0
Aggregated Statistics For Year 2006 (Based on 4 partial tracts)
A) FHA, FSA/RHS & VA Home Purchase Loans
B) Conventional Home Purchase Loans
C) Refinancings
D) Home Improvement Loans
F) Non-occupant Loans on < 5 Family Dwellings (A B C & D)
G) Loans On Manufactured Home Dwelling (A B C & D)
Number
Average Value
Number
Average Value
Number
Average Value
Number
Average Value
Number
Average Value
Number
Average Value
LOANS ORIGINATED
4
$84,448
29
$95,761
52
$90,782
14
$38,379
5
$54,440
5
$54,460
APPLICATIONS APPROVED, NOT ACCEPTED
0
$0
8
$70,004
5
$84,006
1
$39,510
1
$47,310
5
$66,366
APPLICATIONS DENIED
2
$65,615
21
$63,901
35
$90,898
16
$42,979
4
$68,955
16
$47,415
APPLICATIONS WITHDRAWN
0
$0
5
$86,368
14
$89,343
1
$44,980
0
$0
2
$54,820
FILES CLOSED FOR INCOMPLETENESS
0
$0
3
$91,393
6
$89,742
0
$0
0
$0
0
$0
Aggregated Statistics For Year 2005 (Based on 4 partial tracts)
A) FHA, FSA/RHS & VA Home Purchase Loans
B) Conventional Home Purchase Loans
C) Refinancings
D) Home Improvement Loans
F) Non-occupant Loans on < 5 Family Dwellings (A B C & D)
G) Loans On Manufactured Home Dwelling (A B C & D)
Number
Average Value
Number
Average Value
Number
Average Value
Number
Average Value
Number
Average Value
Number
Average Value
LOANS ORIGINATED
2
$107,010
33
$100,313
52
$101,030
17
$33,658
6
$47,958
9
$56,052
APPLICATIONS APPROVED, NOT ACCEPTED
1
$32,410
11
$59,347
13
$56,444
2
$18,205
1
$42,640
7
$46,520
APPLICATIONS DENIED
6
$75,230
23
$53,087
46
$77,796
17
$39,611
3
$32,093
21
$44,135
APPLICATIONS WITHDRAWN
0
$0
6
$82,935
20
$102,023
1
$58,840
1
$37,040
3
$56,193
FILES CLOSED FOR INCOMPLETENESS
0
$0
1
$78,670
3
$161,647
1
$11,350
0
$0
0
$0
Aggregated Statistics For Year 2004 (Based on 4 partial tracts)
A) FHA, FSA/RHS & VA Home Purchase Loans
B) Conventional Home Purchase Loans
C) Refinancings
D) Home Improvement Loans
F) Non-occupant Loans on < 5 Family Dwellings (A B C & D)
G) Loans On Manufactured Home Dwelling (A B C & D)
Number
Average Value
Number
Average Value
Number
Average Value
Number
Average Value
Number
Average Value
Number
Average Value
LOANS ORIGINATED
5
$95,768
40
$87,057
48
$84,608
23
$35,813
7
$48,169
5
$42,390
APPLICATIONS APPROVED, NOT ACCEPTED
0
$0
7
$67,734
14
$65,378
2
$42,485
1
$41,360
6
$47,558
APPLICATIONS DENIED
1
$61,140
25
$49,277
50
$68,078
23
$28,870
6
$32,172
21
$44,787
APPLICATIONS WITHDRAWN
0
$0
3
$75,390
19
$88,855
1
$54,820
0
$0
1
$16,810
FILES CLOSED FOR INCOMPLETENESS
0
$0
0
$0
4
$90,220
1
$81,540
0
$0
0
$0
Aggregated Statistics For Year 2003 (Based on 4 partial tracts)
A) FHA, FSA/RHS & VA Home Purchase Loans
B) Conventional Home Purchase Loans
C) Refinancings
D) Home Improvement Loans
F) Non-occupant Loans on < 5 Family Dwellings (A B C & D)
Number
Average Value
Number
Average Value
Number
Average Value
Number
Average Value
Number
Average Value
LOANS ORIGINATED
4
$100,535
39
$90,469
96
$86,826
10
$24,074
6
$121,782
APPLICATIONS APPROVED, NOT ACCEPTED
0
$0
13
$53,515
24
$63,367
4
$13,168
1
$46,900
APPLICATIONS DENIED
1
$116,410
37
$42,525
49
$68,515
11
$18,653
4
$61,632
APPLICATIONS WITHDRAWN
1
$105,740
7
$72,099
18
$97,181
1
$11,090
0
$0
FILES CLOSED FOR INCOMPLETENESS
1
$61,400
2
$68,005
4
$88,890
1
$26,470
0
$0
Aggregated Statistics For Year 2002 (Based on 2 partial tracts)
A) FHA, FSA/RHS & VA Home Purchase Loans
B) Conventional Home Purchase Loans
C) Refinancings
D) Home Improvement Loans
F) Non-occupant Loans on < 5 Family Dwellings (A B C & D)
Number
Average Value
Number
Average Value
Number
Average Value
Number
Average Value
Number
Average Value
LOANS ORIGINATED
2
$83,790
26
$70,684
52
$79,753
12
$11,797
3
$44,347
APPLICATIONS APPROVED, NOT ACCEPTED
0
$0
11
$45,160
14
$88,630
4
$26,862
0
$0
APPLICATIONS DENIED
1
$50,740
27
$41,440
35
$73,853
10
$14,412
1
$64,810
APPLICATIONS WITHDRAWN
0
$0
3
$73,057
14
$95,940
1
$13,220
0
$0
FILES CLOSED FOR INCOMPLETENESS
0
$0
0
$0
3
$120,387
0
$0
0
$0
Aggregated Statistics For Year 2001 (Based on 2 partial tracts)
A) FHA, FSA/RHS & VA Home Purchase Loans
B) Conventional Home Purchase Loans
C) Refinancings
D) Home Improvement Loans
F) Non-occupant Loans on < 5 Family Dwellings (A B C & D)
Number
Average Value
Number
Average Value
Number
Average Value
Number
Average Value
Number
Average Value
LOANS ORIGINATED
2
$81,015
16
$69,343
56
$78,884
11
$11,164
3
$51,737
APPLICATIONS APPROVED, NOT ACCEPTED
0
$0
8
$40,241
14
$52,051
1
$34,540
0
$0
APPLICATIONS DENIED
0
$0
21
$40,731
36
$55,681
13
$9,020
3
$28,853
APPLICATIONS WITHDRAWN
3
$71,777
3
$63,250
19
$84,068
2
$12,580
0
$0
FILES CLOSED FOR INCOMPLETENESS
0
$0
1
$30,700
4
$63,108
0
$0
0
$0
Aggregated Statistics For Year 2000 (Based on 2 partial tracts)
A) FHA, FSA/RHS & VA Home Purchase Loans
B) Conventional Home Purchase Loans
C) Refinancings
D) Home Improvement Loans
F) Non-occupant Loans on < 5 Family Dwellings (A B C & D)
Number
Average Value
Number
Average Value
Number
Average Value
Number
Average Value
Number
Average Value
LOANS ORIGINATED
2
$68,650
22
$58,979
21
$59,594
16
$9,088
2
$30,275
APPLICATIONS APPROVED, NOT ACCEPTED
3
$49,177
12
$37,523
10
$60,208
2
$8,955
1
$59,700
APPLICATIONS DENIED
3
$44,203
32
$38,163
38
$54,568
8
$7,729
3
$9,950
APPLICATIONS WITHDRAWN
1
$59,700
3
$52,590
19
$60,257
0
$0
0
$0
FILES CLOSED FOR INCOMPLETENESS
0
$0
0
$0
4
$62,680
0
$0
0
$0
Aggregated Statistics For Year 1999 (Based on 2 partial tracts)
A) FHA, FSA/RHS & VA Home Purchase Loans
B) Conventional Home Purchase Loans
C) Refinancings
D) Home Improvement Loans
F) Non-occupant Loans on < 5 Family Dwellings (A B C & D)
Detailed PMIC statistics for the following Tracts:0205.00
, 0206.00
2002 - 2018 National Fire Incident Reporting System (NFIRS) incidents
Based on the data from the years 2002 - 2018 the average number of fires per year is 16. The highest number of reported fires - 33 took place in 2010, and the least - 6 in 2016. The data has a declining trend.
When looking into fire subcategories, the most incidents belonged to: Structure Fires (43.0%), and Outside Fires (28.5%).
Fire incident types reported to NFIRS in Zip Code 25535


 Nearest zip codes: 25704, 25701, 25570, 25703, 25705, 25555.


 Based on the data from the years 2002 - 2018 the average number of fires per year is 16. The highest number of reported fires - 33 took place in 2010, and the least - 6 in 2016. The data has a declining trend.
 When looking into fire subcategories, the most incidents belonged to: Structure Fires (43.0%), and Outside Fires (28.5%).