Estimated zip code population in 2022: 2,829 Zip code population in 2010: 2,647 Zip code population in 2000: 2,959
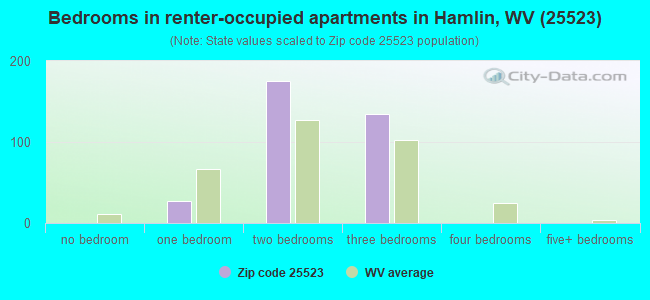
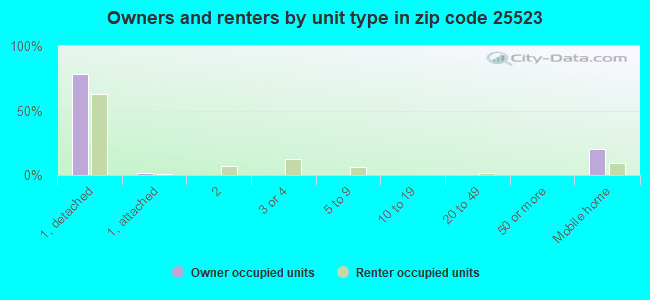
Houses and condos: 1,204 Renter-occupied apartments: 338
% of renters here:
33%
State:
26%
March 2022 cost of living index in zip code 25523: 84.2 (less than average, U.S. average is 100)
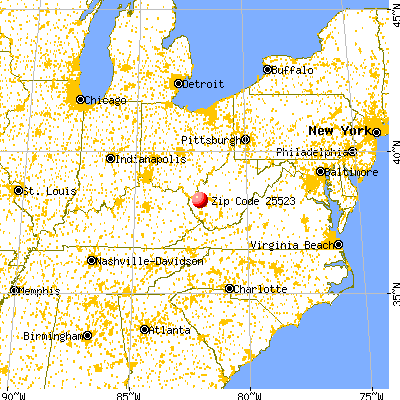
Land area: 41.9 sq. mi. Water area: 0.2 sq. mi.
Population density: 67 people per square mile
(very low).
OSM Map
General Map
Google Map
MSN Map
OSM Map
General Map
Google Map
MSN Map
OSM Map
General Map
Google Map
MSN Map
OSM Map
General Map
Google Map
MSN Map
Please wait while loading the map...
Real estate property taxes paid for housing units in 2022:
This zip code:
0.6% ($649)
West Virginia:
0.5% ($821)
Median real estate property taxes paid for housing units with mortgages in 2022: $728 (0.5%) Median real estate property taxes paid for housing units with no mortgage in 2022: $538 (0.9%)
Business Search- 14 Million verified businesses
Males: 1,574
(55.7%)
Females: 1,253
(44.3%)
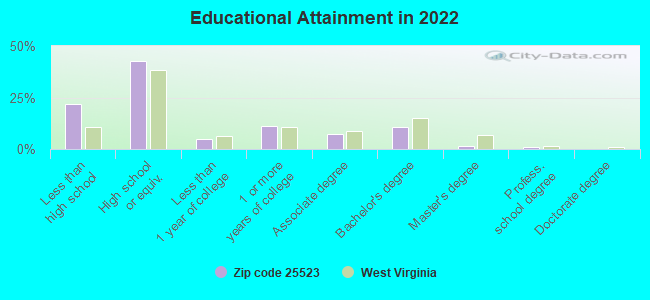
For population 25 years and over in 25523:
High school or higher: 75.5%
Bachelor's degree or higher: 12.6%
Graduate or professional degree: 2.2%
Unemployed: 2.2%
Mean travel time to work (commute): 24.1 minutes
For population 15 years and over in 25523:
Never married: 24.4%
Now married: 41.9%
Separated: 0.5%
Widowed: 14.8%
Divorced: 18.4%
Zip code 25523 compared to state average:
Unemployed percentage below state average.
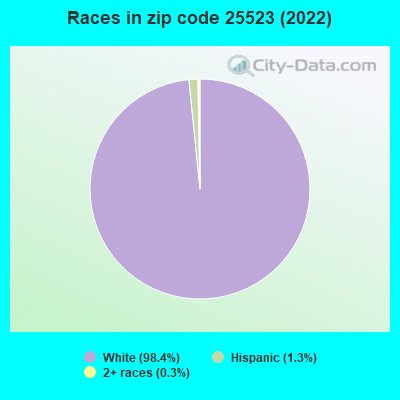
Black race population percentage significantly below state average.
Foreign-born population percentage significantly below state average.
Length of stay since moving in significantly above state average.
Percentage of population with a bachelor's degree or higher below state average.
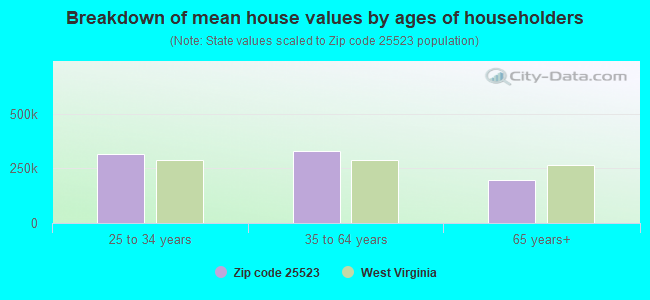
Estimated median house/condo value in 2022: $111,378
25523:
$111,378
West Virginia:
$155,100
According to our research of West Virginia and other state lists, there were 9 registered sex offenders living in 25523 zip code as of May 25, 2024. The ratio of all residents to sex offenders in zip code 25523 is 311 to 1. The ratio of registered sex offenders to all residents in this zip code is near the state average.
Median resident age:
This zip code:
42.5 years
West Virginia median age:
42.9 years
Average household size:
This zip code:
2.7 people
West Virginia:
2.3 people
Averages for the 2020 tax year for zip code 25523, filed in 2021:
Average Adjusted Gross Income (AGI) in 2020: $49,608 (Individual Income Tax Returns)
Here:
$49,608
State:
$56,292
Salary/wage: $44,058 (reported on 78.4% of returns)
Here:
$44,058
State:
$49,093
(% of AGI for various income ranges: 1011.3% for AGIs below $25k, 3324.5% for AGIs $25k-50k, 5566.7% for AGIs $50k-75k, 9180.0% for AGIs $75k-100k, 13616.7% for AGIs $100k-200k)
Taxable interest for individuals: $842 (reported on 25.5% of returns)
This zip code:
$842
West Virginia:
$1,141
(% of AGI for various income ranges: 24.7% for AGIs below $25k, 17.5% for AGIs $25k-50k, 38.3% for AGIs $50k-75k, 35.7% for AGIs $75k-100k, 37.8% for AGIs $100k-200k)
Ordinary dividends: $3,900 (reported on 6.9% of returns)
Here:
$3,900
State:
$5,456
(% of AGI for various income ranges: 23.0% for AGIs $25k-50k, 324.3% for AGIs $75k-100k)
Net capital gain/loss in AGI: +$1,383 (reported on 5.9% of returns)
Here:
+$1,383
State:
+$11,656
(% of AGI for various income ranges: 2.5% for AGIs below $25k, 107.1% for AGIs $75k-100k)
Profit/loss from business: +$6,738 (reported on 7.8% of returns)
Here:
+$6,738
State:
+$12,084
(% of AGI for various income ranges: 81.6% for AGIs below $25k, 88.0% for AGIs $25k-50k, 145.7% for AGIs $75k-100k)
Taxable individual retirement arrangement distribution: $12,214 (reported on 6.9% of returns)
25523:
$12,214
West Virginia:
$15,311
(% of AGI for various income ranges: 33.8% for AGIs below $25k, 114.5% for AGIs $25k-50k, 740.0% for AGIs $75k-100k)
Earned income credit: $2,524 (reported on 20.6% of returns)
Here:
$2,524
State:
$2,258
(% of AGI for various income ranges: 110.0% for AGIs below $25k, 89.0% for AGIs $25k-50k)
Percentage of individuals using paid preparers for their 2020 taxes: 97.1%
Here:
97%
State:
93%
(% for various income ranges: 95.1% for AGIs below $25k, 96.0% for AGIs $25k-50k, 100.0% for AGIs $50k-75k, 100.0% for AGIs $75k-100k, 100.0% for AGIs $100k-200k)
Averages for the 2012 tax year for zip code 25523, filed in 2013:
Average Adjusted Gross Income (AGI) in 2012: $43,731 (Individual Income Tax Returns)
Here:
$43,731
State:
$48,628
Salary/wage: $37,698 (reported on 85.0% of returns)
Here:
$37,698
State:
$42,328
(% of AGI for various income ranges: 71.3% for AGIs below $25k, 75.8% for AGIs $25k-50k, 76.9% for AGIs $50k-75k, 80.3% for AGIs $75k-100k, 66.0% for AGIs $100k-200k)
Taxable interest for individuals: $1,171 (reported on 31.8% of returns)
This zip code:
$1,171
West Virginia:
$1,211
(% of AGI for various income ranges: 1.6% for AGIs below $25k, 1.5% for AGIs $25k-50k, 0.5% for AGIs $50k-75k, 0.5% for AGIs $75k-100k, 0.7% for AGIs $100k-200k)
Ordinary dividends: $6,267 (reported on 8.4% of returns)
Here:
$6,267
State:
$4,262
(% of AGI for various income ranges: 1.5% for AGIs below $25k, 0.3% for AGIs $25k-50k, 0.3% for AGIs $50k-75k, 3.0% for AGIs $100k-200k)
Net capital gain/loss in AGI: +$1,088 (reported on 7.5% of returns)
Here:
+$1,088
State:
+$8,875
(% of AGI for various income ranges: 0.6% for AGIs $100k-200k)
Profit/loss from business: +$8,900 (reported on 11.2% of returns)
Here:
+$8,900
State:
+$13,636
(% of AGI for various income ranges: 2.0% for AGIs below $25k, 2.2% for AGIs $25k-50k, 1.9% for AGIs $50k-75k, 6.7% for AGIs $75k-100k)
Taxable individual retirement arrangement distribution: $8,643 (reported on 6.5% of returns)
25523:
$8,643
West Virginia:
$11,787
(% of AGI for various income ranges: 2.1% for AGIs below $25k, 2.0% for AGIs $25k-50k, 3.2% for AGIs $50k-75k)
Total itemized deductions: $23,462 (22% of AGI, reported on 12.1% of returns)
Here:
$23,462
State:
$21,148
Here:
21.6% of AGI
State:
18.1% of AGI
(% of AGI for various income ranges: 9.0% for AGIs $25k-50k, 6.4% for AGIs $75k-100k, 12.4% for AGIs $100k-200k)
Charity contributions: $4,543 (reported on 6.5% of returns)
Here:
$4,543
State:
$4,508
Taxes paid: $10,754 (reported on 12.1% of returns)
25523:
$10,754
State:
$8,103
(% of AGI for various income ranges: 1.5% for AGIs $25k-50k, 1.8% for AGIs $75k-100k, 7.9% for AGIs $100k-200k)
Earned income credit: $2,246 (reported on 24.3% of returns)
Here:
$2,246
State:
$2,140
(% of AGI for various income ranges: 8.1% for AGIs below $25k, 1.2% for AGIs $25k-50k)
Percentage of individuals using paid preparers for their 2012 taxes: 57.0%
Here:
57%
State:
49%
(% for various income ranges: 53.1% for AGIs below $25k, 56.5% for AGIs $25k-50k, 56.2% for AGIs $50k-75k, 60.0% for AGIs $75k-100k, 77.8% for AGIs $100k-200k)
Averages for the 2004 tax year for zip code 25523, filed in 2005:
Average Adjusted Gross Income (AGI) in 2004: $37,848 (Individual Income Tax Returns)
Here:
$37,848
State:
$37,498
Salary/wage: $29,867 (reported on 85.1% of returns)
Here:
$29,867
State:
$33,645
(% of AGI for various income ranges: 93.9% for AGIs below $10k, 73.7% for AGIs $10k-25k, 80.3% for AGIs $25k-50k, 83.2% for AGIs $50k-75k, 86.7% for AGIs $75k-100k, 24.1% for AGIs over 100k)
Taxable interest for individuals: $1,456 (reported on 38.7% of returns)
This zip code:
$1,456
West Virginia:
$1,465
(% of AGI for various income ranges: 4.7% for AGIs below $10k, 2.0% for AGIs $10k-25k, 0.8% for AGIs $25k-50k, 2.0% for AGIs $50k-75k, 0.8% for AGIs $75k-100k, 1.3% for AGIs over 100k)
Taxable dividends: $3,511 (reported on 12.6% of returns)
Here:
$3,511
State:
$2,913
(% of AGI for various income ranges: 1.5% for AGIs $10k-25k, 0.3% for AGIs $25k-50k, 0.3% for AGIs $50k-75k, 0.1% for AGIs $75k-100k, 3.3% for AGIs over 100k)
Net capital gain/loss: +$3,119 (reported on 9.7% of returns)
Here:
+$3,119
State:
+$6,331
(% of AGI for various income ranges: 0.5% for AGIs $10k-25k, 0.2% for AGIs $25k-50k, -0.0% for AGIs $50k-75k, 2.8% for AGIs over 100k)
Profit/loss from business: +$10,532 (reported on 12.2% of returns)
Here:
+$10,532
State:
+$11,074
(% of AGI for various income ranges: 7.0% for AGIs below $10k, 1.0% for AGIs $10k-25k, 2.1% for AGIs $25k-50k, 2.1% for AGIs $50k-75k, 8.3% for AGIs over 100k)
IRA payment deduction: $1,875 (reported on 1.5% of returns)
25523:
$1,875
West Virginia:
$2,796
Total itemized deductions: $18,079 (17% of AGI, reported on 9.7% of returns)
Here:
$18,079
State:
$16,976
Here:
17.2% of AGI
State:
19.0% of AGI
(% of AGI for various income ranges: 3.5% for AGIs $25k-50k, 4.8% for AGIs $50k-75k, 5.6% for AGIs $75k-100k, 8.2% for AGIs over 100k)
Charity contributions deductions: $2,867 (3% of AGI, reported on 7.2% of returns)
Here:
$2,867
State:
$3,529
Here:
2.9% of AGI
State:
3.7% of AGI
(% of AGI for various income ranges: 0.3% for AGIs $25k-50k, 0.3% for AGIs $50k-75k, 1.0% for AGIs $75k-100k, 1.2% for AGIs over 100k)
Total tax: $5,692 (reported on 71.0% of returns)
25523:
$5,692
State:
$5,372
(% of AGI for various income ranges: 2.2% for AGIs below $10k, 3.4% for AGIs $10k-25k, 6.5% for AGIs $25k-50k, 8.8% for AGIs $50k-75k, 11.2% for AGIs $75k-100k, 20.9% for AGIs over 100k)
Earned income credit: $1,634 (reported on 21.6% of returns)
Here:
$1,634
State:
$1,662
Percentage of individuals using paid preparers for their 2004 taxes: 58.1%
Here:
58%
State:
55%
(% for various income ranges: 56.7% for AGIs below $10k, 58.9% for AGIs $10k-25k, 54.8% for AGIs $25k-50k, 57.6% for AGIs $50k-75k, 63.0% for AGIs $75k-100k, 78.8% for AGIs over 100k)
Household received Food Stamps/SNAP in the past 12 months: 376 Household did not receive Food Stamps/SNAP in the past 12 months: 674
Women who had a birth in the past 12 months: 11 (0 now married, 10 unmarried) Women who did not have a birth in the past 12 months: 476 (164 now married, 312 unmarried)
Housing units in zip code 25523 with a mortgage: 279 (40 second mortgage, 26 both second mortgage and home equity loan) Houses without a mortgage: 48
Median monthly owner costs for units with a mortgage: $1,031 Median monthly owner costs for units without a mortgage: $287
Residents with income below the poverty level in 2022:
This zip code:
18.9%
Whole state:
17.9%
Residents with income below 50% of the poverty level in 2022:
This zip code:
9.8%
Whole state:
9.7%
Median number of rooms in houses and condos:
Here:
5.9
State:
6.5
Median number of rooms in apartments:
Here:
5.0
State:
4.7
Notable locations in this zip code not listed on our city pages
Churches in zip code 25523 include: Walnut Grove Church (A), Scary Church (B), Middle Creek Church (C), Middle Fork Church (D). Display/hide their locations on the map
Cemeteries: Black Cemetery (1), Harveys Creek Cemetery (2), Hamlin Cemetery (3), Lincoln Memorial Cemetery (4), Goode Cemetery (5), Roberts Cemetery (6), Powell Cemetery (7). Display/hide their locations on the map
Streams, rivers, and creeks: Trace Fork (A), Trace Creek (B), Tincture Fork (C), Simon Creek (D), Scary Creek (E), Ruffie Branch (F), Pigeon Branch (G), Patters Run (H), Paddy Branch (I). Display/hide their locations on the map
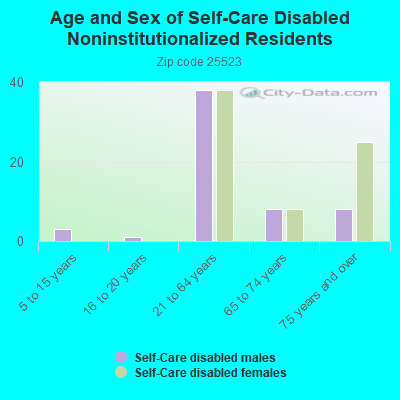
In group quarters: 70 (-1 institutionalized population)
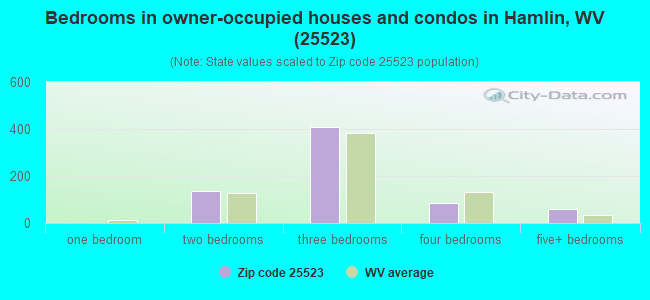
Size of family households: 363 2-persons, 143 3-persons, 119 4-persons, 28 5-persons, 42 7-or-more-persons
Size of nonfamily households: 315 1-person, 11 2-persons
204 married couples with children.
317 single-parent households (113 men, 204 women).
99.5% of residents of 25523 zip code speak English at home.
0.2% of residents speak other Indo-European language at home (100% very well).
0.1% of residents speak Asian or Pacific Island language at home (100% very well).
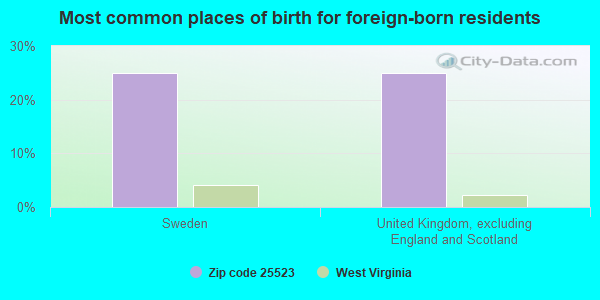
Foreign born population: 16 (0.6%) (7.0% of them are naturalized citizens)
This zip code:
0.6%
Whole state:
1.8%
25%Sweden
25%United Kingdom, excluding England and Scotland
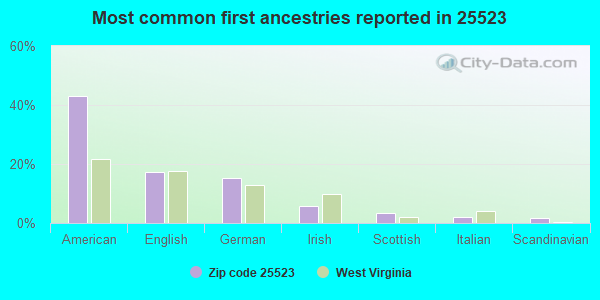
43%American
17%English
15%German
6%Irish
4%Scottish
2%Italian
2%Scandinavian
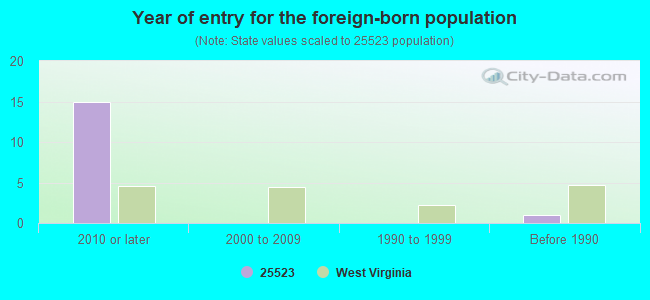
Year of entry for the foreign-born population
152010 or later
02000 to 2009
01990 to 1999
1Before 1990
Facilities with environmental interests located in this zip code:
CHARLES E YEAGER CAREER CENTER (10 MARLAND AVE in HAMLIN, WV)
(National Center for Education Statistics) - STATE ID-43701 Conditionally Exempt Small Quantity Generators, less than 100 kg/month of hazardous waste (Resource Conservation and Recovery Act (tracking hazardous waste)) - notification Organizations: LINCOLN CO BD OF EDUCATION (CONTACT/OWNER)
, LINCOLN COUNTY SCHOOL DISTRICT (SCHOOL DISTRICT)
COLUMBIA GAS NYE COMPRESSOR STATION (STATE ROUTE 34 in HAMLIN, WV)
(Resource Conservation and Recovery Act (tracking hazardous waste)) Organizations: OPERNAME (CONTACT/OPERATOR)
, COLUMBIA GAS TRANSMISSION CORP (CONTACT/OWNER)
Alternative names: CGST NYE COMP STA & DEHY, COLUMBIA GAS NYE CS
DUVAL HIGH SCHOOL (10 MARLAND AVENUE in HAMLIN, WV)
National Pollutant Discharge Elimination System NON-MAJOR (Tracking pollutant discharge elimination systems) - permit Business SIC classification: SEWERAGE SYSTEMS Alternative names: LINCOLN CNTY BD OF ED
APCO HAMLIN SERV BLDG (7746 STATE RT 3 in HAMLIN, WV)
Conditionally Exempt Small Quantity Generators, less than 100 kg/month of hazardous waste (Resource Conservation and Recovery Act (tracking hazardous waste)) - notification Organizations: APPALACHIAN POWER CO (CONTACT/OWNER)
ED MILLS BODY SHOP (PO BOX 199 8110 COURT ST in HAMLIN, WV)
Conditionally Exempt Small Quantity Generators, less than 100 kg/month of hazardous waste (Resource Conservation and Recovery Act (tracking hazardous waste)) - notification
Housing units lacking complete plumbing facilities: 3.9% Housing units lacking complete kitchen facilities: 2.2%
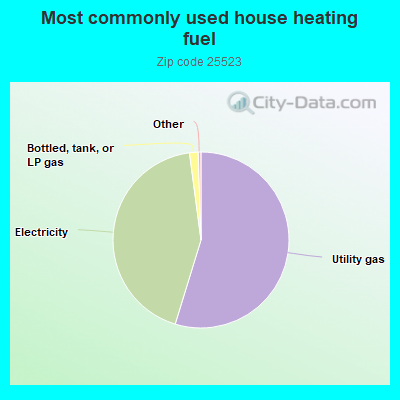
54.8%Utility gas
43.2%Electricity
1.6%Bottled, tank, or LP gas
Population in 1990: 2,993.
Place of birth for U.S.-born residents:
This state: 2,374
Northeast: 23
Midwest: 237
South: 139
West: 10
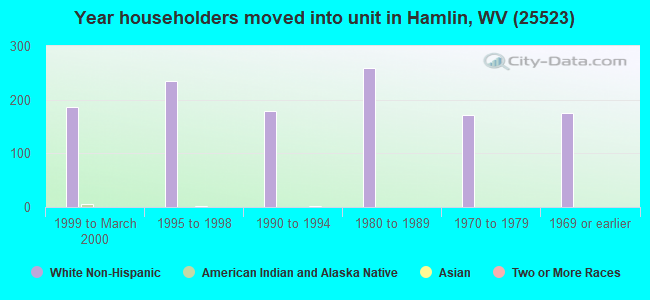
64% of the 25523 zip code residents lived in the same house 5 years ago. Out of people who lived in different houses, 55% lived in this county. Out of people who lived in different counties, 50% lived in West Virginia.
91% of the 25523 zip code residents lived in the same house 1 year ago. Out of people who lived in different houses, 29% moved from this county. Out of people who lived in different houses, 69% moved from different county within same state. Out of people who lived in different houses, 2% moved from different state.
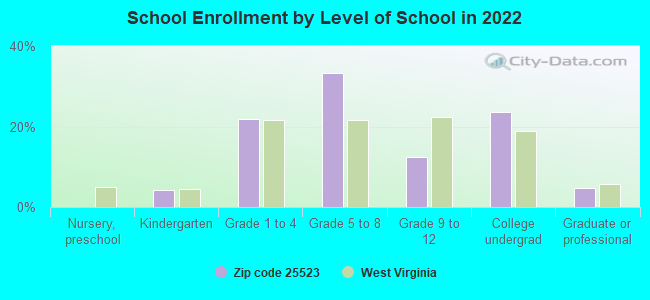
Private vs. public school enrollment:
Students in private schools in grades 1 to 8 (elementary and middle school): 3
Here:
1.0%
West Virginia:
12.2%
Students in private schools in grades 9 to 12 (high school): 9
Here:
11.7%
West Virginia:
8.8%
Students in private undergraduate colleges: 16
Here:
11.2%
West Virginia:
17.3%
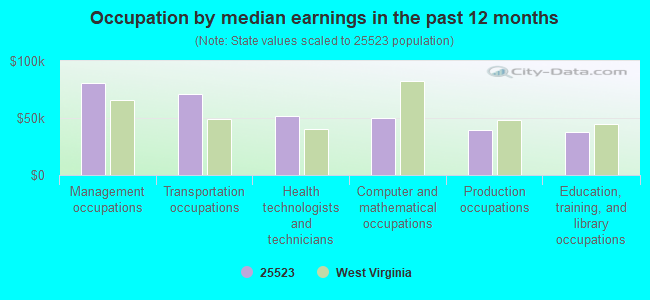
Occupation by median earnings in the past 12 months ($)
80,358Management occupations
70,801Transportation occupations
51,922Health technologists and technicians
50,090Computer and mathematical occupations
39,355Production occupations
38,042Education, training, and library occupations
Companies with federal contracts located in this zip code:
LINCOLN LEASING, INC (8152 COURT STREET in HAMLIN, WV; small business) : $2,343,832 in 34 contractsfrom 2001 to 2002
Contracts for Demolition of Buildings, Demolition of Structures or Facilities (Other than Buildings), Construction of Structures and Facilities -- Restoration of real property, Construction of Structures and Facilities -- Other Residential Buildings by U.S. Army Corps of Engineers - civil program financing only Signed by year:2000: $0; 2001: $1,911,615; 2002: $432,217; 2003: $0; 2004: $0; 2005: $0; 2006: $0.
Biggest contracts:
$134,204 with U.S. Army Corps of Engineers - civil program financing only for Demolition of Buildings. Signed on 2002-06-20. Completion date: 2002-07-03.
$117,666 with U.S. Army Corps of Engineers - civil program financing only for Demolition of Structures or Facilities (Other than Buildings). Signed on 2002-06-15. Completion date: 2002-06-28.
$113,741 with U.S. Army Corps of Engineers - civil program financing only for Demolition of Buildings. Signed on 2002-06-29. Completion date: 2002-07-03.
$99,689 with U.S. Army Corps of Engineers - civil program financing only for Construction of Structures and Facilities -- Restoration of real property. Signed on 2001-08-22. Completion date: 2001-08-29.
Top industries in this zip code by the number of employees in 2005:
Health Care and Social Assistance: Services for the Elderly and Persons with Disabilities (100-249 employees: 1 establishment, 1-4 employees: 2 establishments)
Health Care and Social Assistance: Nursing Care Facilities (50-99: 1)
Mining: Support Activities for Coal Mining (50-99: 1)
Health Care and Social Assistance: All Other Outpatient Care Centers (50-99: 1)
Mining: Drilling Oil and Gas Wells (50-99: 1)
Construction: Oil and Gas Pipeline and Related Structures Construction (50-99: 1)
Mining: Support Activities for Oil and Gas Operations (20-49: 1, 10-19: 1)
Health Care and Social Assistance: Ambulance Services (20-49: 1)
People in group quarters in 2010:
60 people in nursing facilities/skilled-nursing facilities
People in group quarters in 2000:
58 people in nursing homes
3 people in other noninstitutional group quarters
Fatal accident statistics in 2013:
Fatal accident count: 1
Vehicles involved in fatal accidents: 1
Fatal accidents caused by drunken drivers: 0
Fatalities: 1
Persons involved in fatal accidents: 2
Pedestrians involved in fatal accidents: 0
Fatal accident statistics in 2011:
Fatal accident count: 1
Vehicles involved in fatal accidents: 1
Fatal accidents caused by drunken drivers: 0
Fatalities: 1
Persons involved in fatal accidents: 1
Pedestrians involved in fatal accidents: 0
Home Mortgage Disclosure Act Aggregated Statistics For Year 2009 (Based on 2 partial tracts)
A) FHA, FSA/RHS & VA Home Purchase Loans
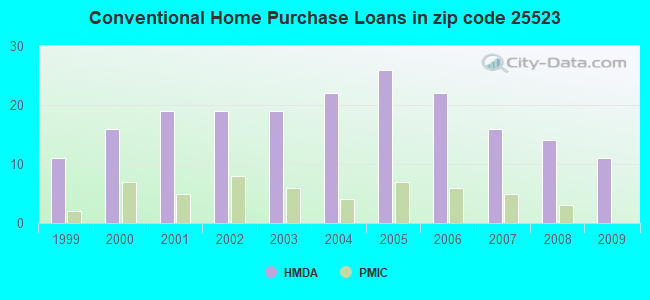
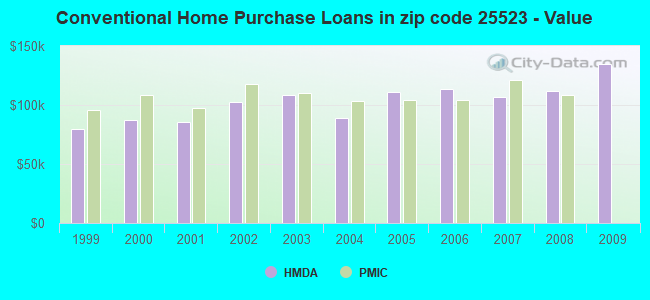
B) Conventional Home Purchase Loans
C) Refinancings
D) Home Improvement Loans
F) Non-occupant Loans on < 5 Family Dwellings (A B C & D)
G) Loans On Manufactured Home Dwelling (A B C & D)
Number
Average Value
Number
Average Value
Number
Average Value
Number
Average Value
Number
Average Value
Number
Average Value
LOANS ORIGINATED
8
$116,361
11
$134,979
28
$121,930
10
$41,093
1
$62,900
2
$63,660
APPLICATIONS APPROVED, NOT ACCEPTED
0
$0
1
$130,750
1
$109,790
0
$0
0
$0
0
$0
APPLICATIONS DENIED
2
$127,895
2
$173,825
10
$114,093
3
$36,977
1
$123,130
1
$38,500
APPLICATIONS WITHDRAWN
2
$89,200
2
$123,890
6
$115,187
0
$0
0
$0
0
$0
FILES CLOSED FOR INCOMPLETENESS
0
$0
0
$0
1
$116,650
0
$0
0
$0
0
$0
Aggregated Statistics For Year 2008 (Based on 2 partial tracts)
A) FHA, FSA/RHS & VA Home Purchase Loans
B) Conventional Home Purchase Loans
C) Refinancings
D) Home Improvement Loans
F) Non-occupant Loans on < 5 Family Dwellings (A B C & D)
G) Loans On Manufactured Home Dwelling (A B C & D)
Number
Average Value
Number
Average Value
Number
Average Value
Number
Average Value
Number
Average Value
Number
Average Value
LOANS ORIGINATED
3
$149,810
14
$111,746
17
$95,076
6
$49,428
3
$67,727
4
$45,172
APPLICATIONS APPROVED, NOT ACCEPTED
0
$0
3
$82,593
2
$95,490
0
$0
0
$0
1
$76,240
APPLICATIONS DENIED
2
$109,405
6
$66,075
12
$94,315
3
$22,490
2
$33,545
3
$50,700
APPLICATIONS WITHDRAWN
0
$0
2
$56,800
6
$81,577
0
$0
0
$0
1
$44,600
FILES CLOSED FOR INCOMPLETENESS
0
$0
0
$0
0
$0
0
$0
0
$0
0
$0
Aggregated Statistics For Year 2007 (Based on 2 partial tracts)
A) FHA, FSA/RHS & VA Home Purchase Loans
B) Conventional Home Purchase Loans
C) Refinancings
D) Home Improvement Loans
F) Non-occupant Loans on < 5 Family Dwellings (A B C & D)
G) Loans On Manufactured Home Dwelling (A B C & D)
Number
Average Value
Number
Average Value
Number
Average Value
Number
Average Value
Number
Average Value
Number
Average Value
LOANS ORIGINATED
0
$0
16
$106,426
21
$95,826
7
$30,660
2
$39,835
3
$45,997
APPLICATIONS APPROVED, NOT ACCEPTED
1
$97,210
2
$117,980
2
$97,585
2
$61,755
0
$0
1
$61,750
APPLICATIONS DENIED
0
$0
6
$72,873
12
$103,972
6
$30,687
1
$48,790
3
$45,997
APPLICATIONS WITHDRAWN
0
$0
1
$87,680
6
$94,157
1
$142,570
0
$0
0
$0
FILES CLOSED FOR INCOMPLETENESS
0
$0
0
$0
1
$79,670
0
$0
0
$0
0
$0
Aggregated Statistics For Year 2006 (Based on 2 partial tracts)
A) FHA, FSA/RHS & VA Home Purchase Loans
B) Conventional Home Purchase Loans
C) Refinancings
D) Home Improvement Loans
F) Non-occupant Loans on < 5 Family Dwellings (A B C & D)
G) Loans On Manufactured Home Dwelling (A B C & D)
Number
Average Value
Number
Average Value
Number
Average Value
Number
Average Value
Number
Average Value
Number
Average Value
LOANS ORIGINATED
5
$87,676
22
$113,563
26
$76,387
6
$30,242
2
$30,495
3
$69,887
APPLICATIONS APPROVED, NOT ACCEPTED
0
$0
4
$66,520
5
$75,630
1
$31,260
0
$0
2
$31,830
APPLICATIONS DENIED
0
$0
9
$61,712
15
$74,334
6
$30,052
2
$25,160
8
$49,842
APPLICATIONS WITHDRAWN
0
$0
2
$58,515
11
$96,235
1
$31,260
0
$0
0
$0
FILES CLOSED FOR INCOMPLETENESS
0
$0
0
$0
2
$89,775
0
$0
0
$0
0
$0
Aggregated Statistics For Year 2005 (Based on 2 partial tracts)
A) FHA, FSA/RHS & VA Home Purchase Loans
B) Conventional Home Purchase Loans
C) Refinancings
D) Home Improvement Loans
F) Non-occupant Loans on < 5 Family Dwellings (A B C & D)
G) Loans On Manufactured Home Dwelling (A B C & D)
Number
Average Value
Number
Average Value
Number
Average Value
Number
Average Value
Number
Average Value
Number
Average Value
LOANS ORIGINATED
1
$123,130
26
$111,003
24
$78,194
6
$48,285
3
$64,170
4
$57,752
APPLICATIONS APPROVED, NOT ACCEPTED
0
$0
5
$41,398
3
$36,467
0
$0
0
$0
3
$29,733
APPLICATIONS DENIED
2
$49,935
8
$101,924
17
$72,361
5
$29,048
1
$55,660
4
$48,412
APPLICATIONS WITHDRAWN
0
$0
2
$66,330
5
$99,188
0
$0
0
$0
0
$0
FILES CLOSED FOR INCOMPLETENESS
0
$0
1
$53,750
2
$77,575
0
$0
0
$0
0
$0
Aggregated Statistics For Year 2004 (Based on 2 partial tracts)
A) FHA, FSA/RHS & VA Home Purchase Loans
B) Conventional Home Purchase Loans
C) Refinancings
D) Home Improvement Loans
F) Non-occupant Loans on < 5 Family Dwellings (A B C & D)
G) Loans On Manufactured Home Dwelling (A B C & D)
Number
Average Value
Number
Average Value
Number
Average Value
Number
Average Value
Number
Average Value
Number
Average Value
LOANS ORIGINATED
3
$96,953
22
$88,802
23
$85,107
8
$21,966
4
$43,170
6
$34,690
APPLICATIONS APPROVED, NOT ACCEPTED
0
$0
3
$66,837
7
$80,270
1
$19,060
0
$0
2
$23,065
APPLICATIONS DENIED
0
$0
9
$62,093
14
$76,349
5
$20,814
1
$4,190
6
$46,062
APPLICATIONS WITHDRAWN
1
$112,450
2
$66,710
8
$116,028
1
$28,590
1
$38,120
1
$60,990
FILES CLOSED FOR INCOMPLETENESS
0
$0
0
$0
2
$93,015
1
$34,310
0
$0
0
$0
Aggregated Statistics For Year 2003 (Based on 2 partial tracts)
A) FHA, FSA/RHS & VA Home Purchase Loans
B) Conventional Home Purchase Loans
C) Refinancings
D) Home Improvement Loans
F) Non-occupant Loans on < 5 Family Dwellings (A B C & D)
Number
Average Value
Number
Average Value
Number
Average Value
Number
Average Value
Number
Average Value
LOANS ORIGINATED
4
$101,780
19
$108,261
48
$87,906
9
$26,684
2
$63,090
APPLICATIONS APPROVED, NOT ACCEPTED
0
$0
1
$112,070
7
$85,443
2
$11,055
0
$0
APPLICATIONS DENIED
0
$0
6
$31,893
19
$80,514
6
$10,610
2
$29,925
APPLICATIONS WITHDRAWN
0
$0
1
$68,620
11
$89,651
0
$0
0
$0
FILES CLOSED FOR INCOMPLETENESS
0
$0
0
$0
2
$84,245
0
$0
0
$0
Aggregated Statistics For Year 2002 (Based on 2 partial tracts)
A) FHA, FSA/RHS & VA Home Purchase Loans
B) Conventional Home Purchase Loans
C) Refinancings
D) Home Improvement Loans
F) Non-occupant Loans on < 5 Family Dwellings (A B C & D)
Number
Average Value
Number
Average Value
Number
Average Value
Number
Average Value
Number
Average Value
LOANS ORIGINATED
6
$96,253
19
$102,503
46
$82,198
11
$19,788
2
$46,890
APPLICATIONS APPROVED, NOT ACCEPTED
0
$0
4
$49,652
9
$75,859
2
$17,535
0
$0
APPLICATIONS DENIED
1
$70,140
8
$53,988
15
$79,747
6
$9,530
1
$25,540
APPLICATIONS WITHDRAWN
0
$0
1
$96,060
6
$84,118
0
$0
0
$0
FILES CLOSED FOR INCOMPLETENESS
0
$0
0
$0
2
$69,950
0
$0
0
$0
Aggregated Statistics For Year 2001 (Based on 2 partial tracts)
A) FHA, FSA/RHS & VA Home Purchase Loans
B) Conventional Home Purchase Loans
C) Refinancings
D) Home Improvement Loans
F) Non-occupant Loans on < 5 Family Dwellings (A B C & D)
Number
Average Value
Number
Average Value
Number
Average Value
Number
Average Value
Number
Average Value
LOANS ORIGINATED
4
$86,818
19
$85,750
39
$78,185
11
$22,248
1
$54,510
APPLICATIONS APPROVED, NOT ACCEPTED
0
$0
4
$56,418
6
$84,308
0
$0
0
$0
APPLICATIONS DENIED
1
$107,120
8
$57,466
16
$74,739
3
$7,243
0
$0
APPLICATIONS WITHDRAWN
0
$0
1
$64,800
9
$67,557
0
$0
1
$30,110
FILES CLOSED FOR INCOMPLETENESS
0
$0
1
$72,430
0
$0
0
$0
0
$0
Aggregated Statistics For Year 2000 (Based on 2 partial tracts)
A) FHA, FSA/RHS & VA Home Purchase Loans
B) Conventional Home Purchase Loans
C) Refinancings
D) Home Improvement Loans
F) Non-occupant Loans on < 5 Family Dwellings (A B C & D)
Number
Average Value
Number
Average Value
Number
Average Value
Number
Average Value
Number
Average Value
LOANS ORIGINATED
3
$79,163
16
$86,866
19
$56,317
8
$6,195
2
$37,360
APPLICATIONS APPROVED, NOT ACCEPTED
0
$0
2
$65,185
6
$61,373
1
$40,030
0
$0
APPLICATIONS DENIED
2
$43,840
5
$50,166
18
$53,961
2
$41,360
0
$0
APPLICATIONS WITHDRAWN
0
$0
1
$69,000
8
$56,941
0
$0
0
$0
FILES CLOSED FOR INCOMPLETENESS
1
$67,850
2
$77,195
2
$106,165
0
$0
0
$0
Aggregated Statistics For Year 1999 (Based on 1 partial tract)
Detailed PMIC statistics for the following Tracts:0207.00
2003 - 2018 National Fire Incident Reporting System (NFIRS) incidents
According to the data from the years 2003 - 2018 the average number of fires per year is 16. The highest number of fire incidents - 31 took place in 2012, and the least - 6 in 2003. The data has a growing trend.
When looking into fire subcategories, the most reports belonged to: Structure Fires (59.1%), and Outside Fires (23.0%).
Fire incident types reported to NFIRS in Zip Code 25523


 Nearest zip codes: 25521, 25510, 25571, 25573, 25526, 25540.


 According to the data from the years 2003 - 2018 the average number of fires per year is 16. The highest number of fire incidents - 31 took place in 2012, and the least - 6 in 2003. The data has a growing trend.
 When looking into fire subcategories, the most reports belonged to: Structure Fires (59.1%), and Outside Fires (23.0%).