Estimated zip code population in 2022: 971 Zip code population in 2010: 614 Zip code population in 2000: 768
Houses and condos: 302 Renter-occupied apartments: 68
% of renters here:
22%
State:
26%
March 2022 cost of living index in zip code 25214: 83.4 (less than average, U.S. average is 100)
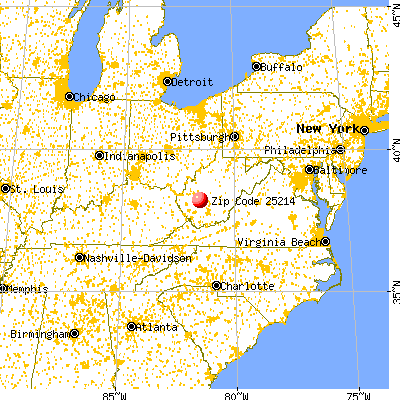
Land area: 12.7 sq. mi. Water area: 0.0 sq. mi.
Population density: 77 people per square mile
(very low).
OSM Map
General Map
Google Map
MSN Map
OSM Map
General Map
Google Map
MSN Map
OSM Map
General Map
Google Map
MSN Map
OSM Map
General Map
Google Map
MSN Map
Please wait while loading the map...
Real estate property taxes paid for housing units in 2022:
This zip code:
0.3% ($530)
West Virginia:
0.5% ($821)
Median real estate property taxes paid for housing units with mortgages in 2022: $533 (0.3%) Median real estate property taxes paid for housing units with no mortgage in 2022: $526 (0.7%)
Business Search- 14 Million verified businesses
Males: 480
(49.4%)
Females: 491
(50.6%)
For population 25 years and over in 25214:
High school or higher: 90.3%
Bachelor's degree or higher: 6.7%
Graduate or professional degree: 0.0%
Mean travel time to work (commute): 21.9 minutes
For population 15 years and over in 25214:
Never married: 29.1%
Now married: 57.9%
Separated: 0.0%
Widowed: 2.7%
Divorced: 10.3%
Zip code 25214 compared to state average:
Median household income significantly below state average.
Unemployed percentage significantly below state average.
Black race population percentage significantly below state average.
Hispanic race population percentage significantly below state average.
Foreign-born population percentage significantly below state average.
Length of stay since moving in significantly above state average.
Number of rooms per house below state average.
Number of college students significantly below state average.
Percentage of population with a bachelor's degree or higher significantly below state average.
Estimated median house/condo value in 2022: $162,866
25214:
$162,866
West Virginia:
$155,100
According to our research of West Virginia and other state lists, there was 1 registered sex offender living in 25214 zip code as of May 25, 2024. The ratio of all residents to sex offenders in zip code 25214 is 680 to 1. The ratio of registered sex offenders to all residents in this zip code is lower than the state average.
Median resident age:
This zip code:
46.7 years
West Virginia median age:
42.9 years
Average household size:
This zip code:
3.1 people
West Virginia:
2.3 people
Averages for the 2020 tax year for zip code 25214, filed in 2021:
Average Adjusted Gross Income (AGI) in 2020: $39,642 (Individual Income Tax Returns)
Here:
$39,642
State:
$56,292
Salary/wage: $36,370 (reported on 83.3% of returns)
Here:
$36,370
State:
$49,093
(% of AGI for various income ranges: 1151.4% for AGIs below $25k, 3278.3% for AGIs $25k-50k, 3743.3% for AGIs $50k-75k)
Taxable interest for individuals: $125 (reported on 16.7% of returns)
This zip code:
$125
West Virginia:
$1,141
(% of AGI for various income ranges: 7.1% for AGIs below $25k)
Earned income credit: $2,525 (reported on 16.7% of returns)
Here:
$2,525
State:
$2,258
(% of AGI for various income ranges: 144.3% for AGIs below $25k)
Percentage of individuals using paid preparers for their 2020 taxes: 91.7%
Here:
92%
State:
93%
(% for various income ranges: 90.0% for AGIs below $25k, 87.5% for AGIs $25k-50k, 150.0% for AGIs $50k-75k, 0.0% for AGIs $100k-200k)
Averages for the 2012 tax year for zip code 25214, filed in 2013:
Average Adjusted Gross Income (AGI) in 2012: $36,554 (Individual Income Tax Returns)
Here:
$36,554
State:
$48,628
Salary/wage: $34,565 (reported on 88.5% of returns)
Here:
$34,565
State:
$42,328
(% of AGI for various income ranges: 74.1% for AGIs below $25k, 77.5% for AGIs $25k-50k, 85.5% for AGIs $50k-75k, 90.8% for AGIs $75k-100k)
Taxable interest for individuals: $220 (reported on 19.2% of returns)
This zip code:
$220
West Virginia:
$1,211
(% of AGI for various income ranges: 0.4% for AGIs below $25k, 0.2% for AGIs $25k-50k)
Earned income credit: $2,300 (reported on 19.2% of returns)
Here:
$2,300
State:
$2,140
(% of AGI for various income ranges: 6.7% for AGIs below $25k)
Percentage of individuals using paid preparers for their 2012 taxes: 42.3%
Here:
42%
State:
49%
(% for various income ranges: 53.8% for AGIs below $25k, 100.0% for AGIs $50k-75k)
Averages for the 2004 tax year for zip code 25214, filed in 2005:
Average Adjusted Gross Income (AGI) in 2004: $29,122 (Individual Income Tax Returns)
Here:
$29,122
State:
$37,498
Salary/wage: $28,792 (reported on 88.9% of returns)
Here:
$28,792
State:
$33,645
(% of AGI for various income ranges: 80.4% for AGIs below $10k, 76.3% for AGIs $10k-25k, 88.5% for AGIs $25k-50k, 92.9% for AGIs $50k-75k, 94.3% for AGIs $75k-100k)
Taxable interest for individuals: $532 (reported on 29.3% of returns)
This zip code:
$532
West Virginia:
$1,465
Taxable dividends: $765 (reported on 6.3% of returns)
Here:
$765
State:
$2,913
Total itemized deductions: $12,786 (21% of AGI, reported on 5.2% of returns)
Here:
$12,786
State:
$16,976
Here:
21.4% of AGI
State:
19.0% of AGI
Total tax: $2,652 (reported on 67.0% of returns)
25214:
$2,652
State:
$5,372
(% of AGI for various income ranges: 0.8% for AGIs below $10k, 2.5% for AGIs $10k-25k, 5.6% for AGIs $25k-50k, 7.7% for AGIs $50k-75k, 10.9% for AGIs $75k-100k)
Earned income credit: $1,473 (reported on 20.4% of returns)
Here:
$1,473
State:
$1,662
Percentage of individuals using paid preparers for their 2004 taxes: 49.3%
Here:
49%
State:
55%
(% for various income ranges: 45.3% for AGIs below $10k, 54.8% for AGIs $10k-25k, 46.5% for AGIs $25k-50k, 59.5% for AGIs $50k-75k)
Household received Food Stamps/SNAP in the past 12 months: 20 Household did not receive Food Stamps/SNAP in the past 12 months: 286
Women who did not have a birth in the past 12 months: 379 (169 now married, 209 unmarried)
Housing units in zip code 25214 with a mortgage: 148 (17 second mortgage, 17 both second mortgage and home equity loan) Median monthly owner costs for units with a mortgage: $944 Median monthly owner costs for units without a mortgage: $513
Residents with income below the poverty level in 2022:
This zip code:
7.2%
Whole state:
17.9%
Residents with income below 50% of the poverty level in 2022:
This zip code:
7.2%
Whole state:
9.7%
Median number of rooms in houses and condos:
Here:
4.4
State:
6.5
Notable locations in this zip code not listed on our city pages
Cemeteries: Frye Cemetery (1), Green Cemetery (2), Cooper Cemetery (3), Wrightsville Cemetery (4), Sawmill Cemetery (5). Display/hide their locations on the map
Size of family households: 88 2-persons, 27 3-persons, 15 4-persons, 94 5-persons
Size of nonfamily households: 84 1-person
52 married couples with children.
266 single-parent households (266 men).
99.3% of residents of 25214 zip code speak English at home.
Foreign born population: 0 (0.0%)
:
0.0%
Whole state:
1.8%
87%Irish
11%American
7%English
Facilities with environmental interests located in this zip code:
EMERALD PROCESSING, LIMITED LIABILITY CO (WINIFREDE ROAD in WINIFREDE, WV)
AIR MINOR (AIRS/AFS) Business SIC classification: BITUMINOUS COAL AND LIGNITE SURFACE MINING Alternative names: WINIFREDE PROCESSING, LLC
66.9%Utility gas
31.6%Electricity
2.0%Wood
Population in 1990: 126. Population change in the 1990s: +642 (+509.5%).
Place of birth for U.S.-born residents:
This state: 770
Midwest: 144
South: 50
71% of the 25214 zip code residents lived in the same house 5 years ago. Out of people who lived in different houses, 92% lived in this county. Out of people who lived in different counties, 50% lived in West Virginia.
99% of the 25214 zip code residents lived in the same house 1 year ago. Out of people who lived in different houses, 200% moved from different state.
Private vs. public school enrollment:
Students in private schools in grades 1 to 8 (elementary and middle school):
Here:
0.0%
West Virginia:
12.2%
Students in private schools in grades 9 to 12 (high school):
Here:
0.0%
West Virginia:
8.8%
Top industries in this zip code by the number of employees in 2005:
Administrative and Support and Waste Management and Remediation Services: Remediation Services (10-19 employees: 1 establishment)
Other Services (except Public Administration): Beauty Salons (1-4: 1)
Fatal accident statistics in 2010:
Fatal accident count: 1
Vehicles involved in fatal accidents: 1
Fatal accidents caused by drunken drivers: 0
Fatalities: 1
Persons involved in fatal accidents: 2
Pedestrians involved in fatal accidents: 0
Home Mortgage Disclosure Act Aggregated Statistics For Year 2009 (Based on 2 partial tracts)
A) FHA, FSA/RHS & VA Home Purchase Loans
B) Conventional Home Purchase Loans
C) Refinancings
D) Home Improvement Loans
F) Non-occupant Loans on < 5 Family Dwellings (A B C & D)
G) Loans On Manufactured Home Dwelling (A B C & D)
Number
Average Value
Number
Average Value
Number
Average Value
Number
Average Value
Number
Average Value
Number
Average Value
LOANS ORIGINATED
3
$75,770
1
$52,910
5
$59,834
2
$37,230
1
$15,020
1
$41,800
APPLICATIONS APPROVED, NOT ACCEPTED
0
$0
2
$62,380
3
$46,050
0
$0
1
$14,700
1
$79,360
APPLICATIONS DENIED
1
$37,230
4
$44,662
9
$79,291
7
$21,369
1
$32,990
4
$39,518
APPLICATIONS WITHDRAWN
0
$0
1
$35,930
2
$91,775
0
$0
0
$0
0
$0
FILES CLOSED FOR INCOMPLETENESS
1
$45,400
1
$34,950
0
$0
0
$0
0
$0
1
$59,440
Aggregated Statistics For Year 2008 (Based on 2 partial tracts)
A) FHA, FSA/RHS & VA Home Purchase Loans
B) Conventional Home Purchase Loans
C) Refinancings
D) Home Improvement Loans
F) Non-occupant Loans on < 5 Family Dwellings (A B C & D)
G) Loans On Manufactured Home Dwelling (A B C & D)
Number
Average Value
Number
Average Value
Number
Average Value
Number
Average Value
Number
Average Value
Number
Average Value
LOANS ORIGINATED
1
$98,960
4
$83,528
8
$60,012
3
$17,853
2
$30,375
0
$0
APPLICATIONS APPROVED, NOT ACCEPTED
0
$0
1
$61,400
0
$0
2
$30,535
1
$34,290
0
$0
APPLICATIONS DENIED
2
$67,445
2
$46,050
13
$77,278
4
$27,925
1
$25,470
2
$52,420
APPLICATIONS WITHDRAWN
0
$0
1
$132,930
2
$98,470
0
$0
1
$28,090
0
$0
FILES CLOSED FOR INCOMPLETENESS
0
$0
0
$0
0
$0
0
$0
0
$0
0
$0
Aggregated Statistics For Year 2007 (Based on 2 partial tracts)
A) FHA, FSA/RHS & VA Home Purchase Loans
B) Conventional Home Purchase Loans
C) Refinancings
D) Home Improvement Loans
F) Non-occupant Loans on < 5 Family Dwellings (A B C & D)
G) Loans On Manufactured Home Dwelling (A B C & D)
Number
Average Value
Number
Average Value
Number
Average Value
Number
Average Value
Number
Average Value
Number
Average Value
LOANS ORIGINATED
2
$62,870
10
$70,252
8
$58,339
4
$29,068
4
$36,415
4
$51,112
APPLICATIONS APPROVED, NOT ACCEPTED
0
$0
3
$59,660
4
$46,295
3
$18,400
0
$0
1
$105,170
APPLICATIONS DENIED
1
$78,380
4
$60,910
14
$69,496
6
$23,950
1
$72,830
3
$60,203
APPLICATIONS WITHDRAWN
1
$39,190
1
$53,890
3
$80,453
0
$0
0
$0
1
$39,190
FILES CLOSED FOR INCOMPLETENESS
0
$0
0
$0
1
$38,870
0
$0
0
$0
0
$0
Aggregated Statistics For Year 2006 (Based on 2 partial tracts)
B) Conventional Home Purchase Loans
C) Refinancings
D) Home Improvement Loans
F) Non-occupant Loans on < 5 Family Dwellings (A B C & D)
G) Loans On Manufactured Home Dwelling (A B C & D)
Number
Average Value
Number
Average Value
Number
Average Value
Number
Average Value
Number
Average Value
LOANS ORIGINATED
8
$61,034
11
$65,261
6
$23,733
3
$83,500
4
$41,722
APPLICATIONS APPROVED, NOT ACCEPTED
2
$71,200
4
$37,805
2
$12,245
1
$29,070
3
$54,760
APPLICATIONS DENIED
7
$58,461
10
$71,427
8
$41,192
1
$15,350
7
$45,071
APPLICATIONS WITHDRAWN
1
$44,090
4
$72,422
0
$0
0
$0
0
$0
FILES CLOSED FOR INCOMPLETENESS
1
$89,810
0
$0
1
$30,050
0
$0
0
$0
Aggregated Statistics For Year 2005 (Based on 2 partial tracts)
A) FHA, FSA/RHS & VA Home Purchase Loans
B) Conventional Home Purchase Loans
C) Refinancings
D) Home Improvement Loans
F) Non-occupant Loans on < 5 Family Dwellings (A B C & D)
G) Loans On Manufactured Home Dwelling (A B C & D)
Number
Average Value
Number
Average Value
Number
Average Value
Number
Average Value
Number
Average Value
Number
Average Value
LOANS ORIGINATED
1
$47,030
11
$48,070
15
$56,937
6
$18,997
1
$81,650
4
$40,908
APPLICATIONS APPROVED, NOT ACCEPTED
0
$0
7
$57,621
6
$37,178
2
$14,045
2
$47,685
6
$40,770
APPLICATIONS DENIED
2
$24,005
12
$51,739
16
$61,789
12
$23,407
2
$44,420
16
$44,316
APPLICATIONS WITHDRAWN
0
$0
0
$0
5
$80,932
1
$14,700
0
$0
0
$0
FILES CLOSED FOR INCOMPLETENESS
0
$0
0
$0
1
$44,740
0
$0
0
$0
0
$0
Aggregated Statistics For Year 2004 (Based on 2 partial tracts)
A) FHA, FSA/RHS & VA Home Purchase Loans
B) Conventional Home Purchase Loans
C) Refinancings
D) Home Improvement Loans
F) Non-occupant Loans on < 5 Family Dwellings (A B C & D)
G) Loans On Manufactured Home Dwelling (A B C & D)
Number
Average Value
Number
Average Value
Number
Average Value
Number
Average Value
Number
Average Value
Number
Average Value
LOANS ORIGINATED
2
$53,400
8
$46,622
15
$65,799
3
$25,910
1
$66,300
4
$41,560
APPLICATIONS APPROVED, NOT ACCEPTED
0
$0
4
$39,192
5
$52,060
1
$15,020
0
$0
2
$18,455
APPLICATIONS DENIED
1
$27,430
12
$48,418
20
$52,011
11
$24,109
1
$40,820
11
$42,043
APPLICATIONS WITHDRAWN
0
$0
2
$30,045
7
$83,843
0
$0
0
$0
2
$38,050
FILES CLOSED FOR INCOMPLETENESS
0
$0
0
$0
0
$0
0
$0
0
$0
0
$0
Aggregated Statistics For Year 2003 (Based on 2 partial tracts)
B) Conventional Home Purchase Loans
C) Refinancings
D) Home Improvement Loans
F) Non-occupant Loans on < 5 Family Dwellings (A B C & D)
Number
Average Value
Number
Average Value
Number
Average Value
Number
Average Value
LOANS ORIGINATED
6
$52,093
22
$63,360
8
$11,022
3
$33,640
APPLICATIONS APPROVED, NOT ACCEPTED
6
$40,172
8
$49,521
2
$10,450
1
$34,950
APPLICATIONS DENIED
10
$39,486
20
$59,098
12
$11,839
2
$47,195
APPLICATIONS WITHDRAWN
1
$55,850
9
$85,279
0
$0
0
$0
FILES CLOSED FOR INCOMPLETENESS
1
$61,730
2
$85,245
0
$0
0
$0
Aggregated Statistics For Year 2002 (Based on 2 partial tracts)
A) FHA, FSA/RHS & VA Home Purchase Loans
B) Conventional Home Purchase Loans
C) Refinancings
D) Home Improvement Loans
F) Non-occupant Loans on < 5 Family Dwellings (A B C & D)
Number
Average Value
Number
Average Value
Number
Average Value
Number
Average Value
Number
Average Value
LOANS ORIGINATED
2
$57,645
10
$49,545
22
$59,500
6
$12,847
4
$57,728
APPLICATIONS APPROVED, NOT ACCEPTED
0
$0
3
$39,847
6
$57,863
1
$14,700
0
$0
APPLICATIONS DENIED
1
$35,930
9
$38,611
21
$57,341
9
$11,141
1
$21,230
APPLICATIONS WITHDRAWN
0
$0
1
$42,460
7
$58,601
0
$0
0
$0
FILES CLOSED FOR INCOMPLETENESS
0
$0
0
$0
1
$41,800
0
$0
0
$0
Aggregated Statistics For Year 2001 (Based on 2 partial tracts)
A) FHA, FSA/RHS & VA Home Purchase Loans
B) Conventional Home Purchase Loans
C) Refinancings
D) Home Improvement Loans
F) Non-occupant Loans on < 5 Family Dwellings (A B C & D)
Number
Average Value
Number
Average Value
Number
Average Value
Number
Average Value
Number
Average Value
LOANS ORIGINATED
1
$93,730
16
$45,398
16
$53,787
6
$6,042
4
$29,312
APPLICATIONS APPROVED, NOT ACCEPTED
0
$0
8
$38,948
7
$39,286
1
$12,410
1
$14,040
APPLICATIONS DENIED
0
$0
15
$40,281
16
$45,357
3
$4,247
1
$42,780
APPLICATIONS WITHDRAWN
1
$36,910
2
$54,540
13
$53,035
1
$4,250
1
$20,250
FILES CLOSED FOR INCOMPLETENESS
0
$0
0
$0
2
$50,295
0
$0
0
$0
Aggregated Statistics For Year 2000 (Based on 2 partial tracts)
A) FHA, FSA/RHS & VA Home Purchase Loans
B) Conventional Home Purchase Loans
C) Refinancings
D) Home Improvement Loans
F) Non-occupant Loans on < 5 Family Dwellings (A B C & D)
Number
Average Value
Number
Average Value
Number
Average Value
Number
Average Value
Number
Average Value
LOANS ORIGINATED
1
$77,400
12
$43,764
9
$43,728
8
$5,756
1
$36,580
APPLICATIONS APPROVED, NOT ACCEPTED
1
$40,170
5
$36,840
5
$43,242
2
$10,780
0
$0
APPLICATIONS DENIED
2
$24,660
28
$32,322
18
$43,583
7
$11,897
2
$20,740
APPLICATIONS WITHDRAWN
0
$0
1
$37,230
8
$41,641
1
$35,600
0
$0
FILES CLOSED FOR INCOMPLETENESS
0
$0
1
$8,490
0
$0
0
$0
0
$0
Aggregated Statistics For Year 1999 (Based on 1 partial tract)
A) FHA, FSA/RHS & VA Home Purchase Loans
B) Conventional Home Purchase Loans
C) Refinancings
D) Home Improvement Loans
F) Non-occupant Loans on < 5 Family Dwellings (A B C & D)


 Nearest zip codes: 25035, 25315, 25134, 25015, 25049, 25024.


