Estimated zip code population in 2022: 2,802 Zip code population in 2010: 2,503 Zip code population in 2000: 3,340
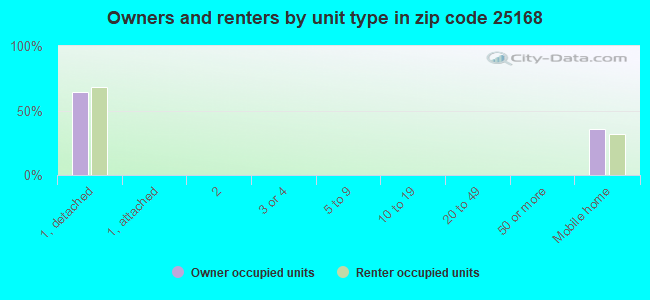
Houses and condos: 1,330 Renter-occupied apartments: 158
% of renters here:
14%
State:
26%
March 2022 cost of living index in zip code 25168: 85.1 (less than average, U.S. average is 100)
Land area: 32.2 sq. mi. Water area: 0.4 sq. mi.
Population density: 87 people per square mile
(very low).
OSM Map
General Map
Google Map
MSN Map
OSM Map
General Map
Google Map
MSN Map
OSM Map
General Map
Google Map
MSN Map
OSM Map
General Map
Google Map
MSN Map
Please wait while loading the map...
Real estate property taxes paid for housing units in 2022:
This zip code:
0.7% ($1,048)
West Virginia:
0.5% ($821)
Median real estate property taxes paid for housing units with mortgages in 2022: $1,183 (0.6%) Median real estate property taxes paid for housing units with no mortgage in 2022: $918 (0.7%)
Business Search- 14 Million verified businesses
Males: 1,554
(55.5%)
Females: 1,246
(44.5%)
For population 25 years and over in 25168:
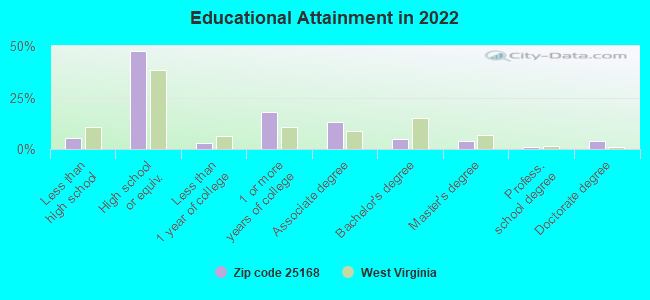
High school or higher: 93.0%
Bachelor's degree or higher: 13.2%
Graduate or professional degree: 8.2%
Unemployed: 5.0%
Mean travel time to work (commute): 31.3 minutes
For population 15 years and over in 25168:
Never married: 17.4%
Now married: 64.8%
Separated: 2.3%
Widowed: 4.3%
Divorced: 11.2%
Zip code 25168 compared to state average:
Median household income above state average.
Black race population percentage significantly below state average.
Hispanic race population percentage significantly below state average.
Foreign-born population percentage significantly below state average.
Renting percentage below state average.
Length of stay since moving in significantly above state average.
House age below state average.
Percentage of population with a bachelor's degree or higher below state average.
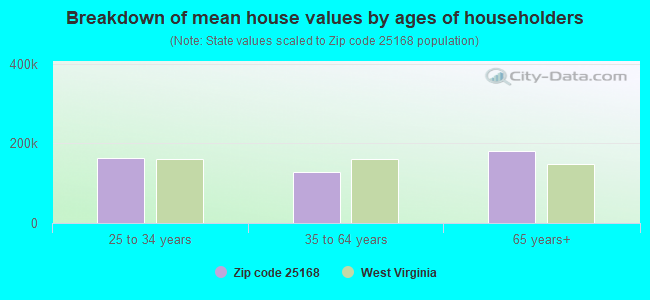
Estimated median house/condo value in 2022: $160,844
25168:
$160,844
West Virginia:
$155,100
According to our research of West Virginia and other state lists, there were 4 registered sex offenders living in 25168 zip code as of May 22, 2024. The ratio of all residents to sex offenders in zip code 25168 is 563 to 1. The ratio of registered sex offenders to all residents in this zip code is lower than the state average.
Median resident age:
This zip code:
44.9 years
West Virginia median age:
42.9 years
Average household size:
This zip code:
2.5 people
West Virginia:
2.3 people
Averages for the 2020 tax year for zip code 25168, filed in 2021:
Average Adjusted Gross Income (AGI) in 2020: $54,071 (Individual Income Tax Returns)
Here:
$54,071
State:
$56,292
Salary/wage: $51,804 (reported on 81.7% of returns)
Here:
$51,804
State:
$49,093
(% of AGI for various income ranges: 1099.7% for AGIs below $25k, 3167.9% for AGIs $25k-50k, 6226.9% for AGIs $50k-75k, 8803.6% for AGIs $75k-100k, 19383.6% for AGIs $100k-200k)
Taxable interest for individuals: $782 (reported on 26.2% of returns)
This zip code:
$782
West Virginia:
$1,141
(% of AGI for various income ranges: 14.1% for AGIs below $25k, 15.0% for AGIs $25k-50k, 15.6% for AGIs $50k-75k, 62.7% for AGIs $75k-100k, 70.0% for AGIs $100k-200k)
Ordinary dividends: $1,492 (reported on 10.3% of returns)
Here:
$1,492
State:
$5,456
(% of AGI for various income ranges: 19.1% for AGIs below $25k, 43.1% for AGIs $50k-75k, 28.2% for AGIs $75k-100k, 30.0% for AGIs $100k-200k)
Net capital gain/loss in AGI: +$2,989 (reported on 7.1% of returns)
Here:
+$2,989
State:
+$11,656
(% of AGI for various income ranges: 1.6% for AGIs below $25k, 110.6% for AGIs $50k-75k, 79.1% for AGIs $100k-200k)
Profit/loss from business: +$11,280 (reported on 7.9% of returns)
Here:
+$11,280
State:
+$12,084
(% of AGI for various income ranges: 74.7% for AGIs below $25k, 55.0% for AGIs $25k-50k, 161.2% for AGIs $50k-75k, 433.6% for AGIs $100k-200k)
Taxable individual retirement arrangement distribution: $13,475 (reported on 9.5% of returns)
25168:
$13,475
West Virginia:
$15,311
(% of AGI for various income ranges: 87.8% for AGIs below $25k, 177.5% for AGIs $25k-50k, 762.7% for AGIs $75k-100k)
Total itemized deductions: $25,300 (reported on 1.6% of returns)
Here:
$25,300
State:
$31,950
(% of AGI for various income ranges: 180.7% for AGIs $25k-50k)
Taxes paid: $8,150 (reported on 1.6% of returns)
25168:
$8,150
State:
$7,665
(% of AGI for various income ranges: 101.9% for AGIs $50k-75k)
Earned income credit: $2,405 (reported on 15.1% of returns)
Here:
$2,405
State:
$2,258
(% of AGI for various income ranges: 82.2% for AGIs below $25k, 69.3% for AGIs $25k-50k)
Percentage of individuals using paid preparers for their 2020 taxes: 94.4%
Here:
94%
State:
93%
(% for various income ranges: 93.0% for AGIs below $25k, 93.9% for AGIs $25k-50k, 95.0% for AGIs $50k-75k, 92.9% for AGIs $75k-100k, 100.0% for AGIs $100k-200k)
Averages for the 2012 tax year for zip code 25168, filed in 2013:
Average Adjusted Gross Income (AGI) in 2012: $48,257 (Individual Income Tax Returns)
Here:
$48,257
State:
$48,628
Salary/wage: $44,808 (reported on 83.3% of returns)
Here:
$44,808
State:
$42,328
(% of AGI for various income ranges: 68.1% for AGIs below $25k, 78.2% for AGIs $25k-50k, 82.4% for AGIs $50k-75k, 85.2% for AGIs $75k-100k, 71.5% for AGIs $100k-200k)
Taxable interest for individuals: $837 (reported on 30.7% of returns)
This zip code:
$837
West Virginia:
$1,211
(% of AGI for various income ranges: 1.7% for AGIs below $25k, 0.9% for AGIs $25k-50k, 0.4% for AGIs $50k-75k, 0.4% for AGIs $75k-100k, 0.2% for AGIs $100k-200k)
Ordinary dividends: $1,308 (reported on 10.5% of returns)
Here:
$1,308
State:
$4,262
(% of AGI for various income ranges: 0.4% for AGIs below $25k, 0.4% for AGIs $25k-50k, 0.2% for AGIs $50k-75k, 0.7% for AGIs $75k-100k)
Net capital gain/loss in AGI: +$540 (reported on 4.4% of returns)
Here:
+$540
State:
+$8,875
Profit/loss from business: +$9,345 (reported on 9.6% of returns)
Here:
+$9,345
State:
+$13,636
(% of AGI for various income ranges: 4.9% for AGIs below $25k, 2.6% for AGIs $25k-50k, 2.6% for AGIs $50k-75k, 1.8% for AGIs $75k-100k)
Taxable individual retirement arrangement distribution: $9,500 (reported on 8.8% of returns)
25168:
$9,500
West Virginia:
$11,787
(% of AGI for various income ranges: 3.5% for AGIs below $25k, 2.2% for AGIs $25k-50k, 5.2% for AGIs $75k-100k)
Total itemized deductions: $18,465 (19% of AGI, reported on 17.5% of returns)
Here:
$18,465
State:
$21,148
Here:
18.7% of AGI
State:
18.1% of AGI
(% of AGI for various income ranges: 5.9% for AGIs $25k-50k, 5.7% for AGIs $50k-75k, 5.8% for AGIs $75k-100k, 10.5% for AGIs $100k-200k)
Charity contributions: $3,145 (reported on 9.6% of returns)
Here:
$3,145
State:
$4,508
(% of AGI for various income ranges: 0.9% for AGIs below $25k, 0.7% for AGIs $50k-75k, 0.8% for AGIs $75k-100k, 0.8% for AGIs $100k-200k)
Taxes paid: $6,953 (reported on 16.7% of returns)
25168:
$6,953
State:
$8,103
(% of AGI for various income ranges: 0.8% for AGIs $25k-50k, 1.4% for AGIs $50k-75k, 1.9% for AGIs $75k-100k, 5.1% for AGIs $100k-200k)
Earned income credit: $2,019 (reported on 18.4% of returns)
Here:
$2,019
State:
$2,140
(% of AGI for various income ranges: 5.1% for AGIs below $25k, 1.4% for AGIs $25k-50k)
Percentage of individuals using paid preparers for their 2012 taxes: 53.5%
Here:
54%
State:
49%
(% for various income ranges: 52.4% for AGIs below $25k, 54.8% for AGIs $25k-50k, 47.4% for AGIs $50k-75k, 58.3% for AGIs $75k-100k, 60.0% for AGIs $100k-200k)
Averages for the 2004 tax year for zip code 25168, filed in 2005:
Average Adjusted Gross Income (AGI) in 2004: $36,707 (Individual Income Tax Returns)
Here:
$36,707
State:
$37,498
Salary/wage: $35,456 (reported on 87.2% of returns)
Here:
$35,456
State:
$33,645
(% of AGI for various income ranges: 83.7% for AGIs below $10k, 72.9% for AGIs $10k-25k, 87.4% for AGIs $25k-50k, 87.3% for AGIs $50k-75k, 89.6% for AGIs $75k-100k, 76.1% for AGIs over 100k)
Taxable interest for individuals: $977 (reported on 41.6% of returns)
This zip code:
$977
West Virginia:
$1,465
(% of AGI for various income ranges: 2.2% for AGIs below $10k, 1.6% for AGIs $10k-25k, 1.3% for AGIs $25k-50k, 1.0% for AGIs $50k-75k, 0.3% for AGIs $75k-100k, 1.3% for AGIs over 100k)
Taxable dividends: $623 (reported on 12.6% of returns)
Here:
$623
State:
$2,913
(% of AGI for various income ranges: 0.5% for AGIs $10k-25k, 0.1% for AGIs $25k-50k, 0.2% for AGIs $50k-75k, 0.0% for AGIs $75k-100k, 0.5% for AGIs over 100k)
Net capital gain/loss: +$2,373 (reported on 8.0% of returns)
Here:
+$2,373
State:
+$6,331
(% of AGI for various income ranges: -0.2% for AGIs $10k-25k, 0.0% for AGIs $25k-50k, 0.5% for AGIs $50k-75k, -0.0% for AGIs $75k-100k, 3.0% for AGIs over 100k)
Profit/loss from business: +$6,603 (reported on 12.7% of returns)
Here:
+$6,603
State:
+$11,074
(% of AGI for various income ranges: 8.1% for AGIs below $10k, 5.5% for AGIs $10k-25k, 2.7% for AGIs $25k-50k, 2.2% for AGIs $50k-75k)
IRA payment deduction: $1,588 (reported on 1.6% of returns)
25168:
$1,588
West Virginia:
$2,796
Total itemized deductions: $14,444 (20% of AGI, reported on 15.5% of returns)
Here:
$14,444
State:
$16,976
Here:
19.8% of AGI
State:
19.0% of AGI
(% of AGI for various income ranges: 2.4% for AGIs $10k-25k, 4.1% for AGIs $25k-50k, 6.0% for AGIs $50k-75k, 9.7% for AGIs $75k-100k, 11.1% for AGIs over 100k)
Charity contributions deductions: $2,283 (3% of AGI, reported on 10.9% of returns)
Here:
$2,283
State:
$3,529
Here:
3.0% of AGI
State:
3.7% of AGI
(% of AGI for various income ranges: 0.6% for AGIs $25k-50k, 0.5% for AGIs $50k-75k, 1.0% for AGIs $75k-100k, 1.6% for AGIs over 100k)
Total tax: $4,151 (reported on 75.7% of returns)
25168:
$4,151
State:
$5,372
(% of AGI for various income ranges: 2.0% for AGIs below $10k, 4.1% for AGIs $10k-25k, 6.2% for AGIs $25k-50k, 8.3% for AGIs $50k-75k, 11.1% for AGIs $75k-100k, 16.5% for AGIs over 100k)
Earned income credit: $1,814 (reported on 18.8% of returns)
Here:
$1,814
State:
$1,662
Percentage of individuals using paid preparers for their 2004 taxes: 56.6%
Here:
57%
State:
55%
(% for various income ranges: 45.5% for AGIs below $10k, 59.4% for AGIs $10k-25k, 62.3% for AGIs $25k-50k, 52.6% for AGIs $50k-75k, 51.5% for AGIs $75k-100k, 77.1% for AGIs over 100k)
Household received Food Stamps/SNAP in the past 12 months: 177 Household did not receive Food Stamps/SNAP in the past 12 months: 953
Women who had a birth in the past 12 months: 43 (44 now married, 0 unmarried) Women who did not have a birth in the past 12 months: 544 (428 now married, 114 unmarried)
Housing units in zip code 25168 with a mortgage: 437 (12 second mortgage, 12 both second mortgage and home equity loan) Houses without a mortgage: 41
Median monthly owner costs for units with a mortgage: $1,113 Median monthly owner costs for units without a mortgage: $370
Residents with income below the poverty level in 2022:
This zip code:
14.2%
Whole state:
17.9%
Residents with income below 50% of the poverty level in 2022:
This zip code:
3.1%
Whole state:
9.7%
Median number of rooms in houses and condos:
Here:
6.7
State:
6.5
Median number of rooms in apartments:
Here:
5.6
State:
4.7
Notable locations in this zip code not listed on our city pages
Notable locations in zip code 25168: Bronco Junction Asthmatic Camp (A), Johnson Shoal Light (B), Route 34 Volunteer Fire Department (C). Display/hide their locations on the map
Churches in zip code 25168 include: Wade Chapel (A), Lone Oak Church (B), Shiloh Church (C), Riverside Church (D), New Antioch Church (E). Display/hide their locations on the map
Cemeteries: Antioch Cemetery (1), Grandview Cemetery (2), Shiloh Cemetery (3), Old Antioch Cemetery (4), Giles-Stern Cemetery (5), Wade Chapel Cemetery (6). Display/hide their locations on the map
Streams, rivers, and creeks: Tom Lick Run (A), Sycamore Branch (B), Saltlick Creek (C), Little Buffalo Creek (D), Limekiln Branch (E), Hedrick Branch (F), Gumlick Run (G), Bucklick Creek (H). Display/hide their locations on the map
Size of family households: 499 2-persons, 163 3-persons, 181 4-persons, 13 6-persons, 20 7-or-more-persons
Size of nonfamily households: 130 1-person, 102 2-persons, 10 4-persons
440 married couples with children.
152 single-parent households (13 men, 139 women).
99.9% of residents of 25168 zip code speak English at home.
Foreign born population: 0 (0.0%)
:
0.0%
Whole state:
1.8%
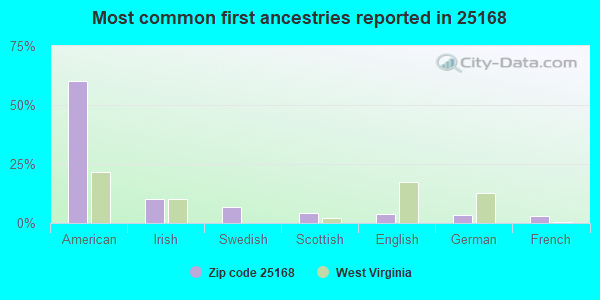
60%American
10%Irish
7%Swedish
4%Scottish
4%English
3%German
3%French
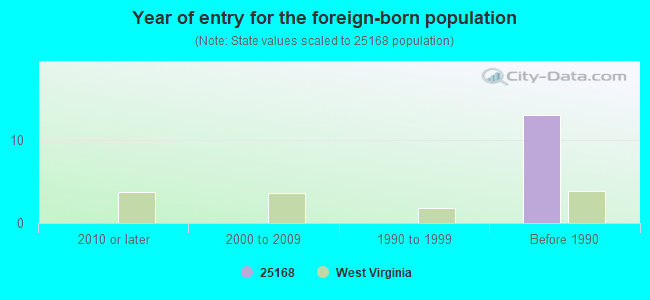
Year of entry for the foreign-born population
02010 or later
02000 to 2009
01990 to 1999
13Before 1990
Facilities with environmental interests located in this zip code:
CONFIDENCE ELEMENTARY SCHOOL (HC-63, BOX 163 in RED HOUSE, WV)
(Geographic Names Information System) (National Center for Education Statistics) - STATE ID-72210 Organizations: PUTNAM COUNTY SCHOOL DISTRICT (SCHOOL DISTRICT)
A C F INDUSTRIES SHIPPERS CAR LINE DIV (W V RT 62 in RED HOUSE, WV)
(Resource Conservation and Recovery Act (tracking hazardous waste)) Business NAICS classification: MILITARY ARMORED VEHICLE, TANK, AND TANK COMPONENT MANUFACTURING. Organizations: OPERNAME (CONTACT/OPERATOR)
, ACF INDUSTRIES INC (CONTACT/OWNER)
COSSIN'S CAR WASH (ROUTE 1, BOX 109-C in RED HOUSE, WV)
National Pollutant Discharge Elimination System NON-MAJOR (Tracking pollutant discharge elimination systems) - permit Business SIC classification: CARWASHES Organizations: COSSIN, DANNY L. (CONTACT/OWNER)
Alternative names: COSSIN, DANNY L.
CONTROLLED HUMIDITY STORAGE BUILDING (106 ARMY/NAVY DRIVE in RED HOUSE, WV) . Federal Facility. UNDETERMINED OR UNKNOWN AGENCY AFFILIATION
Conditionally Exempt Small Quantity Generators, less than 100 kg/month of hazardous waste (Resource Conservation and Recovery Act (tracking hazardous waste)) Organizations: FACILITIES MANAGEMENT OFFICE (CONTACT/OPERATOR)
, UNITED STATES OF AMERICA (CONTACT/OWNER)
ELEANOR MAINTENANCE FACILITY (110 ARMY/NAVY DRIVE in RED HOUSE, WV)
Small Quantity Generators, between 100 kg and 1000 kg of hazardous waste/month (Resource Conservation and Recovery Act (tracking hazardous waste)) Organizations: DIVISION OF ENGINEERING & FACILITIES (CONTACT/OPERATOR)
, UNITED STATES OF AMERICA (CONTACT/OWNER)
Housing units lacking complete plumbing facilities: 2.5% Housing units lacking complete kitchen facilities: 1.3%
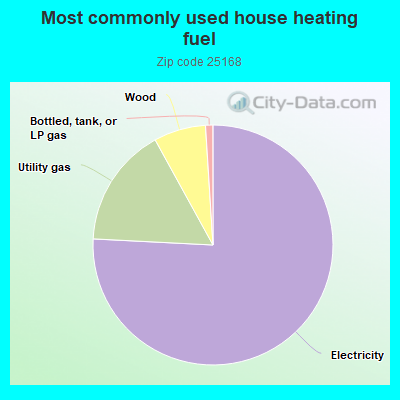
75.9%Electricity
16.2%Utility gas
7.0%Wood
1.0%Bottled, tank, or LP gas
Population in 1990: 3,472.
Place of birth for U.S.-born residents:
This state: 2,262
Northeast: 178
Midwest: 121
South: 196
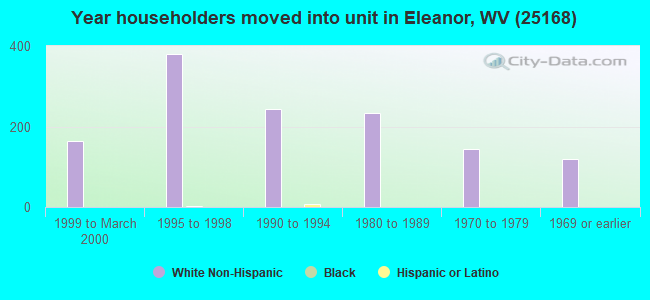
68% of the 25168 zip code residents lived in the same house 5 years ago. Out of people who lived in different houses, 66% lived in this county. Out of people who lived in different counties, 50% lived in West Virginia.
99% of the 25168 zip code residents lived in the same house 1 year ago. Out of people who lived in different houses, 127% moved from this county.
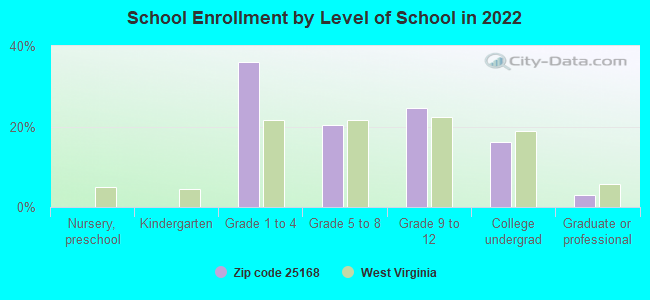
Private vs. public school enrollment:
Students in private schools in grades 1 to 8 (elementary and middle school):
Here:
0.0%
West Virginia:
12.2%
Students in private schools in grades 9 to 12 (high school):
Here:
0.0%
West Virginia:
8.8%
Students in private undergraduate colleges: 11
Here:
14.0%
West Virginia:
17.3%
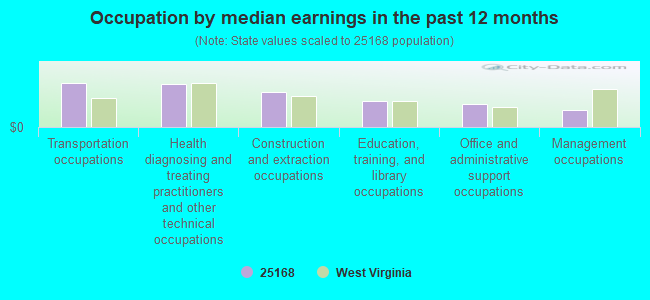
Occupation by median earnings in the past 12 months ($)
61,781Transportation occupations
61,459Health diagnosing and treating practitioners and other technical occupations
49,722Construction and extraction occupations
36,869Education, training, and library occupations
31,988Office and administrative support occupations
23,878Management occupations
Top industries in this zip code by the number of employees in 2005:
Administrative and Support and Waste Management and Remediation Services: Janitorial Services (10-19 employees: 1 establishment)
Administrative and Support and Waste Management and Remediation Services: Solid Waste Collection (10-19: 1)
Information: Cable and Other Program Distribution (10-19: 1)
Construction: Plumbing, Heating, and Air-Conditioning Contractors (5-9: 1)
Other Services (except Public Administration): Cemeteries and Crematories (5-9: 1)
Construction: Commercial and Institutional Building Construction (5-9: 1)
Construction: Electrical Contractors (5-9: 1)
Other Services (except Public Administration): Professional Organizations (1-4: 1)
Fatal accident statistics in 2014:
Fatal accident count: 3
Vehicles involved in fatal accidents: 5
Fatal accidents caused by drunken drivers: 0
Fatalities: 3
Persons involved in fatal accidents: 8
Pedestrians involved in fatal accidents: 0
Fatal accident statistics in 2013:
Fatal accident count: 1
Vehicles involved in fatal accidents: 1
Fatal accidents caused by drunken drivers: 1
Fatalities: 1
Persons involved in fatal accidents: 1
Pedestrians involved in fatal accidents: 0
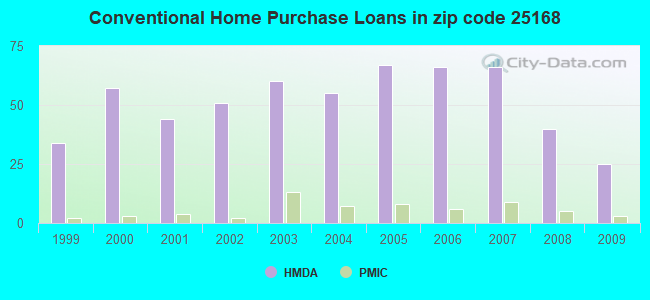
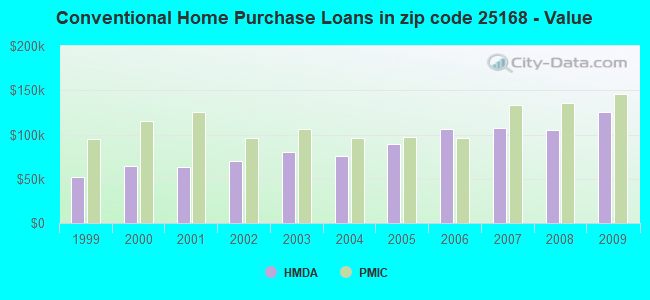
Home Mortgage Disclosure Act Aggregated Statistics For Year 2009 (Based on 4 partial tracts)
A) FHA, FSA/RHS & VA Home Purchase Loans
B) Conventional Home Purchase Loans
C) Refinancings
D) Home Improvement Loans
F) Non-occupant Loans on < 5 Family Dwellings (A B C & D)
G) Loans On Manufactured Home Dwelling (A B C & D)
Number
Average Value
Number
Average Value
Number
Average Value
Number
Average Value
Number
Average Value
Number
Average Value
LOANS ORIGINATED
15
$120,203
25
$125,119
93
$117,256
14
$39,560
7
$83,423
16
$56,182
APPLICATIONS APPROVED, NOT ACCEPTED
1
$71,140
1
$42,800
7
$127,177
2
$40,175
1
$98,400
1
$42,800
APPLICATIONS DENIED
6
$112,377
10
$37,077
28
$116,983
6
$48,280
6
$36,277
11
$40,568
APPLICATIONS WITHDRAWN
3
$80,127
4
$123,712
18
$102,455
2
$134,015
1
$75,070
4
$45,558
FILES CLOSED FOR INCOMPLETENESS
1
$76,470
0
$0
3
$116,633
1
$41,760
0
$0
1
$41,760
Aggregated Statistics For Year 2008 (Based on 4 partial tracts)
A) FHA, FSA/RHS & VA Home Purchase Loans
B) Conventional Home Purchase Loans
C) Refinancings
D) Home Improvement Loans
F) Non-occupant Loans on < 5 Family Dwellings (A B C & D)
G) Loans On Manufactured Home Dwelling (A B C & D)
Number
Average Value
Number
Average Value
Number
Average Value
Number
Average Value
Number
Average Value
Number
Average Value
LOANS ORIGINATED
11
$130,089
40
$105,028
71
$97,255
17
$34,832
7
$90,107
20
$53,184
APPLICATIONS APPROVED, NOT ACCEPTED
2
$132,065
5
$87,960
6
$62,650
4
$45,955
0
$0
6
$64,702
APPLICATIONS DENIED
3
$146,843
19
$74,168
40
$87,508
10
$43,263
2
$86,130
20
$59,938
APPLICATIONS WITHDRAWN
1
$99,590
5
$95,598
8
$107,470
1
$73,280
1
$16,180
1
$2,090
FILES CLOSED FOR INCOMPLETENESS
0
$0
1
$37,350
2
$91,280
0
$0
0
$0
1
$30,800
Aggregated Statistics For Year 2007 (Based on 4 partial tracts)
A) FHA, FSA/RHS & VA Home Purchase Loans
B) Conventional Home Purchase Loans
C) Refinancings
D) Home Improvement Loans
E) Loans on Dwellings For 5+ Families
F) Non-occupant Loans on < 5 Family Dwellings (A B C & D)
G) Loans On Manufactured Home Dwelling (A B C & D)
Number
Average Value
Number
Average Value
Number
Average Value
Number
Average Value
Number
Average Value
Number
Average Value
Number
Average Value
LOANS ORIGINATED
6
$121,548
66
$107,402
54
$82,049
30
$29,375
1
$107,010
6
$77,552
24
$41,826
APPLICATIONS APPROVED, NOT ACCEPTED
1
$16,600
9
$84,417
10
$135,879
2
$16,210
0
$0
0
$0
4
$58,740
APPLICATIONS DENIED
1
$157,120
25
$83,282
39
$96,959
9
$51,544
0
$0
1
$67,340
16
$61,852
APPLICATIONS WITHDRAWN
2
$68,195
5
$90,446
12
$100,752
1
$24,530
0
$0
2
$49,230
3
$36,267
FILES CLOSED FOR INCOMPLETENESS
0
$0
1
$206,750
2
$130,720
0
$0
0
$0
0
$0
0
$0
Aggregated Statistics For Year 2006 (Based on 4 partial tracts)
A) FHA, FSA/RHS & VA Home Purchase Loans
B) Conventional Home Purchase Loans
C) Refinancings
D) Home Improvement Loans
E) Loans on Dwellings For 5+ Families
F) Non-occupant Loans on < 5 Family Dwellings (A B C & D)
G) Loans On Manufactured Home Dwelling (A B C & D)
Number
Average Value
Number
Average Value
Number
Average Value
Number
Average Value
Number
Average Value
Number
Average Value
Number
Average Value
LOANS ORIGINATED
5
$98,960
66
$105,763
91
$78,447
25
$33,039
1
$167,040
14
$96,497
28
$45,069
APPLICATIONS APPROVED, NOT ACCEPTED
2
$54,240
11
$65,793
15
$54,127
4
$18,652
0
$0
3
$41,413
11
$45,745
APPLICATIONS DENIED
1
$16,180
24
$55,439
49
$79,283
13
$19,668
0
$0
2
$24,635
26
$48,313
APPLICATIONS WITHDRAWN
2
$100,490
5
$68,314
15
$90,778
2
$89,515
0
$0
0
$0
6
$50,175
FILES CLOSED FOR INCOMPLETENESS
1
$37,060
2
$57,395
5
$92,694
0
$0
0
$0
1
$32,360
1
$57,420
Aggregated Statistics For Year 2005 (Based on 4 partial tracts)
A) FHA, FSA/RHS & VA Home Purchase Loans
B) Conventional Home Purchase Loans
C) Refinancings
D) Home Improvement Loans
E) Loans on Dwellings For 5+ Families
F) Non-occupant Loans on < 5 Family Dwellings (A B C & D)
G) Loans On Manufactured Home Dwelling (A B C & D)
Number
Average Value
Number
Average Value
Number
Average Value
Number
Average Value
Number
Average Value
Number
Average Value
Number
Average Value
LOANS ORIGINATED
6
$89,325
67
$89,574
81
$82,312
25
$40,636
1
$82,990
7
$49,431
39
$42,087
APPLICATIONS APPROVED, NOT ACCEPTED
1
$19,840
9
$69,449
21
$90,638
5
$15,746
0
$0
1
$40,900
9
$45,846
APPLICATIONS DENIED
9
$62,050
34
$55,947
52
$95,122
13
$31,842
0
$0
2
$49,380
36
$46,857
APPLICATIONS WITHDRAWN
1
$54,290
10
$81,611
21
$118,312
1
$329,840
0
$0
1
$112,750
7
$48,284
FILES CLOSED FOR INCOMPLETENESS
0
$0
3
$81,317
3
$126,367
1
$20,360
0
$0
0
$0
0
$0
Aggregated Statistics For Year 2004 (Based on 4 partial tracts)
A) FHA, FSA/RHS & VA Home Purchase Loans
B) Conventional Home Purchase Loans
C) Refinancings
D) Home Improvement Loans
E) Loans on Dwellings For 5+ Families
F) Non-occupant Loans on < 5 Family Dwellings (A B C & D)
G) Loans On Manufactured Home Dwelling (A B C & D)
Number
Average Value
Number
Average Value
Number
Average Value
Number
Average Value
Number
Average Value
Number
Average Value
Number
Average Value
LOANS ORIGINATED
4
$81,928
55
$76,185
78
$74,434
25
$20,362
1
$129,980
8
$55,904
36
$38,324
APPLICATIONS APPROVED, NOT ACCEPTED
1
$41,240
7
$60,779
19
$67,001
3
$39,220
0
$0
3
$56,990
4
$31,588
APPLICATIONS DENIED
4
$65,317
36
$50,878
51
$86,664
26
$22,560
0
$0
5
$50,618
34
$42,519
APPLICATIONS WITHDRAWN
2
$82,470
10
$89,350
18
$94,015
3
$45,083
0
$0
0
$0
5
$43,782
FILES CLOSED FOR INCOMPLETENESS
1
$58,990
5
$107,170
7
$94,940
0
$0
0
$0
0
$0
0
$0
Aggregated Statistics For Year 2003 (Based on 4 partial tracts)
A) FHA, FSA/RHS & VA Home Purchase Loans
B) Conventional Home Purchase Loans
C) Refinancings
D) Home Improvement Loans
E) Loans on Dwellings For 5+ Families
F) Non-occupant Loans on < 5 Family Dwellings (A B C & D)
Number
Average Value
Number
Average Value
Number
Average Value
Number
Average Value
Number
Average Value
Number
Average Value
LOANS ORIGINATED
3
$95,610
60
$80,246
135
$76,598
30
$15,573
1
$94,850
7
$51,547
APPLICATIONS APPROVED, NOT ACCEPTED
1
$107,010
14
$56,107
20
$85,932
3
$18,630
0
$0
2
$84,345
APPLICATIONS DENIED
2
$90,565
39
$46,922
69
$69,162
21
$14,792
0
$0
1
$54,810
APPLICATIONS WITHDRAWN
2
$79,020
8
$64,419
25
$71,024
1
$11,860
0
$0
0
$0
FILES CLOSED FOR INCOMPLETENESS
1
$46,460
1
$78,510
7
$93,704
1
$19,840
0
$0
1
$28,710
Aggregated Statistics For Year 2002 (Based on 4 partial tracts)
A) FHA, FSA/RHS & VA Home Purchase Loans
B) Conventional Home Purchase Loans
C) Refinancings
D) Home Improvement Loans
E) Loans on Dwellings For 5+ Families
F) Non-occupant Loans on < 5 Family Dwellings (A B C & D)
Number
Average Value
Number
Average Value
Number
Average Value
Number
Average Value
Number
Average Value
Number
Average Value
LOANS ORIGINATED
5
$86,762
51
$69,605
108
$70,255
26
$14,345
1
$125,280
9
$63,218
APPLICATIONS APPROVED, NOT ACCEPTED
0
$0
16
$59,703
18
$71,247
4
$29,330
0
$0
0
$0
APPLICATIONS DENIED
1
$103,740
38
$44,707
61
$68,178
15
$13,423
0
$0
1
$57,940
APPLICATIONS WITHDRAWN
1
$63,450
7
$71,169
12
$81,752
1
$17,780
0
$0
1
$99,590
FILES CLOSED FOR INCOMPLETENESS
1
$71,510
1
$223,250
8
$86,695
0
$0
0
$0
0
$0
Aggregated Statistics For Year 2001 (Based on 4 partial tracts)
A) FHA, FSA/RHS & VA Home Purchase Loans
B) Conventional Home Purchase Loans
C) Refinancings
D) Home Improvement Loans
E) Loans on Dwellings For 5+ Families
F) Non-occupant Loans on < 5 Family Dwellings (A B C & D)
Number
Average Value
Number
Average Value
Number
Average Value
Number
Average Value
Number
Average Value
Number
Average Value
LOANS ORIGINATED
7
$72,960
44
$62,807
75
$75,413
16
$9,621
1
$106,110
5
$44,178
APPLICATIONS APPROVED, NOT ACCEPTED
1
$28,710
25
$44,284
19
$60,456
0
$0
0
$0
0
$0
APPLICATIONS DENIED
2
$95,135
48
$33,598
38
$72,072
8
$16,842
0
$0
2
$55,255
APPLICATIONS WITHDRAWN
1
$107,890
11
$61,685
19
$63,666
1
$4,150
0
$0
0
$0
FILES CLOSED FOR INCOMPLETENESS
2
$86,670
1
$62,640
2
$64,565
0
$0
0
$0
0
$0
Aggregated Statistics For Year 2000 (Based on 4 partial tracts)
A) FHA, FSA/RHS & VA Home Purchase Loans
B) Conventional Home Purchase Loans
C) Refinancings
D) Home Improvement Loans
E) Loans on Dwellings For 5+ Families
F) Non-occupant Loans on < 5 Family Dwellings (A B C & D)
Number
Average Value
Number
Average Value
Number
Average Value
Number
Average Value
Number
Average Value
Number
Average Value
LOANS ORIGINATED
3
$77,113
57
$64,896
33
$68,488
27
$18,696
1
$111,450
2
$36,140
APPLICATIONS APPROVED, NOT ACCEPTED
6
$45,555
16
$46,635
12
$59,865
2
$19,780
0
$0
1
$17,750
APPLICATIONS DENIED
3
$32,197
52
$35,284
30
$47,687
9
$6,078
0
$0
2
$58,730
APPLICATIONS WITHDRAWN
3
$70,620
3
$53,680
13
$57,025
2
$12,275
0
$0
1
$28,450
FILES CLOSED FOR INCOMPLETENESS
0
$0
1
$204,620
3
$46,260
0
$0
0
$0
1
$167,040
Aggregated Statistics For Year 1999 (Based on 2 partial tracts)
A) FHA, FSA/RHS & VA Home Purchase Loans
B) Conventional Home Purchase Loans
C) Refinancings
D) Home Improvement Loans
F) Non-occupant Loans on < 5 Family Dwellings (A B C & D)
Detailed PMIC statistics for the following Tracts:0201.00
, 0202.00
2003 - 2018 National Fire Incident Reporting System (NFIRS) incidents
According to the data from the years 2003 - 2018 the average number of fires per year is 19. The highest number of fire incidents - 32 took place in 2008, and the least - 9 in 2003. The data has an increasing trend.
When looking into fire subcategories, the most incidents belonged to: Structure Fires (55.7%), and Outside Fires (21.5%).
Fire incident types reported to NFIRS in Zip Code 25168


 Nearest zip codes: 25109, 25070, 25213, 25011, 25033, 25159.


 According to the data from the years 2003 - 2018 the average number of fires per year is 19. The highest number of fire incidents - 32 took place in 2008, and the least - 9 in 2003. The data has an increasing trend.
 When looking into fire subcategories, the most incidents belonged to: Structure Fires (55.7%), and Outside Fires (21.5%).