Estimated zip code population in 2022: 1,549 Zip code population in 2010: 1,673 Zip code population in 2000: 1,400
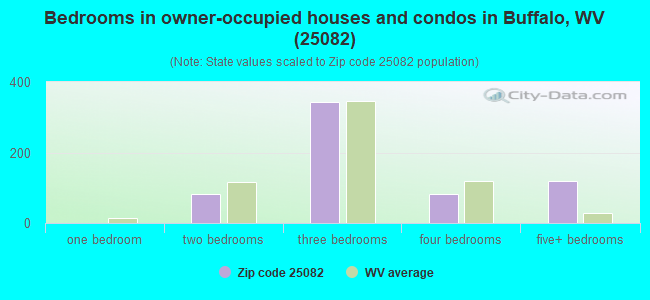
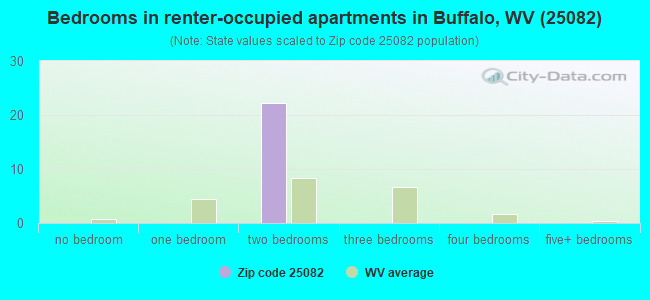
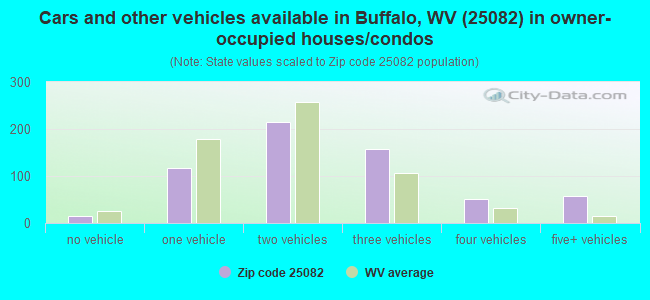
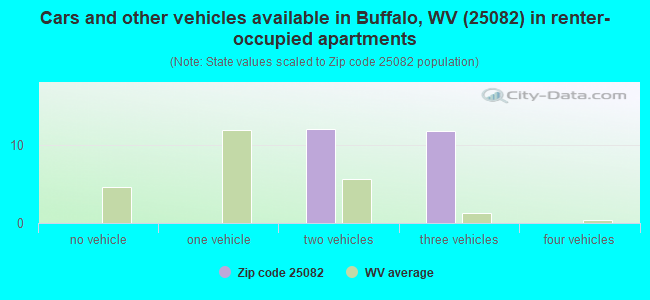
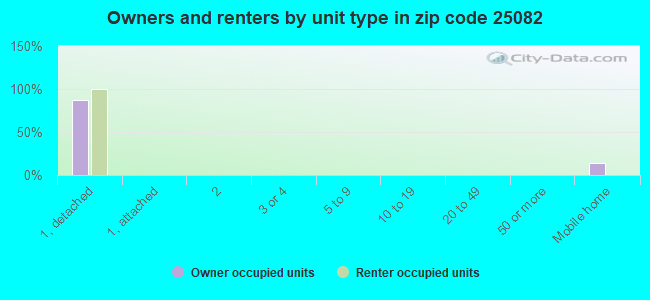
Houses and condos: 729 Renter-occupied apartments: 23
% of renters here:
4%
State:
26%
March 2022 cost of living index in zip code 25082: 81.8 (low, U.S. average is 100)
Land area: 52.3 sq. mi. Water area: 0.8 sq. mi.
Population density: 30 people per square mile
(very low).
OSM Map
General Map
Google Map
MSN Map
OSM Map
General Map
Google Map
MSN Map
OSM Map
General Map
Google Map
MSN Map
OSM Map
General Map
Google Map
MSN Map
Please wait while loading the map...
Real estate property taxes paid for housing units in 2022:
This zip code:
0.6% ($1,525)
West Virginia:
0.5% ($821)
Median real estate property taxes paid for housing units with mortgages in 2022: $1,974 (1.2%) Median real estate property taxes paid for housing units with no mortgage in 2022: $1,160 (1.4%)
Business Search- 14 Million verified businesses
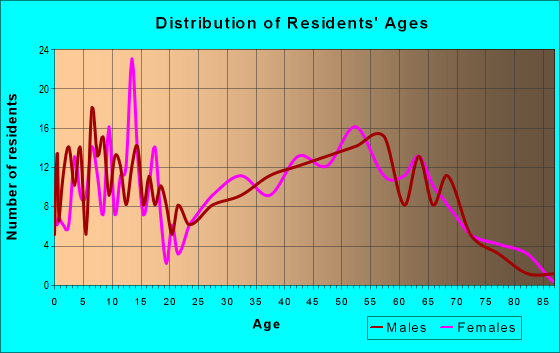
Males: 859
(55.5%)
Females: 689
(44.5%)
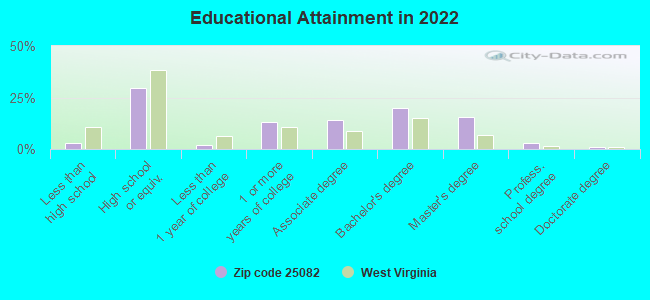
For population 25 years and over in 25082:
High school or higher: 98.5%
Bachelor's degree or higher: 39.5%
Graduate or professional degree: 19.4%
Mean travel time to work (commute): 30.3 minutes
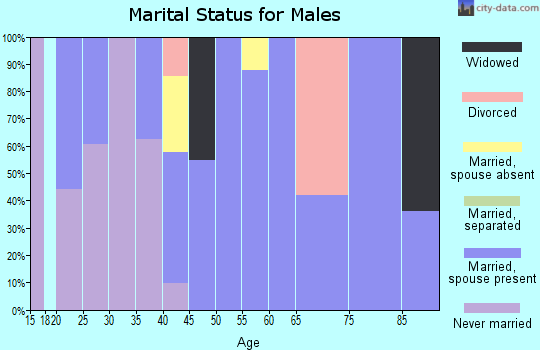
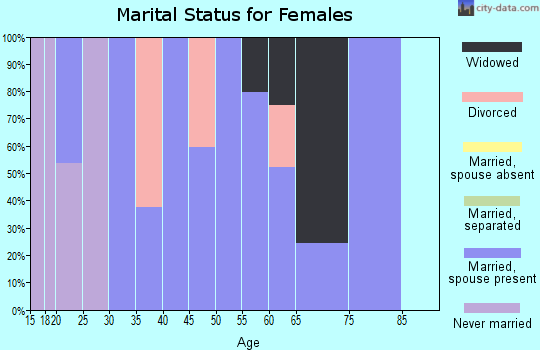
For population 15 years and over in 25082:
Never married: 21.6%
Now married: 70.5%
Separated: 0.0%
Widowed: 3.4%
Divorced: 4.5%
Zip code 25082 compared to state average:
Median household income above state average.
Median house value above state average.
Unemployed percentage significantly below state average.
Black race population percentage significantly below state average.
Hispanic race population percentage significantly below state average.
Foreign-born population percentage significantly below state average.
Renting percentage significantly below state average.
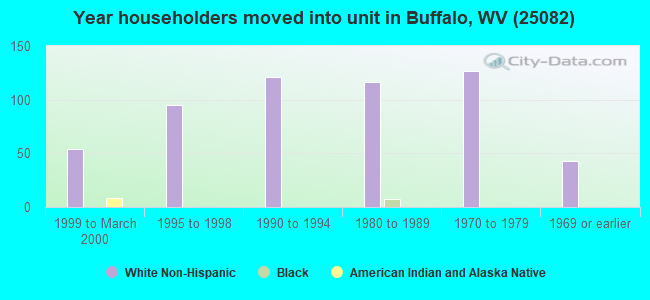
Length of stay since moving in significantly above state average.
House age below state average.
Percentage of population with a bachelor's degree or higher above state average.
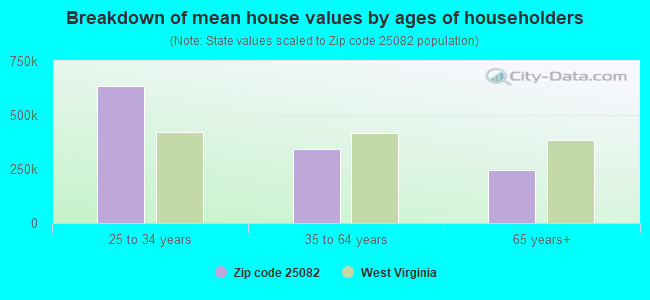
Estimated median house/condo value in 2022: $258,181
25082:
$258,181
West Virginia:
$155,100
According to our research of West Virginia and other state lists, there were 5 registered sex offenders living in 25082 zip code as of May 04, 2024. The ratio of all residents to sex offenders in zip code 25082 is 368 to 1. The ratio of registered sex offenders to all residents in this zip code is near the state average.
Median resident age:
This zip code:
46.7 years
West Virginia median age:
42.9 years
Average household size:
This zip code:
2.4 people
West Virginia:
2.3 people
Averages for the 2020 tax year for zip code 25082, filed in 2021:
Average Adjusted Gross Income (AGI) in 2020: $63,936 (Individual Income Tax Returns)
Here:
$63,936
State:
$56,292
Salary/wage: $60,217 (reported on 82.4% of returns)
Here:
$60,217
State:
$49,093
(% of AGI for various income ranges: 973.2% for AGIs below $25k, 3488.8% for AGIs $25k-50k, 6277.8% for AGIs $50k-75k, 7877.5% for AGIs $75k-100k, 16494.5% for AGIs $100k-200k)
Taxable interest for individuals: $871 (reported on 28.2% of returns)
This zip code:
$871
West Virginia:
$1,141
(% of AGI for various income ranges: 14.7% for AGIs below $25k, 16.2% for AGIs $25k-50k, 20.0% for AGIs $50k-75k, 28.7% for AGIs $75k-100k, 103.6% for AGIs $100k-200k)
Ordinary dividends: $1,256 (reported on 10.6% of returns)
Here:
$1,256
State:
$5,456
(% of AGI for various income ranges: 28.9% for AGIs below $25k, 34.4% for AGIs $50k-75k, 24.5% for AGIs $100k-200k)
Net capital gain/loss in AGI: +$1,862 (reported on 9.4% of returns)
Here:
+$1,862
State:
+$11,656
(% of AGI for various income ranges: 58.9% for AGIs $50k-75k, 87.3% for AGIs $100k-200k)
Profit/loss from business: +$6,590 (reported on 11.8% of returns)
Here:
+$6,590
State:
+$12,084
(% of AGI for various income ranges: 83.2% for AGIs below $25k, 109.4% for AGIs $25k-50k, 296.4% for AGIs $100k-200k)
Taxable individual retirement arrangement distribution: $16,112 (reported on 9.4% of returns)
25082:
$16,112
West Virginia:
$15,311
(% of AGI for various income ranges: 70.5% for AGIs below $25k, 308.1% for AGIs $25k-50k, 827.5% for AGIs $75k-100k)
Total itemized deductions: $28,700 (reported on 3.5% of returns)
Here:
$28,700
State:
$31,950
(% of AGI for various income ranges: 782.7% for AGIs $100k-200k)
Charity contributions: $9,850 (reported on 2.4% of returns)
Here:
$9,850
State:
$12,364
(% of AGI for various income ranges: 179.1% for AGIs $100k-200k)
Taxes paid: $9,033 (reported on 3.5% of returns)
25082:
$9,033
State:
$7,665
(% of AGI for various income ranges: 246.4% for AGIs $100k-200k)
Earned income credit: $2,370 (reported on 11.8% of returns)
Here:
$2,370
State:
$2,258
(% of AGI for various income ranges: 70.0% for AGIs below $25k, 65.0% for AGIs $25k-50k)
Percentage of individuals using paid preparers for their 2020 taxes: 92.9%
Here:
93%
State:
93%
(% for various income ranges: 92.0% for AGIs below $25k, 95.0% for AGIs $25k-50k, 91.7% for AGIs $50k-75k, 100.0% for AGIs $75k-100k, 88.2% for AGIs $100k-200k, 100.0% for AGIs over 200k)
Averages for the 2012 tax year for zip code 25082, filed in 2013:
Average Adjusted Gross Income (AGI) in 2012: $52,710 (Individual Income Tax Returns)
Here:
$52,710
State:
$48,628
Salary/wage: $48,727 (reported on 84.6% of returns)
Here:
$48,727
State:
$42,328
(% of AGI for various income ranges: 75.9% for AGIs below $25k, 79.0% for AGIs $25k-50k, 78.8% for AGIs $50k-75k, 82.9% for AGIs $75k-100k, 75.6% for AGIs $100k-200k)
Taxable interest for individuals: $756 (reported on 32.1% of returns)
This zip code:
$756
West Virginia:
$1,211
(% of AGI for various income ranges: 1.3% for AGIs below $25k, 0.5% for AGIs $25k-50k, 0.5% for AGIs $50k-75k, 0.2% for AGIs $75k-100k, 0.4% for AGIs $100k-200k)
Ordinary dividends: $912 (reported on 10.3% of returns)
Here:
$912
State:
$4,262
(% of AGI for various income ranges: 0.7% for AGIs below $25k, 0.2% for AGIs $50k-75k, 0.4% for AGIs $75k-100k)
Profit/loss from business: +$4,800 (reported on 14.1% of returns)
Here:
+$4,800
State:
+$13,636
(% of AGI for various income ranges: 4.7% for AGIs below $25k, 1.6% for AGIs $25k-50k, 3.2% for AGIs $50k-75k)
Taxable individual retirement arrangement distribution: $13,333 (reported on 7.7% of returns)
25082:
$13,333
West Virginia:
$11,787
Total itemized deductions: $17,677 (20% of AGI, reported on 28.2% of returns)
Here:
$17,677
State:
$21,148
Here:
19.8% of AGI
State:
18.1% of AGI
(% of AGI for various income ranges: 8.9% for AGIs $25k-50k, 9.3% for AGIs $50k-75k, 9.3% for AGIs $75k-100k, 11.8% for AGIs $100k-200k)
Charity contributions: $3,207 (reported on 17.9% of returns)
Here:
$3,207
State:
$4,508
(% of AGI for various income ranges: 1.3% for AGIs below $25k, 0.9% for AGIs $50k-75k, 1.2% for AGIs $75k-100k, 1.6% for AGIs $100k-200k)
Taxes paid: $6,100 (reported on 28.2% of returns)
25082:
$6,100
State:
$8,103
(% of AGI for various income ranges: 1.6% for AGIs $25k-50k, 2.3% for AGIs $50k-75k, 3.2% for AGIs $75k-100k, 5.2% for AGIs $100k-200k)
Earned income credit: $1,858 (reported on 15.4% of returns)
Here:
$1,858
State:
$2,140
(% of AGI for various income ranges: 4.9% for AGIs below $25k, 1.1% for AGIs $25k-50k)
Percentage of individuals using paid preparers for their 2012 taxes: 56.4%
Here:
56%
State:
49%
(% for various income ranges: 48.1% for AGIs below $25k, 64.7% for AGIs $25k-50k, 64.3% for AGIs $50k-75k, 55.6% for AGIs $75k-100k, 54.5% for AGIs $100k-200k)
Averages for the 2004 tax year for zip code 25082, filed in 2005:
Average Adjusted Gross Income (AGI) in 2004: $37,435 (Individual Income Tax Returns)
Here:
$37,435
State:
$37,498
Salary/wage: $36,015 (reported on 87.4% of returns)
Here:
$36,015
State:
$33,645
(% of AGI for various income ranges: 104.6% for AGIs below $10k, 76.0% for AGIs $10k-25k, 84.2% for AGIs $25k-50k, 85.4% for AGIs $50k-75k, 91.3% for AGIs $75k-100k, 76.6% for AGIs over 100k)
Taxable interest for individuals: $598 (reported on 39.0% of returns)
This zip code:
$598
West Virginia:
$1,465
(% of AGI for various income ranges: 1.5% for AGIs below $10k, 1.6% for AGIs $10k-25k, 0.5% for AGIs $25k-50k, 0.6% for AGIs $50k-75k, 0.3% for AGIs $75k-100k, 0.5% for AGIs over 100k)
Taxable dividends: $590 (reported on 12.4% of returns)
Here:
$590
State:
$2,913
(% of AGI for various income ranges: 1.3% for AGIs below $10k, 0.0% for AGIs $25k-50k, 0.2% for AGIs $50k-75k, 0.1% for AGIs $75k-100k, 0.4% for AGIs over 100k)
Net capital gain/loss: +$909 (reported on 8.2% of returns)
Here:
+$909
State:
+$6,331
Profit/loss from business: +$7,033 (reported on 13.8% of returns)
Here:
+$7,033
State:
+$11,074
(% of AGI for various income ranges: 14.6% for AGIs below $10k, 4.8% for AGIs $10k-25k, 3.8% for AGIs $25k-50k, 1.5% for AGIs $50k-75k, 1.7% for AGIs $75k-100k)
IRA payment deduction: $2,882 (reported on 2.5% of returns)
25082:
$2,882
West Virginia:
$2,796
Total itemized deductions: $14,639 (21% of AGI, reported on 21.5% of returns)
Here:
$14,639
State:
$16,976
Here:
20.8% of AGI
State:
19.0% of AGI
(% of AGI for various income ranges: 4.5% for AGIs $10k-25k, 5.9% for AGIs $25k-50k, 9.4% for AGIs $50k-75k, 11.3% for AGIs $75k-100k, 11.7% for AGIs over 100k)
Charity contributions deductions: $2,838 (4% of AGI, reported on 16.6% of returns)
Here:
$2,838
State:
$3,529
Here:
3.9% of AGI
State:
3.7% of AGI
(% of AGI for various income ranges: 0.7% for AGIs $25k-50k, 1.5% for AGIs $50k-75k, 2.1% for AGIs $75k-100k, 2.0% for AGIs over 100k)
Total tax: $4,396 (reported on 74.7% of returns)
25082:
$4,396
State:
$5,372
(% of AGI for various income ranges: 2.8% for AGIs below $10k, 4.0% for AGIs $10k-25k, 6.1% for AGIs $25k-50k, 9.0% for AGIs $50k-75k, 10.5% for AGIs $75k-100k, 15.1% for AGIs over 100k)
Earned income credit: $1,442 (reported on 19.3% of returns)
Here:
$1,442
State:
$1,662
Percentage of individuals using paid preparers for their 2004 taxes: 59.8%
Here:
60%
State:
55%
(% for various income ranges: 51.9% for AGIs below $10k, 63.4% for AGIs $10k-25k, 67.4% for AGIs $25k-50k, 54.9% for AGIs $50k-75k, 50.0% for AGIs $75k-100k, 65.5% for AGIs over 100k)
Household received Food Stamps/SNAP in the past 12 months: 0 Household did not receive Food Stamps/SNAP in the past 12 months: 628
Women who did not have a birth in the past 12 months: 370 (220 now married, 149 unmarried)
Housing units in zip code 25082 with a mortgage: 360 (14 second mortgage, 14 both second mortgage and home equity loan) Median monthly owner costs for units with a mortgage: $1,789 Median monthly owner costs for units without a mortgage: $325
Residents with income below the poverty level in 2022:
This zip code:
3.2%
Whole state:
17.9%
Residents with income below 50% of the poverty level in 2022:
This zip code:
3.2%
Whole state:
9.7%
Median number of rooms in houses and condos:
Here:
6.5
State:
6.5
Notable locations in this zip code not listed on our city pages
Churches in zip code 25082 include: Siloam Church (A), Mount Union Church (B), Mount Zion Church (C), Pliny Church (D), Evergreen Church (E), Five and Twenty Mile Church (F). Display/hide their locations on the map
Cemeteries: Mount Zion Cemetery (1), Pliny Church Cemetery (2), Fraizer Bottom Church Cemetery (3), Mount Union Cemetery (4), Long Cemetery (5), Siloam Cemetery (6), Evergreen Cemetery (7). Display/hide their locations on the map
Streams, rivers, and creeks: Stave Branch (A), Spring Branch (B), Sixteenmile Creek (C), Plantation Creek (D), McCausland Run (E), Honeycutt Run (F), Fivefork Branch (G), Evans Creek (H), Barnett Branch (I). Display/hide their locations on the map
Size of family households: 260 2-persons, 75 3-persons, 102 4-persons, 62 5-persons
Size of nonfamily households: 136 1-person
305 married couples with children.
0 single-parent households ().
98.9% of residents of 25082 zip code speak English at home.
1.0% of residents speak other Indo-European language at home (100% very well).
Foreign born population: 0 (0.0%)
:
0.0%
Whole state:
1.8%
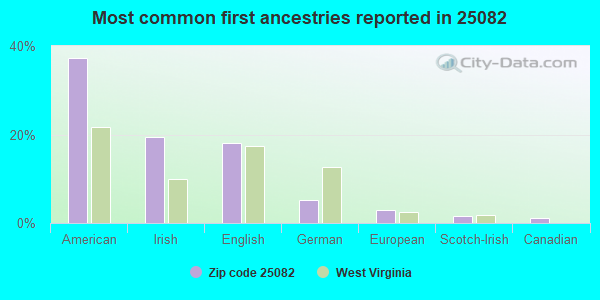
37%American
19%Irish
18%English
5%German
3%European
2%Scotch-Irish
1%Canadian
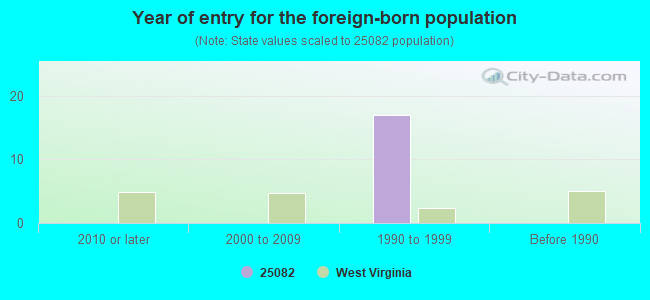
Year of entry for the foreign-born population
02010 or later
02000 to 2009
171990 to 1999
0Before 1990
Facilities with environmental interests located in this zip code:
COMMERCIAL BLAST & PAINT (#50 US RT 35 N in FRAZIERS BOTTOM, WV)
(Resource Conservation and Recovery Act (tracking hazardous waste)) Business NAICS classification: METAL COATING, ENGRAVING (EXCEPT JEWELRY AND SILVERWARE), AND ALLIED SERVICES TO MANUFACTURERS. Organizations: MARK HUNTER (CONTACT/OPERATOR)
, FABRICATION AND PAINTING SPEC (CONTACT/OWNER)
Alternative names: ONYX INDUSTRIAL SERVICES INC
COUNTRY STRIPPERS (616 MASON RD in FRAZIERS BOTTOM, WV)
(Resource Conservation and Recovery Act (tracking hazardous waste)) Organizations: OPERNAME (CONTACT/OPERATOR)
, WALTERS LARRY (CONTACT/OWNER)
COUNTRY ROADS TRUCK STOP (INTERSECTION OF RT 35 AND 5&20 in FRAZIERS BOTTOM, WV)
National Pollutant Discharge Elimination System NON-MAJOR (Tracking pollutant discharge elimination systems) - permit Business SIC classification: GASOLINE SERVICE STATIONS Organizations: JOHN W. CLARK OIL, INC. (CONTACT/OWNER)
Alternative names: JOHN W. CLARK OIL, INC.
FABRICATION & PAINTING SPECIALTIES INC (RT 35 5 MI N OF RT 34 & RT 35 in FRAZIERS BOTTOM, WV)
(Resource Conservation and Recovery Act (tracking hazardous waste)) Organizations: FABRICATION AND PAINTING SPEC (CONTACT/OWNER)
CORNER MARKET (101 PLANTATION ROAD in PLINY, WV)
(Resource Conservation and Recovery Act (tracking hazardous waste))
Housing units lacking complete plumbing facilities: 7.2% Housing units lacking complete kitchen facilities: 2.5%
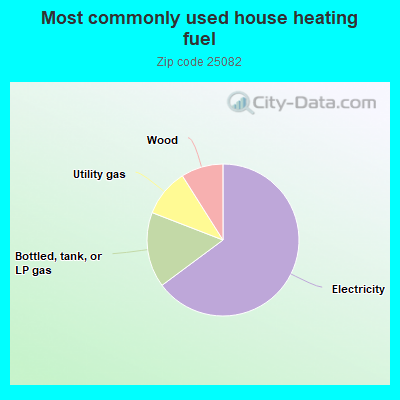
65.1%Electricity
16.1%Bottled, tank, or LP gas
10.2%Utility gas
9.0%Wood
Population in 1990: 911. Population change in the 1990s: +489 (+53.7%).
Place of birth for U.S.-born residents:
This state: 1,245
Northeast: 45
Midwest: 99
South: 127
73% of the 25082 zip code residents lived in the same house 5 years ago. Out of people who lived in different houses, 42% lived in this county. Out of people who lived in different counties, 50% lived in West Virginia.
101% of the 25082 zip code residents lived in the same house 1 year ago.
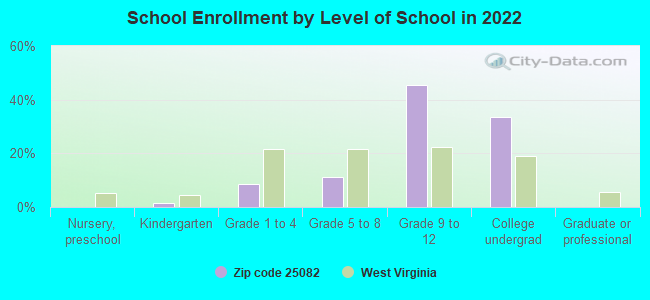
Private vs. public school enrollment:
Students in private schools in grades 1 to 8 (elementary and middle school):
Here:
0.0%
West Virginia:
12.2%
Students in private schools in grades 9 to 12 (high school): 51
Here:
32.4%
West Virginia:
8.8%
Students in private undergraduate colleges: 34
Here:
29.3%
West Virginia:
17.3%
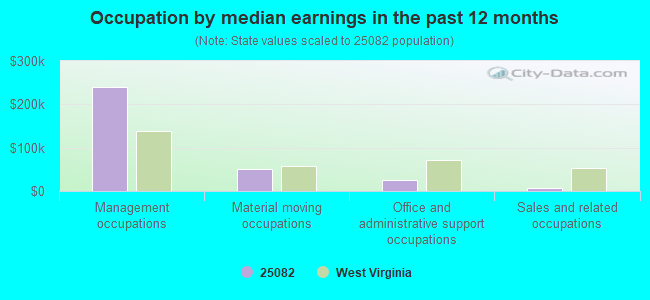
Occupation by median earnings in the past 12 months ($)
239,696Management occupations
49,772Material moving occupations
24,836Office and administrative support occupations
6,541Sales and related occupations
Companies with federal contracts located in this zip code:
RONALD HARRIS (7 CEDAR VIEW LN in FRAZIERS BOTTO, WV) : $135,860 in 6 contractsfrom 2002 to 2005
Contracts for Landscaping/Groundskeeping Services, Other Professional Services by Army, U.S. Army Corps of Engineers - civil program financing only Signed by year:2000: $0; 2001: $0; 2002: $15,910; 2003: $19,710; 2004: $50,520; 2005: $49,720; 2006: $0.
Biggest contracts:
$25,260 with Army for Landscaping/Groundskeeping Services. Signed on 2004-03-30. Completion date: 2004-09-30.
$25,260 with U.S. Army Corps of Engineers - civil program financing only for Landscaping/Groundskeeping Services. Signed on 2004-03-30. Completion date: 2004-09-30.
$24,860, same as above.Signed on 2005-02-24. Completion date: 2005-09-30.
$24,860 with Army for Landscaping/Groundskeeping Services. Signed on 2005-02-24. Completion date: 2005-09-30.
Top industries in this zip code by the number of employees in 2005:
Other Services (except Public Administration): Commercial and Industrial Machinery and Equipment (except Automotive and Electronic) Repair and Maintenance (5-9: 1, 1-4: 1)
Other Services (except Public Administration): Religious Organizations (1-4: 4)
Accommodation and Food Services: Full-Service Restaurants (5-9: 1)
Administrative and Support and Waste Management and Remediation Services: Landscaping Services (1-4: 2)
Other Services (except Public Administration): Reupholstery and Furniture Repair (1-4: 1)
Construction: Other Foundation, Structure, and Building Exterior Contractors (1-4: 1)
Fatal accident statistics in 2014:
Fatal accident count: 2
Vehicles involved in fatal accidents: 4
Fatal accidents caused by drunken drivers: 0
Fatalities: 2
Persons involved in fatal accidents: 7
Pedestrians involved in fatal accidents: 0
Fatal accident statistics in 2012:
Fatal accident count: 3
Vehicles involved in fatal accidents: 7
Fatal accidents caused by drunken drivers: 1
Fatalities: 3
Persons involved in fatal accidents: 7
Pedestrians involved in fatal accidents: 1
Home Mortgage Disclosure Act Aggregated Statistics For Year 2009 (Based on 2 partial tracts)
A) FHA, FSA/RHS & VA Home Purchase Loans
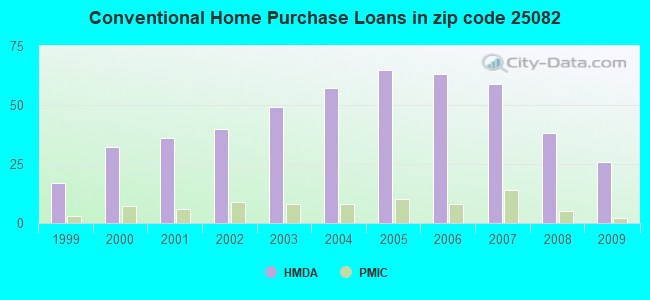
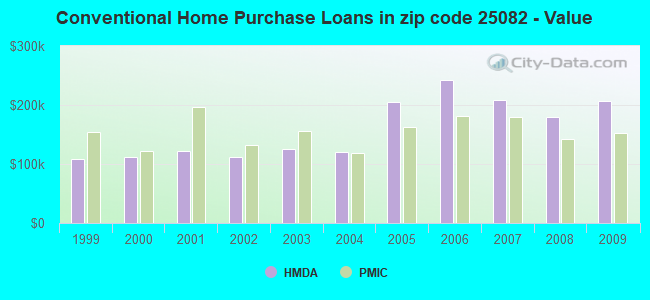
B) Conventional Home Purchase Loans
C) Refinancings
D) Home Improvement Loans
F) Non-occupant Loans on < 5 Family Dwellings (A B C & D)
G) Loans On Manufactured Home Dwelling (A B C & D)
Number
Average Value
Number
Average Value
Number
Average Value
Number
Average Value
Number
Average Value
Number
Average Value
LOANS ORIGINATED
12
$155,217
26
$206,940
71
$188,785
11
$95,587
3
$161,090
3
$57,500
APPLICATIONS APPROVED, NOT ACCEPTED
1
$237,680
2
$184,680
4
$137,440
1
$2,630
0
$0
1
$54,650
APPLICATIONS DENIED
1
$90,200
6
$206,080
18
$127,218
3
$97,223
3
$93,273
5
$28,048
APPLICATIONS WITHDRAWN
1
$104,690
5
$229,518
11
$186,925
1
$90,860
2
$168,550
0
$0
FILES CLOSED FOR INCOMPLETENESS
0
$0
0
$0
3
$145,947
0
$0
0
$0
0
$0
Aggregated Statistics For Year 2008 (Based on 2 partial tracts)
A) FHA, FSA/RHS & VA Home Purchase Loans
B) Conventional Home Purchase Loans
C) Refinancings
D) Home Improvement Loans
F) Non-occupant Loans on < 5 Family Dwellings (A B C & D)
G) Loans On Manufactured Home Dwelling (A B C & D)
Number
Average Value
Number
Average Value
Number
Average Value
Number
Average Value
Number
Average Value
Number
Average Value
LOANS ORIGINATED
5
$176,582
38
$179,449
41
$179,053
10
$37,463
4
$191,265
9
$64,084
APPLICATIONS APPROVED, NOT ACCEPTED
0
$0
3
$151,870
3
$201,690
1
$32,920
1
$210,690
1
$53,990
APPLICATIONS DENIED
2
$105,675
5
$129,310
20
$155,909
3
$165,697
1
$200,810
7
$59,633
APPLICATIONS WITHDRAWN
1
$50,700
3
$259,630
9
$159,552
0
$0
0
$0
0
$0
FILES CLOSED FOR INCOMPLETENESS
0
$0
0
$0
1
$291,670
0
$0
0
$0
0
$0
Aggregated Statistics For Year 2007 (Based on 2 partial tracts)
A) FHA, FSA/RHS & VA Home Purchase Loans
B) Conventional Home Purchase Loans
C) Refinancings
D) Home Improvement Loans
F) Non-occupant Loans on < 5 Family Dwellings (A B C & D)
G) Loans On Manufactured Home Dwelling (A B C & D)
Number
Average Value
Number
Average Value
Number
Average Value
Number
Average Value
Number
Average Value
Number
Average Value
LOANS ORIGINATED
2
$154,065
59
$207,876
47
$169,405
18
$32,518
4
$165,752
9
$42,869
APPLICATIONS APPROVED, NOT ACCEPTED
0
$0
9
$89,689
3
$193,350
3
$48,503
0
$0
5
$44,112
APPLICATIONS DENIED
1
$81,640
18
$134,241
13
$191,291
9
$70,083
1
$691,320
13
$45,025
APPLICATIONS WITHDRAWN
0
$0
7
$188,114
6
$185,778
2
$160,650
1
$387,800
1
$81,640
FILES CLOSED FOR INCOMPLETENESS
0
$0
2
$254,140
2
$150,445
0
$0
0
$0
0
$0
Aggregated Statistics For Year 2006 (Based on 2 partial tracts)
A) FHA, FSA/RHS & VA Home Purchase Loans
B) Conventional Home Purchase Loans
C) Refinancings
D) Home Improvement Loans
F) Non-occupant Loans on < 5 Family Dwellings (A B C & D)
G) Loans On Manufactured Home Dwelling (A B C & D)
Number
Average Value
Number
Average Value
Number
Average Value
Number
Average Value
Number
Average Value
Number
Average Value
LOANS ORIGINATED
1
$197,520
63
$241,790
52
$125,261
10
$22,254
13
$243,558
7
$50,414
APPLICATIONS APPROVED, NOT ACCEPTED
0
$0
5
$259,672
5
$182,772
2
$76,375
1
$521,450
1
$17,120
APPLICATIONS DENIED
1
$15,800
10
$81,905
26
$103,597
6
$179,195
2
$24,360
7
$38,940
APPLICATIONS WITHDRAWN
1
$121,800
3
$160,870
15
$146,209
2
$18,105
1
$39,500
1
$41,480
FILES CLOSED FOR INCOMPLETENESS
0
$0
1
$111,930
3
$162,187
0
$0
0
$0
0
$0
Aggregated Statistics For Year 2005 (Based on 2 partial tracts)
A) FHA, FSA/RHS & VA Home Purchase Loans
B) Conventional Home Purchase Loans
C) Refinancings
D) Home Improvement Loans
F) Non-occupant Loans on < 5 Family Dwellings (A B C & D)
G) Loans On Manufactured Home Dwelling (A B C & D)
Number
Average Value
Number
Average Value
Number
Average Value
Number
Average Value
Number
Average Value
Number
Average Value
LOANS ORIGINATED
3
$139,360
65
$205,866
54
$133,533
13
$67,461
7
$103,933
9
$72,058
APPLICATIONS APPROVED, NOT ACCEPTED
1
$81,640
9
$75,423
8
$94,728
3
$16,020
0
$0
7
$41,386
APPLICATIONS DENIED
3
$103,587
14
$71,671
24
$96,154
7
$24,267
3
$109,953
14
$45,947
APPLICATIONS WITHDRAWN
1
$158,670
7
$115,879
9
$142,946
1
$223,860
1
$118,510
1
$158,670
FILES CLOSED FOR INCOMPLETENESS
0
$0
1
$88,230
5
$175,398
0
$0
1
$133,660
0
$0
Aggregated Statistics For Year 2004 (Based on 2 partial tracts)
A) FHA, FSA/RHS & VA Home Purchase Loans
B) Conventional Home Purchase Loans
C) Refinancings
D) Home Improvement Loans
F) Non-occupant Loans on < 5 Family Dwellings (A B C & D)
G) Loans On Manufactured Home Dwelling (A B C & D)
Number
Average Value
Number
Average Value
Number
Average Value
Number
Average Value
Number
Average Value
Number
Average Value
LOANS ORIGINATED
3
$139,800
57
$120,268
57
$129,046
11
$20,949
7
$64,900
16
$42,672
APPLICATIONS APPROVED, NOT ACCEPTED
0
$0
7
$111,740
3
$138,483
4
$29,300
0
$0
3
$62,110
APPLICATIONS DENIED
1
$64,520
13
$67,258
26
$105,420
9
$41,333
1
$79,670
11
$43,155
APPLICATIONS WITHDRAWN
1
$64,520
2
$113,575
9
$154,651
0
$0
1
$159,990
0
$0
FILES CLOSED FOR INCOMPLETENESS
0
$0
3
$175,133
8
$172,336
1
$30,940
0
$0
0
$0
Aggregated Statistics For Year 2003 (Based on 2 partial tracts)
A) FHA, FSA/RHS & VA Home Purchase Loans
B) Conventional Home Purchase Loans
C) Refinancings
D) Home Improvement Loans
F) Non-occupant Loans on < 5 Family Dwellings (A B C & D)
Number
Average Value
Number
Average Value
Number
Average Value
Number
Average Value
Number
Average Value
LOANS ORIGINATED
3
$140,460
49
$126,077
78
$120,099
17
$27,962
6
$74,070
APPLICATIONS APPROVED, NOT ACCEPTED
0
$0
7
$103,463
12
$122,682
1
$6,580
0
$0
APPLICATIONS DENIED
1
$159,330
11
$48,482
27
$101,589
5
$74,530
2
$19,095
APPLICATIONS WITHDRAWN
0
$0
3
$152,310
15
$103,764
0
$0
0
$0
FILES CLOSED FOR INCOMPLETENESS
1
$142,870
5
$161,966
2
$138,265
0
$0
0
$0
Aggregated Statistics For Year 2002 (Based on 2 partial tracts)
A) FHA, FSA/RHS & VA Home Purchase Loans
B) Conventional Home Purchase Loans
C) Refinancings
D) Home Improvement Loans
F) Non-occupant Loans on < 5 Family Dwellings (A B C & D)
Number
Average Value
Number
Average Value
Number
Average Value
Number
Average Value
Number
Average Value
LOANS ORIGINATED
3
$126,853
40
$111,764
73
$118,981
12
$35,169
6
$76,265
APPLICATIONS APPROVED, NOT ACCEPTED
0
$0
4
$55,305
9
$87,713
1
$6,580
1
$55,960
APPLICATIONS DENIED
1
$16,460
15
$63,294
26
$87,491
5
$18,698
1
$26,340
APPLICATIONS WITHDRAWN
0
$0
4
$128,387
11
$100,136
1
$32,920
1
$98,760
FILES CLOSED FOR INCOMPLETENESS
0
$0
2
$91,520
6
$155,163
0
$0
0
$0
Aggregated Statistics For Year 2001 (Based on 2 partial tracts)
A) FHA, FSA/RHS & VA Home Purchase Loans
B) Conventional Home Purchase Loans
C) Refinancings
D) Home Improvement Loans
F) Non-occupant Loans on < 5 Family Dwellings (A B C & D)
Number
Average Value
Number
Average Value
Number
Average Value
Number
Average Value
Number
Average Value
LOANS ORIGINATED
2
$134,645
36
$122,353
57
$109,318
14
$9,970
5
$85,592
APPLICATIONS APPROVED, NOT ACCEPTED
0
$0
6
$32,372
7
$87,756
1
$6,580
0
$0
APPLICATIONS DENIED
1
$19,750
16
$97,937
25
$102,552
4
$8,888
1
$34,240
APPLICATIONS WITHDRAWN
0
$0
3
$125,533
10
$124,174
3
$19,753
1
$131,020
FILES CLOSED FOR INCOMPLETENESS
0
$0
0
$0
7
$113,809
0
$0
0
$0
Aggregated Statistics For Year 2000 (Based on 2 partial tracts)
A) FHA, FSA/RHS & VA Home Purchase Loans
B) Conventional Home Purchase Loans
C) Refinancings
D) Home Improvement Loans
F) Non-occupant Loans on < 5 Family Dwellings (A B C & D)
Number
Average Value
Number
Average Value
Number
Average Value
Number
Average Value
Number
Average Value
LOANS ORIGINATED
2
$121,475
32
$111,352
25
$82,484
14
$17,212
1
$26,340
APPLICATIONS APPROVED, NOT ACCEPTED
3
$59,693
7
$36,119
7
$53,519
0
$0
0
$0
APPLICATIONS DENIED
2
$40,160
13
$96,937
13
$77,134
2
$37,860
0
$0
APPLICATIONS WITHDRAWN
1
$31,600
3
$74,400
5
$127,202
0
$0
0
$0
FILES CLOSED FOR INCOMPLETENESS
0
$0
0
$0
1
$56,620
0
$0
0
$0
Aggregated Statistics For Year 1999 (Based on 1 partial tract)
A) FHA, FSA/RHS & VA Home Purchase Loans
B) Conventional Home Purchase Loans
C) Refinancings
D) Home Improvement Loans
F) Non-occupant Loans on < 5 Family Dwellings (A B C & D)
Detailed PMIC statistics for the following Tracts:0203.00
2002 - 2018 National Fire Incident Reporting System (NFIRS) incidents
Based on the data from the years 2002 - 2018 the average number of fire incidents per year is 14. The highest number of fire incidents - 31 took place in 2016, and the least - 1 in 2002. The data has an increasing trend.
When looking into fire subcategories, the most incidents belonged to: Structure Fires (44.7%), and Outside Fires (34.8%).
Fire incident types reported to NFIRS in Zip Code 25082
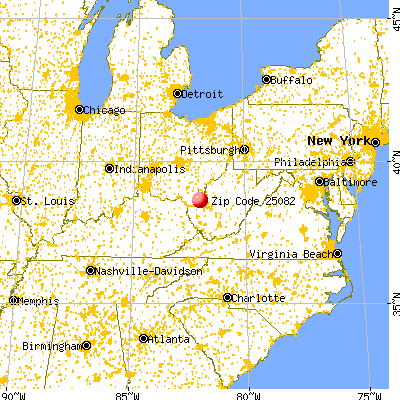


 Nearest zip codes: 25503, 25502, 25033, 25070, 25187, 25213.
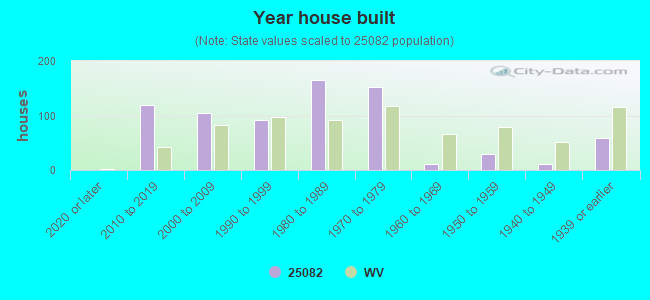


 Based on the data from the years 2002 - 2018 the average number of fire incidents per year is 14. The highest number of fire incidents - 31 took place in 2016, and the least - 1 in 2002. The data has an increasing trend.
 When looking into fire subcategories, the most incidents belonged to: Structure Fires (44.7%), and Outside Fires (34.8%).