Estimated zip code population in 2022: 6,175 Zip code population in 2010: 6,347 Zip code population in 2000: 6,535
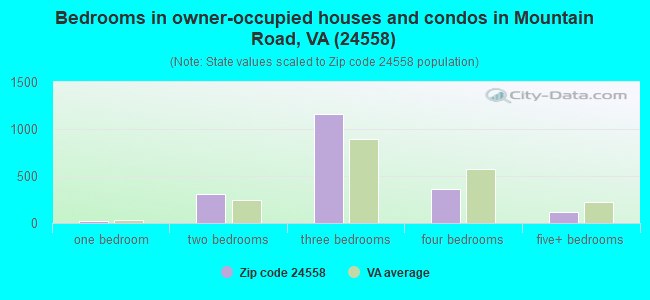
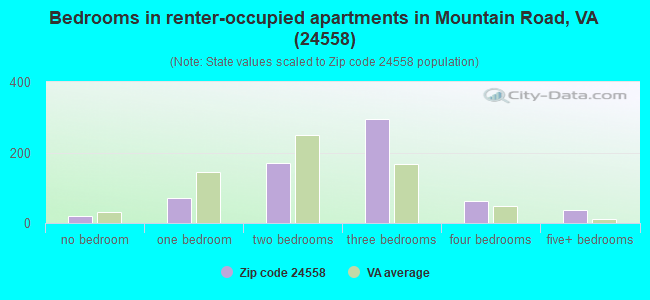
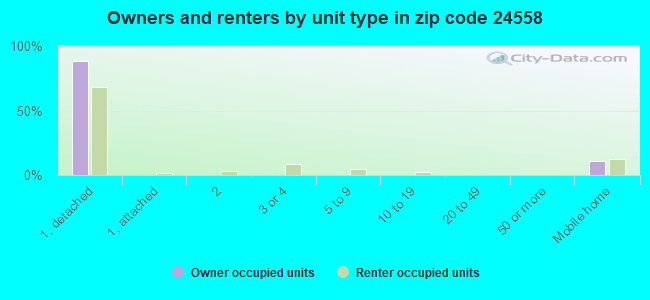
Houses and condos: 3,305 Renter-occupied apartments: 654
% of renters here:
25%
State:
33%
March 2022 cost of living index in zip code 24558: 83.8 (less than average, U.S. average is 100)
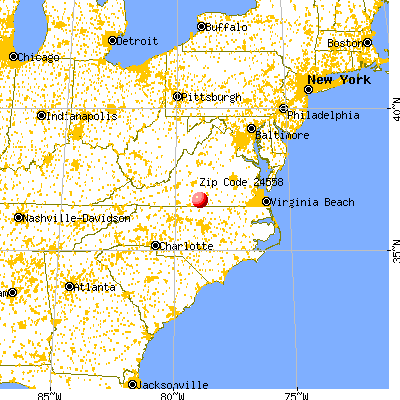
Land area: 93.8 sq. mi. Water area: 1.1 sq. mi.
Population density: 66 people per square mile
(very low).
OSM Map
General Map
Google Map
MSN Map
OSM Map
General Map
Google Map
MSN Map
OSM Map
General Map
Google Map
MSN Map
OSM Map
General Map
Google Map
MSN Map
Please wait while loading the map...
Real estate property taxes paid for housing units in 2022:
This zip code:
0.5% ($701)
Virginia:
0.7% ($2,617)
Median real estate property taxes paid for housing units with mortgages in 2022: $926 (0.6%) Median real estate property taxes paid for housing units with no mortgage in 2022: $623 (0.5%)
Business Search- 14 Million verified businesses
Males: 3,087
(50.0%)
Females: 3,087
(50.0%)
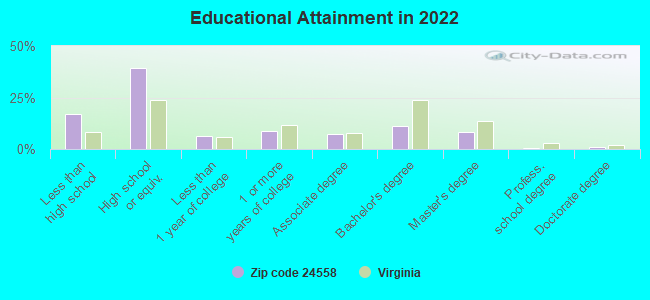
For population 25 years and over in 24558:
High school or higher: 81.3%
Bachelor's degree or higher: 20.9%
Graduate or professional degree: 10.2%
Unemployed: 3.2%
Mean travel time to work (commute): 20.3 minutes
For population 15 years and over in 24558:
Never married: 30.8%
Now married: 46.1%
Separated: 4.3%
Widowed: 8.4%
Divorced: 10.3%
Zip code 24558 compared to state average:
Median household income below state average.
Median house value significantly below state average.
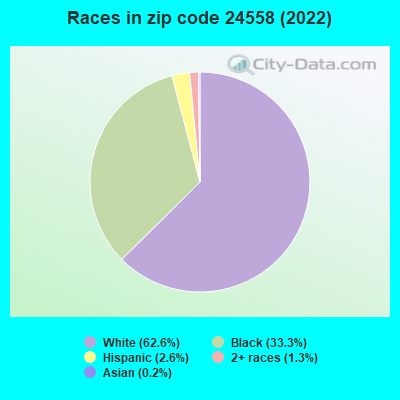
Black race population percentage above state average.
Hispanic race population percentage significantly below state average.
Median age significantly above state average.
Foreign-born population percentage significantly below state average.
Length of stay since moving in significantly above state average.
Percentage of population with a bachelor's degree or higher below state average.
Averages for the 2020 tax year for zip code 24558, filed in 2021:
Average Adjusted Gross Income (AGI) in 2020: $52,728 (Individual Income Tax Returns)
Here:
$52,728
State:
$86,446
Salary/wage: $44,830 (reported on 82.0% of returns)
Here:
$44,830
State:
$71,185
(% of AGI for various income ranges: 1197.4% for AGIs below $25k, 3683.9% for AGIs $25k-50k, 6664.2% for AGIs $50k-75k, 9722.4% for AGIs $75k-100k, 17540.0% for AGIs $100k-200k, 69310.0% for AGIs over 200k)
Taxable interest for individuals: $1,229 (reported on 26.5% of returns)
This zip code:
$1,229
Virginia:
$1,805
(% of AGI for various income ranges: 12.0% for AGIs below $25k, 14.7% for AGIs $25k-50k, 45.8% for AGIs $50k-75k, 83.5% for AGIs $75k-100k, 224.7% for AGIs $100k-200k, 835.0% for AGIs over 200k)
Ordinary dividends: $7,204 (reported on 15.6% of returns)
Here:
$7,204
State:
$8,327
(% of AGI for various income ranges: 12.5% for AGIs below $25k, 40.9% for AGIs $25k-50k, 184.6% for AGIs $50k-75k, 145.3% for AGIs $75k-100k, 748.0% for AGIs $100k-200k, 5470.0% for AGIs over 200k)
Net capital gain/loss in AGI: +$8,426 (reported on 13.3% of returns)
Here:
+$8,426
State:
+$24,644
(% of AGI for various income ranges: 2.2% for AGIs below $25k, 24.8% for AGIs $25k-50k, 126.2% for AGIs $50k-75k, 216.5% for AGIs $75k-100k, 966.0% for AGIs $100k-200k, 4795.0% for AGIs over 200k)
Profit/loss from business: +$5,710 (reported on 13.3% of returns)
Here:
+$5,710
State:
+$12,836
(% of AGI for various income ranges: 48.5% for AGIs below $25k, 79.2% for AGIs $25k-50k, 181.2% for AGIs $50k-75k, 144.7% for AGIs $75k-100k, 152.7% for AGIs $100k-200k, 1825.0% for AGIs over 200k)
Taxable individual retirement arrangement distribution: $15,687 (reported on 10.5% of returns)
24558:
$15,687
Virginia:
$21,535
(% of AGI for various income ranges: 77.5% for AGIs below $25k, 102.4% for AGIs $25k-50k, 193.5% for AGIs $50k-75k, 500.0% for AGIs $75k-100k, 1470.7% for AGIs $100k-200k)
Total itemized deductions: $32,175 (reported on 5.4% of returns)
Here:
$32,175
State:
$33,287
(% of AGI for various income ranges: 114.8% for AGIs $25k-50k, 541.2% for AGIs $50k-75k, 1005.3% for AGIs $100k-200k, 7375.0% for AGIs over 200k)
Charity contributions: $11,069 (reported on 4.4% of returns)
Here:
$11,069
State:
$10,381
(% of AGI for various income ranges: 29.1% for AGIs $25k-50k, 119.6% for AGIs $50k-75k, 624.0% for AGIs $100k-200k)
Taxes paid: $5,860 (reported on 5.1% of returns)
24558:
$5,860
State:
$8,284
(% of AGI for various income ranges: 14.2% for AGIs $25k-50k, 81.9% for AGIs $50k-75k, 250.7% for AGIs $100k-200k, 980.0% for AGIs over 200k)
Earned income credit: $2,194 (reported on 21.1% of returns)
Here:
$2,194
State:
$2,214
(% of AGI for various income ranges: 101.1% for AGIs below $25k, 82.0% for AGIs $25k-50k)
Percentage of individuals using paid preparers for their 2020 taxes: 92.9%
Here:
93%
State:
92%
(% for various income ranges: 91.6% for AGIs below $25k, 95.2% for AGIs $25k-50k, 92.5% for AGIs $50k-75k, 92.6% for AGIs $75k-100k, 90.0% for AGIs $100k-200k, 100.0% for AGIs over 200k)
Averages for the 2012 tax year for zip code 24558, filed in 2013:
Average Adjusted Gross Income (AGI) in 2012: $45,128 (Individual Income Tax Returns)
Here:
$45,128
State:
$71,192
Salary/wage: $38,435 (reported on 83.1% of returns)
Here:
$38,435
State:
$59,229
(% of AGI for various income ranges: 72.9% for AGIs below $25k, 81.0% for AGIs $25k-50k, 74.3% for AGIs $50k-75k, 75.3% for AGIs $75k-100k, 67.6% for AGIs $100k-200k, 46.8% for AGIs over 200k)
Taxable interest for individuals: $1,337 (reported on 32.7% of returns)
This zip code:
$1,337
Virginia:
$1,600
(% of AGI for various income ranges: 1.8% for AGIs below $25k, 0.8% for AGIs $25k-50k, 0.9% for AGIs $50k-75k, 0.8% for AGIs $75k-100k, 1.0% for AGIs $100k-200k, 0.8% for AGIs over 200k)
Ordinary dividends: $5,080 (reported on 17.6% of returns)
Here:
$5,080
State:
$6,959
(% of AGI for various income ranges: 0.9% for AGIs below $25k, 1.3% for AGIs $25k-50k, 1.1% for AGIs $50k-75k, 1.5% for AGIs $75k-100k, 2.8% for AGIs $100k-200k, 4.8% for AGIs over 200k)
Net capital gain/loss in AGI: +$7,973 (reported on 14.4% of returns)
Here:
+$7,973
State:
+$16,672
(% of AGI for various income ranges: 0.6% for AGIs below $25k, 0.8% for AGIs $50k-75k, 1.3% for AGIs $75k-100k, 3.0% for AGIs $100k-200k, 11.5% for AGIs over 200k)
Profit/loss from business: +$6,397 (reported on 11.3% of returns)
Here:
+$6,397
State:
+$14,116
(% of AGI for various income ranges: 5.5% for AGIs below $25k, 0.7% for AGIs $25k-50k, 2.8% for AGIs $50k-75k, 1.7% for AGIs $75k-100k, 0.1% for AGIs $100k-200k)
Taxable individual retirement arrangement distribution: $10,586 (reported on 12.3% of returns)
24558:
$10,586
Virginia:
$16,667
(% of AGI for various income ranges: 4.3% for AGIs below $25k, 3.0% for AGIs $25k-50k, 2.3% for AGIs $50k-75k, 3.0% for AGIs $75k-100k, 4.3% for AGIs $100k-200k)
Total itemized deductions: $21,024 (22% of AGI, reported on 23.2% of returns)
Here:
$21,024
State:
$26,596
Here:
22.3% of AGI
State:
20.1% of AGI
(% of AGI for various income ranges: 4.4% for AGIs below $25k, 10.4% for AGIs $25k-50k, 10.6% for AGIs $50k-75k, 11.7% for AGIs $75k-100k, 13.0% for AGIs $100k-200k, 13.2% for AGIs over 200k)
Charity contributions: $4,954 (reported on 20.8% of returns)
Here:
$4,954
State:
$4,443
(% of AGI for various income ranges: 0.5% for AGIs below $25k, 1.4% for AGIs $25k-50k, 2.0% for AGIs $50k-75k, 2.6% for AGIs $75k-100k, 2.8% for AGIs $100k-200k, 4.6% for AGIs over 200k)
Taxes paid: $5,986 (reported on 23.2% of returns)
24558:
$5,986
State:
$9,951
(% of AGI for various income ranges: 0.6% for AGIs below $25k, 1.7% for AGIs $25k-50k, 2.4% for AGIs $50k-75k, 3.4% for AGIs $75k-100k, 5.1% for AGIs $100k-200k, 5.4% for AGIs over 200k)
Earned income credit: $2,203 (reported on 24.3% of returns)
Here:
$2,203
State:
$2,211
(% of AGI for various income ranges: 7.7% for AGIs below $25k, 1.2% for AGIs $25k-50k)
Percentage of individuals using paid preparers for their 2012 taxes: 60.2%
Here:
60%
State:
46%
(% for various income ranges: 54.6% for AGIs below $25k, 59.8% for AGIs $25k-50k, 63.2% for AGIs $50k-75k, 71.4% for AGIs $75k-100k, 73.7% for AGIs $100k-200k, 80.0% for AGIs over 200k)
Averages for the 2004 tax year for zip code 24558, filed in 2005:
Average Adjusted Gross Income (AGI) in 2004: $37,911 (Individual Income Tax Returns)
Here:
$37,911
State:
$56,704
Salary/wage: $32,395 (reported on 86.3% of returns)
Here:
$32,395
State:
$48,441
(% of AGI for various income ranges: 96.9% for AGIs below $10k, 80.0% for AGIs $10k-25k, 80.0% for AGIs $25k-50k, 84.3% for AGIs $50k-75k, 76.2% for AGIs $75k-100k, 53.5% for AGIs over 100k)
Taxable interest for individuals: $1,643 (reported on 38.1% of returns)
This zip code:
$1,643
Virginia:
$1,688
(% of AGI for various income ranges: 4.1% for AGIs below $10k, 2.2% for AGIs $10k-25k, 1.4% for AGIs $25k-50k, 1.7% for AGIs $50k-75k, 1.5% for AGIs $75k-100k, 1.4% for AGIs over 100k)
Taxable dividends: $3,623 (reported on 18.9% of returns)
Here:
$3,623
State:
$4,028
(% of AGI for various income ranges: 4.2% for AGIs below $10k, 1.3% for AGIs $10k-25k, 1.1% for AGIs $25k-50k, 1.3% for AGIs $50k-75k, 2.0% for AGIs $75k-100k, 2.8% for AGIs over 100k)
Net capital gain/loss: +$5,995 (reported on 14.0% of returns)
Here:
+$5,995
State:
+$14,375
(% of AGI for various income ranges: -0.7% for AGIs below $10k, 0.3% for AGIs $10k-25k, 0.7% for AGIs $25k-50k, 0.6% for AGIs $50k-75k, 1.7% for AGIs $75k-100k, 6.4% for AGIs over 100k)
Profit/loss from business: +$5,477 (reported on 12.5% of returns)
Here:
+$5,477
State:
+$13,342
(% of AGI for various income ranges: -1.2% for AGIs below $10k, 1.9% for AGIs $10k-25k, 1.7% for AGIs $25k-50k, 1.7% for AGIs $50k-75k, 4.0% for AGIs $75k-100k, 1.3% for AGIs over 100k)
IRA payment deduction: $3,294 (reported on 2.3% of returns)
24558:
$3,294
Virginia:
$2,943
(% of AGI for various income ranges: 0.2% for AGIs $10k-25k, 0.4% for AGIs $25k-50k, 0.2% for AGIs $50k-75k, 0.4% for AGIs $75k-100k)
Total itemized deductions: $16,111 (21% of AGI, reported on 23.7% of returns)
Here:
$16,111
State:
$21,492
Here:
20.8% of AGI
State:
21.0% of AGI
(% of AGI for various income ranges: 5.6% for AGIs below $10k, 6.5% for AGIs $10k-25k, 9.5% for AGIs $25k-50k, 10.4% for AGIs $50k-75k, 13.7% for AGIs $75k-100k, 11.1% for AGIs over 100k)
Charity contributions deductions: $3,966 (5% of AGI, reported on 21.1% of returns)
Here:
$3,966
State:
$3,794
Here:
4.9% of AGI
State:
3.5% of AGI
(% of AGI for various income ranges: 1.0% for AGIs $10k-25k, 1.8% for AGIs $25k-50k, 2.0% for AGIs $50k-75k, 2.9% for AGIs $75k-100k, 3.3% for AGIs over 100k)
Total tax: $5,410 (reported on 68.8% of returns)
24558:
$5,410
State:
$9,537
(% of AGI for various income ranges: 2.0% for AGIs below $10k, 3.1% for AGIs $10k-25k, 6.3% for AGIs $25k-50k, 8.4% for AGIs $50k-75k, 10.7% for AGIs $75k-100k, 18.1% for AGIs over 100k)
Earned income credit: $1,794 (reported on 24.5% of returns)
Here:
$1,794
State:
$1,734
Percentage of individuals using paid preparers for their 2004 taxes: 70.4%
Here:
70%
State:
52%
(% for various income ranges: 65.1% for AGIs below $10k, 71.3% for AGIs $10k-25k, 70.5% for AGIs $25k-50k, 74.5% for AGIs $50k-75k, 72.5% for AGIs $75k-100k, 73.9% for AGIs over 100k)
Household received Food Stamps/SNAP in the past 12 months: 512 Household did not receive Food Stamps/SNAP in the past 12 months: 2,149
Women who had a birth in the past 12 months: 28 (17 now married, 10 unmarried) Women who did not have a birth in the past 12 months: 1,298 (433 now married, 870 unmarried)
Housing units in zip code 24558 with a mortgage: 907 (74 second mortgage, 37 both second mortgage and home equity loan) Houses without a mortgage: 20
Median monthly owner costs for units with a mortgage: $1,052 Median monthly owner costs for units without a mortgage: $359
Residents with income below the poverty level in 2022:
This zip code:
17.4%
Whole state:
10.6%
Residents with income below 50% of the poverty level in 2022:
This zip code:
9.5%
Whole state:
5.2%
Median number of rooms in houses and condos:
Here:
6.1
State:
7.0
Median number of rooms in apartments:
Here:
5.1
State:
4.3
Notable locations in this zip code not listed on our city pages
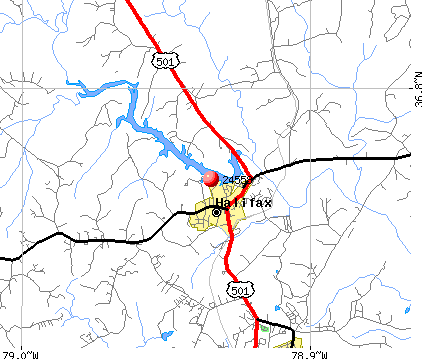
Notable locations in zip code 24558: Loves Shop (A), Oak Level (B), Halifax Country Club (C), Halifax County Courthouse (D), Halifax Police Department (E), Halifax County Sheriffs Office (F), Oak Level Fire Department (G), Halifax Fire Department (H). Display/hide their locations on the map
Churches in zip code 24558 include: Banister Hill Church (A), Revelation Church (B), Crystal Hill Church (C), Dan River Church (D), Emmanuel Church (E), Winn Creek Church (F), McKendree Church (G), Mount Olive Church (H), Mount Pleasant Church (I). Display/hide their locations on the map
Cemeteries: Winns Creek Cemetery (1), Pleasant Grove Cemetery (2), New Bethel Cemetery (3), Murphy Grove Cemetery (4), McKendree Cemetery (5), Halifax Town Cemetery (6), Dan River Cemetery (7). Display/hide their locations on the map
Streams, rivers, and creeks: Wolf Trap Creek (A), Winn Creek (B), Toots Creek (C), Terrible Creek (D), Sandy Creek (E), Polecat Creek (F), Myers Creek (G), Mill Branch (H), Kents Creek (I). Display/hide their locations on the map
Parks in zip code 24558 include: Dan River Wildlife Management Area (1), Wolftrap Wildlife Management Area (2), Mountain Road Historic District (3). Display/hide their locations on the map
In group quarters: 192 (-1 institutionalized population)
Size of family households: 933 2-persons, 420 3-persons, 232 4-persons, 136 5-persons, 10 7-or-more-persons
Size of nonfamily households: 849 1-person, 31 2-persons
453 married couples with children.
342 single-parent households (72 men, 270 women).
95.6% of residents of 24558 zip code speak English at home.
2.8% of residents speak Spanish at home (62% very well, 23% well, 14% not well, 1% not at all).
1.6% of residents speak other Indo-European language at home (65% very well, 12% not well, 23% not at all).
0.2% of residents speak Asian or Pacific Island language at home (100% very well).
0.3% of residents speak other language at home (100% very well).
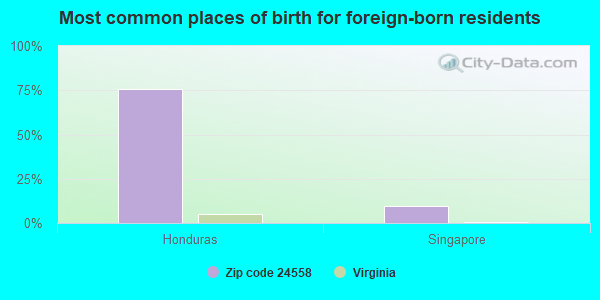
Foreign born population: 107 (1.7%) (70.0% of them are naturalized citizens)
This zip code:
1.7%
Whole state:
12.7%
75%Honduras
9%Singapore
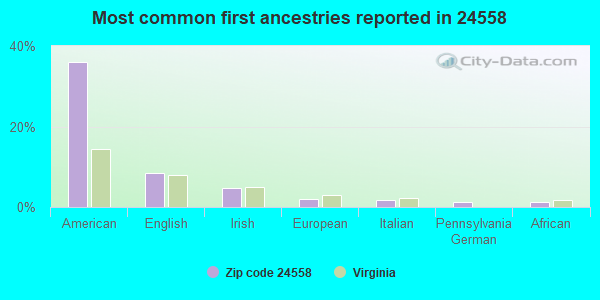
36%American
9%English
5%Irish
2%European
2%Italian
1%Pennsylvania German
1%African
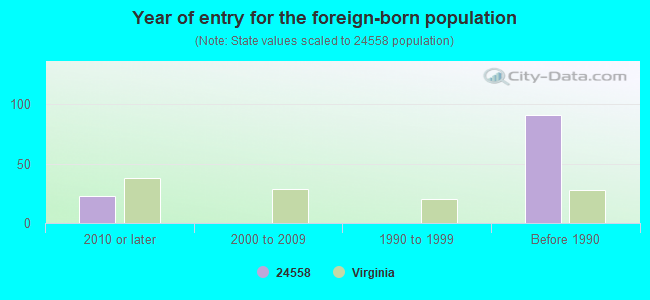
Year of entry for the foreign-born population
232010 or later
02000 to 2009
01990 to 1999
91Before 1990
Facilities with environmental interests located in this zip code:
AIR SYNTHETIC MINOR (AIRS/AFS) CRITERIA AND HAZARDOUS AIR POLLUTANT INVENTORY (Inventory of air pollution sources) Small Quantity Generators, between 100 kg and 1000 kg of hazardous waste/month (Resource Conservation and Recovery Act (tracking hazardous waste)) - notification TRI REPORTER (Tracking of toxic chemicals releasing facilities) Business SIC classification: BROADWOVEN FABRIC MILLS, MANMADE FIBER AND SILK; BROADWOVEN FABRIC MILLS, WOOL (INCLUDING DYEING AND FINISHING) Business NAICS classification: BROADWOVEN FABRIC MILLS. Organizations: OPERNAME (CONTACT/OPERATOR)
, BURLINGTON IND INC (CONTACT/OWNER)
Alternative names: BURLINGTON INDUSTRIES INCORPORATED, BURLINGTON IND INC HALIFAX
BIG JOHN AUTO PARTS (2064 DUDLEY ROAD in HALIFAX, VA)
AIR MINOR (AIRS/AFS) Business SIC classification: MOTOR VEHICLE PARTS, USED; GENERAL AUTOMOTIVE REPAIR SHOPS; AUTOMOTIVE REPAIR SHOPS
BYRD'S AUTO REPAIR (7069 L P BAILEY HIGHWAY in HALIFAX, VA)
AIR MINOR (AIRS/AFS) Business SIC classification: TOP, BODY, AND UPHOLSTERY REPAIR SHOPS AND PAINT SHOPS; GENERAL AUTOMOTIVE REPAIR SHOPS; AUTOMOTIVE REPAIR SHOPS
CARR'S INC (2150 L P BAILEY HIGHWAY in HALIFAX, VA)
AIR MINOR (AIRS/AFS) Business SIC classification: MOTOR VEHICLE PARTS, USED; GENERAL AUTOMOTIVE REPAIR SHOPS; AUTOMOTIVE REPAIR SHOPS
Housing units lacking complete plumbing facilities: 3.9% Housing units lacking complete kitchen facilities: 5.5%
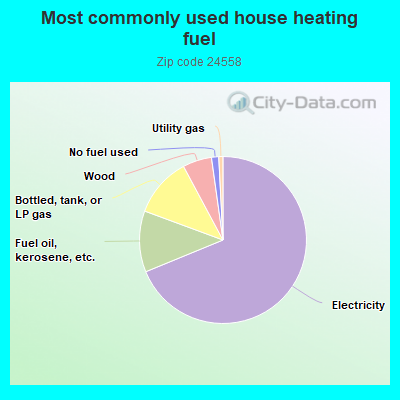
68.6%Electricity
11.8%Fuel oil, kerosene, etc.
11.5%Bottled, tank, or LP gas
5.6%Wood
1.4%No fuel used
0.8%Utility gas
Population in 1990: 7,127.
Place of birth for U.S.-born residents:
This state: 4,730
Northeast: 407
Midwest: 137
South: 704
West: 37
64% of the 24558 zip code residents lived in the same house 5 years ago. Out of people who lived in different houses, 63% lived in this county. Out of people who lived in different counties, 50% lived in Virginia.
96% of the 24558 zip code residents lived in the same house 1 year ago. Out of people who lived in different houses, 57% moved from this county. Out of people who lived in different houses, 43% moved from different county within same state. Out of people who lived in different houses, 5% moved from different state. Out of people who lived in different houses, 2% moved from abroad.
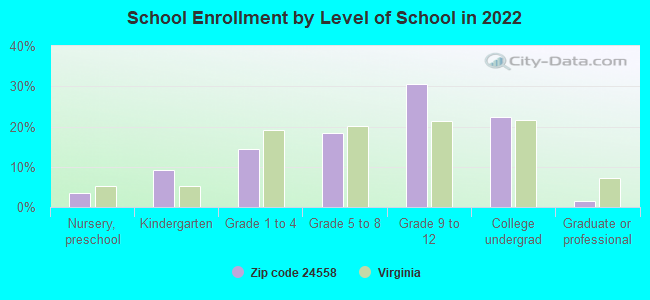
Private vs. public school enrollment:
Students in private schools in grades 1 to 8 (elementary and middle school): 40
Here:
13.1%
Virginia:
13.2%
Students in private schools in grades 9 to 12 (high school): 22
Here:
7.7%
Virginia:
10.2%
Students in private undergraduate colleges: 45
Here:
21.3%
Virginia:
18.7%
Occupation by median earnings in the past 12 months ($)
98,306Health diagnosing and treating practitioners and other technical occupations
65,238Business and financial operations occupations
61,566Law enforcement workers including supervisors
54,054Community and social service occupations
51,103Management occupations
49,554Health technologists and technicians
Companies with federal contracts located in this zip code:
HALIFAX COUNTY PUBLIC SCHOOLS (1030 MARY BETHUNE ST in HALIFAX, VA)
$3,408 with Army for Passenger Motor Charter Service. Signed on 2005-06-15. Completion date: 2005-06-25.
Top industries in this zip code by the number of employees in 2005:
Health Care and Social Assistance: Home Health Care Services (50-99 employees: 1 establishment, 10-19 employees: 1 establishment)
Accommodation and Food Services: Limited-Service Restaurants (20-49: 1, 1-4: 2)
Health Care and Social Assistance: Ambulance Services (20-49: 1)
Professional, Scientific, and Technical Services: Offices of Lawyers (5-9: 3, 1-4: 6)
Accommodation and Food Services: Caterers (20-49: 1)
Other Services (except Public Administration): Religious Organizations (5-9: 2, 1-4: 9)
Construction: New Single-Family Housing Construction (except Operative Builders) (5-9: 3, 1-4: 1)
People in group quarters in 2010:
161 people in local jails and other municipal confinement facilities
13 people in nursing facilities/skilled-nursing facilities
11 people in group homes intended for adults
5 people in workers' group living quarters and job corps centers
People in group quarters in 2000:
152 people in local jails and other confinement facilities (including police lockups)
24 people in nursing homes
17 people in other group homes
12 people in other noninstitutional group quarters
Fatal accident statistics in 2014:
Fatal accident count: 1
Vehicles involved in fatal accidents: 2
Fatal accidents caused by drunken drivers: 0
Fatalities: 1
Persons involved in fatal accidents: 3
Pedestrians involved in fatal accidents: 0
Fatal accident statistics in 2012:
Fatal accident count: 1
Vehicles involved in fatal accidents: 1
Fatal accidents caused by drunken drivers: 0
Fatalities: 1
Persons involved in fatal accidents: 3
Pedestrians involved in fatal accidents: 0
2002 - 2018 National Fire Incident Reporting System (NFIRS) incidents
According to the data from the years 2002 - 2018 the average number of fire incidents per year is 41. The highest number of reported fires - 76 took place in 2010, and the least - 3 in 2003. The data has a rising trend.
When looking into fire subcategories, the most incidents belonged to: Outside Fires (46.1%), and Structure Fires (40.7%).
Fire incident types reported to NFIRS in Zip Code 24558


 Nearest zip codes: 24539, 24592, 24597, 24577, 24589, 24520.


 According to the data from the years 2002 - 2018 the average number of fire incidents per year is 41. The highest number of reported fires - 76 took place in 2010, and the least - 3 in 2003. The data has a rising trend.
 When looking into fire subcategories, the most incidents belonged to: Outside Fires (46.1%), and Structure Fires (40.7%).