Estimated zip code population in 2022: 1,951 Zip code population in 2010: 1,437 Zip code population in 2000: 1,271
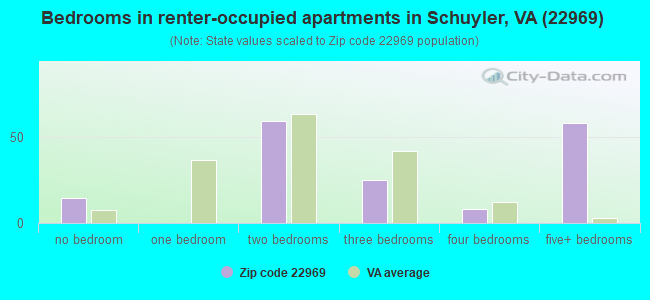
Houses and condos: 778 Renter-occupied apartments: 163
% of renters here:
24%
State:
33%
March 2022 cost of living index in zip code 22969: 86.0 (less than average, U.S. average is 100)
Land area: 43.7 sq. mi. Water area: 0.1 sq. mi.
Population density: 45 people per square mile
(very low).
OSM Map
General Map
Google Map
MSN Map
OSM Map
General Map
Google Map
MSN Map
OSM Map
General Map
Google Map
MSN Map
OSM Map
General Map
Google Map
MSN Map
Please wait while loading the map...
Real estate property taxes paid for housing units in 2022:
This zip code:
0.6% ($1,407)
Virginia:
0.7% ($2,617)
Median real estate property taxes paid for housing units with mortgages in 2022: $1,372 (0.5%) Median real estate property taxes paid for housing units with no mortgage in 2022: $1,548 (0.6%)
Business Search- 14 Million verified businesses
Males: 1,088
(55.8%)
Females: 862
(44.2%)
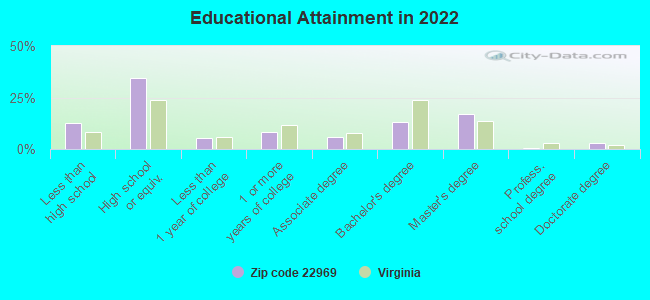
For population 25 years and over in 22969:
High school or higher: 87.0%
Bachelor's degree or higher: 33.3%
Graduate or professional degree: 20.4%
Unemployed: 2.0%
Mean travel time to work (commute): 35.1 minutes
For population 15 years and over in 22969:
Never married: 26.3%
Now married: 58.9%
Separated: 1.2%
Widowed: 4.6%
Divorced: 9.0%
Zip code 22969 compared to state average:
Unemployed percentage below state average.
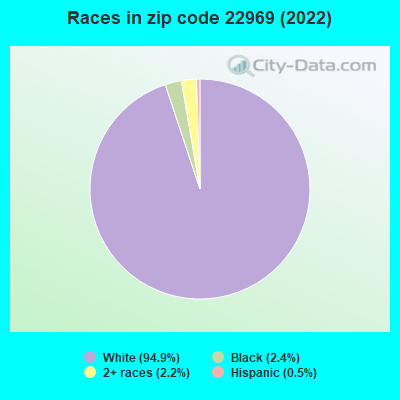
Black race population percentage significantly below state average.
Hispanic race population percentage significantly below state average.
Foreign-born population percentage significantly below state average.
Length of stay since moving in significantly above state average.
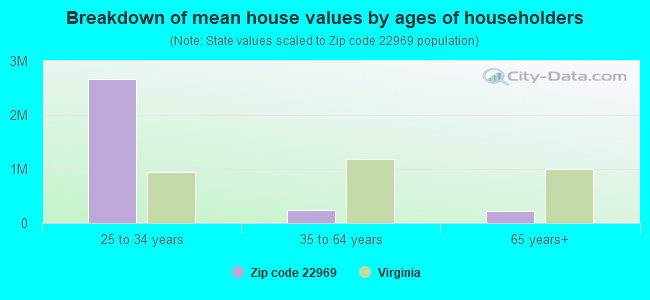
Estimated median house/condo value in 2022: $252,051
22969:
$252,051
Virginia:
$365,700
According to our research of Virginia and other state lists, there were 2 registered sex offenders living in 22969 zip code as of May 19, 2024. The ratio of all residents to sex offenders in zip code 22969 is 453 to 1. The ratio of registered sex offenders to all residents in this zip code is lower than the state average.
Median resident age:
This zip code:
39.8 years
Virginia median age:
39.0 years
Average household size:
This zip code:
2.8 people
Virginia:
2.5 people
Averages for the 2020 tax year for zip code 22969, filed in 2021:
Average Adjusted Gross Income (AGI) in 2020: $56,519 (Individual Income Tax Returns)
Here:
$56,519
State:
$86,446
Salary/wage: $45,915 (reported on 87.1% of returns)
Here:
$45,915
State:
$71,185
(% of AGI for various income ranges: 1092.5% for AGIs below $25k, 3633.8% for AGIs $25k-50k, 5763.3% for AGIs $50k-75k, 8208.3% for AGIs $75k-100k, 17698.0% for AGIs $100k-200k)
Taxable interest for individuals: $794 (reported on 25.8% of returns)
This zip code:
$794
Virginia:
$1,805
(% of AGI for various income ranges: 9.4% for AGIs below $25k, 3.1% for AGIs $25k-50k, 33.3% for AGIs $50k-75k, 26.7% for AGIs $75k-100k, 142.0% for AGIs $100k-200k)
Ordinary dividends: $1,838 (reported on 12.9% of returns)
Here:
$1,838
State:
$8,327
(% of AGI for various income ranges: 47.5% for AGIs below $25k, 61.7% for AGIs $50k-75k, 68.0% for AGIs $100k-200k)
Net capital gain/loss in AGI: +$13,625 (reported on 12.9% of returns)
Here:
+$13,625
State:
+$24,644
(% of AGI for various income ranges: 11.9% for AGIs $25k-50k, 1.7% for AGIs $50k-75k, 2140.0% for AGIs $100k-200k)
Profit/loss from business: +$7,300 (reported on 14.5% of returns)
Here:
+$7,300
State:
+$12,836
(% of AGI for various income ranges: 121.9% for AGIs below $25k, 211.2% for AGIs $25k-50k, 206.7% for AGIs $75k-100k)
Taxable individual retirement arrangement distribution: $12,440 (reported on 8.1% of returns)
22969:
$12,440
Virginia:
$21,535
(% of AGI for various income ranges: 98.1% for AGIs below $25k, 775.0% for AGIs $75k-100k)
Total itemized deductions: $26,750 (reported on 3.2% of returns)
Here:
$26,750
State:
$33,287
(% of AGI for various income ranges: 891.7% for AGIs $50k-75k)
Taxes paid: $7,450 (reported on 3.2% of returns)
22969:
$7,450
State:
$8,284
(% of AGI for various income ranges: 248.3% for AGIs $50k-75k)
Earned income credit: $2,225 (reported on 19.4% of returns)
Here:
$2,225
State:
$2,214
(% of AGI for various income ranges: 107.5% for AGIs below $25k, 59.4% for AGIs $25k-50k)
Percentage of individuals using paid preparers for their 2020 taxes: 91.9%
Here:
92%
State:
92%
(% for various income ranges: 94.7% for AGIs below $25k, 90.0% for AGIs $25k-50k, 87.5% for AGIs $50k-75k, 85.7% for AGIs $75k-100k, 100.0% for AGIs $100k-200k)
Averages for the 2012 tax year for zip code 22969, filed in 2013:
Average Adjusted Gross Income (AGI) in 2012: $40,553 (Individual Income Tax Returns)
Here:
$40,553
State:
$71,192
Salary/wage: $38,021 (reported on 81.4% of returns)
Here:
$38,021
State:
$59,229
(% of AGI for various income ranges: 75.8% for AGIs below $25k, 82.6% for AGIs $25k-50k, 72.5% for AGIs $50k-75k, 78.5% for AGIs $75k-100k, 71.6% for AGIs $100k-200k)
Taxable interest for individuals: $736 (reported on 23.7% of returns)
This zip code:
$736
Virginia:
$1,600
(% of AGI for various income ranges: 0.9% for AGIs below $25k, 0.5% for AGIs $25k-50k, 0.6% for AGIs $50k-75k, 0.2% for AGIs $100k-200k)
Ordinary dividends: $1,771 (reported on 11.9% of returns)
Here:
$1,771
State:
$6,959
Net capital gain/loss in AGI: +$1,300 (reported on 8.5% of returns)
Here:
+$1,300
State:
+$16,672
Profit/loss from business: +$8,309 (reported on 18.6% of returns)
Here:
+$8,309
State:
+$14,116
(% of AGI for various income ranges: 10.3% for AGIs below $25k, 3.5% for AGIs $25k-50k, 5.9% for AGIs $50k-75k)
Taxable individual retirement arrangement distribution: $7,975 (reported on 6.8% of returns)
22969:
$7,975
Virginia:
$16,667
Total itemized deductions: $16,619 (26% of AGI, reported on 27.1% of returns)
Here:
$16,619
State:
$26,596
Here:
25.9% of AGI
State:
20.1% of AGI
(% of AGI for various income ranges: 12.0% for AGIs $25k-50k, 12.7% for AGIs $50k-75k, 12.2% for AGIs $75k-100k, 14.4% for AGIs $100k-200k)
Charity contributions: $2,350 (reported on 16.9% of returns)
Here:
$2,350
State:
$4,443
(% of AGI for various income ranges: 0.4% for AGIs $25k-50k, 0.8% for AGIs $50k-75k, 3.2% for AGIs $100k-200k)
Taxes paid: $4,675 (reported on 27.1% of returns)
22969:
$4,675
State:
$9,951
(% of AGI for various income ranges: 2.6% for AGIs $25k-50k, 3.4% for AGIs $50k-75k, 3.8% for AGIs $75k-100k, 5.1% for AGIs $100k-200k)
Earned income credit: $2,569 (reported on 22.0% of returns)
Here:
$2,569
State:
$2,211
(% of AGI for various income ranges: 8.0% for AGIs below $25k, 1.2% for AGIs $25k-50k)
Percentage of individuals using paid preparers for their 2012 taxes: 39.0%
Here:
39%
State:
46%
(% for various income ranges: 39.1% for AGIs below $25k, 38.9% for AGIs $25k-50k, 40.0% for AGIs $50k-75k, 75.0% for AGIs $75k-100k)
Averages for the 2004 tax year for zip code 22969, filed in 2005:
Average Adjusted Gross Income (AGI) in 2004: $32,969 (Individual Income Tax Returns)
Here:
$32,969
State:
$56,704
Salary/wage: $31,260 (reported on 87.8% of returns)
Here:
$31,260
State:
$48,441
(% of AGI for various income ranges: 94.4% for AGIs below $10k, 82.0% for AGIs $10k-25k, 86.7% for AGIs $25k-50k, 82.0% for AGIs $50k-75k, 78.9% for AGIs $75k-100k, 81.3% for AGIs over 100k)
Taxable interest for individuals: $650 (reported on 32.4% of returns)
This zip code:
$650
Virginia:
$1,688
(% of AGI for various income ranges: 7.8% for AGIs below $10k, 0.6% for AGIs $10k-25k, 0.4% for AGIs $25k-50k, 0.7% for AGIs $50k-75k, 0.4% for AGIs $75k-100k, 0.2% for AGIs over 100k)
Taxable dividends: $817 (reported on 13.0% of returns)
Here:
$817
State:
$4,028
(% of AGI for various income ranges: 1.4% for AGIs below $10k, 0.3% for AGIs $25k-50k, 0.2% for AGIs $50k-75k, 1.0% for AGIs $75k-100k)
Profit/loss from business: +$10,000 (reported on 15.7% of returns)
Here:
+$10,000
State:
+$13,342
(% of AGI for various income ranges: 3.3% for AGIs below $10k, 8.7% for AGIs $10k-25k, 6.4% for AGIs $25k-50k, 4.8% for AGIs $50k-75k)
Total itemized deductions: $12,661 (22% of AGI, reported on 21.6% of returns)
Here:
$12,661
State:
$21,492
Here:
21.5% of AGI
State:
21.0% of AGI
(% of AGI for various income ranges: 5.7% for AGIs $10k-25k, 7.4% for AGIs $25k-50k, 8.8% for AGIs $50k-75k, 11.1% for AGIs $75k-100k, 11.7% for AGIs over 100k)
Charity contributions deductions: $1,414 (2% of AGI, reported on 15.9% of returns)
Here:
$1,414
State:
$3,794
Here:
2.4% of AGI
State:
3.5% of AGI
(% of AGI for various income ranges: 1.1% for AGIs below $10k, 0.6% for AGIs $25k-50k, 0.5% for AGIs $50k-75k, 2.1% for AGIs $75k-100k)
Total tax: $3,891 (reported on 71.8% of returns)
22969:
$3,891
State:
$9,537
(% of AGI for various income ranges: 2.2% for AGIs below $10k, 4.1% for AGIs $10k-25k, 7.2% for AGIs $25k-50k, 9.4% for AGIs $50k-75k, 11.2% for AGIs $75k-100k, 15.2% for AGIs over 100k)
Earned income credit: $1,568 (reported on 20.3% of returns)
Here:
$1,568
State:
$1,734
Percentage of individuals using paid preparers for their 2004 taxes: 45.3%
Here:
45%
State:
52%
(% for various income ranges: 50.0% for AGIs below $10k, 43.2% for AGIs $10k-25k, 42.0% for AGIs $25k-50k, 54.5% for AGIs $50k-75k, 52.9% for AGIs $75k-100k)
Household received Food Stamps/SNAP in the past 12 months: 33 Household did not receive Food Stamps/SNAP in the past 12 months: 653
Women who had a birth in the past 12 months: 5 (5 now married, 0 unmarried) Women who did not have a birth in the past 12 months: 422 (261 now married, 157 unmarried)
Housing units in zip code 22969 with a mortgage: 273 (17 second mortgage, 17 both second mortgage and home equity loan) Houses without a mortgage: 11
Median monthly owner costs for units with a mortgage: $1,270 Median monthly owner costs for units without a mortgage: $463
Residents with income below the poverty level in 2022:
This zip code:
26.7%
Whole state:
10.6%
Residents with income below 50% of the poverty level in 2022:
This zip code:
24.7%
Whole state:
5.2%
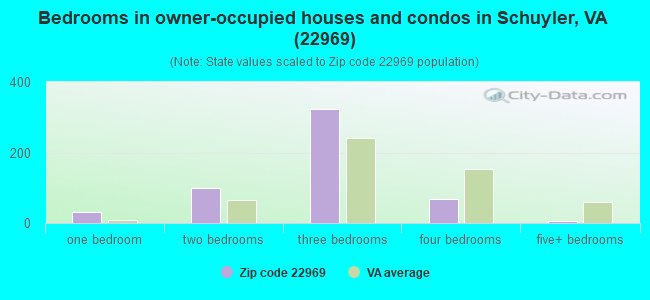
Median number of rooms in houses and condos:
Here:
6.1
State:
7.0
Median number of rooms in apartments:
Here:
6.8
State:
4.3
Notable locations in this zip code not listed on our city pages
Churches in zip code 22969 include: Bethel Church (A), Saint Joys Church (B), Salem Church (C), Centenary Church (D), Oak Ridge Church (E). Display/hide their locations on the map
Streams, rivers, and creeks: Sheepneck Branch (A), Ivy Creek (B), Glade Creek (C), Cedar Branch (D), Buffalo Creek (E), Briar Fork (F). Display/hide their locations on the map
Size of family households: 201 2-persons, 36 3-persons, 148 4-persons, 39 5-persons, 64 6-persons
Size of nonfamily households: 131 1-person, 64 2-persons, 8 3-persons
396 married couples with children.
0 single-parent households ().
99.6% of residents of 22969 zip code speak English at home.
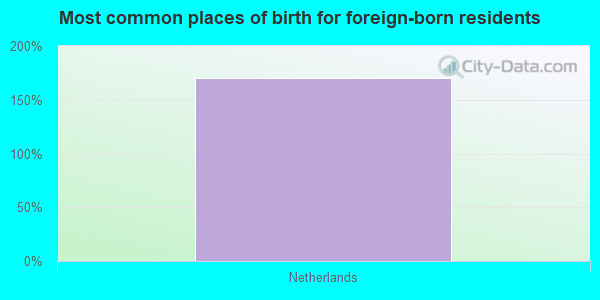
Foreign born population: 31 (1.6%) (100.0% of them are naturalized citizens)
This zip code:
1.6%
Whole state:
12.7%
170%Netherlands
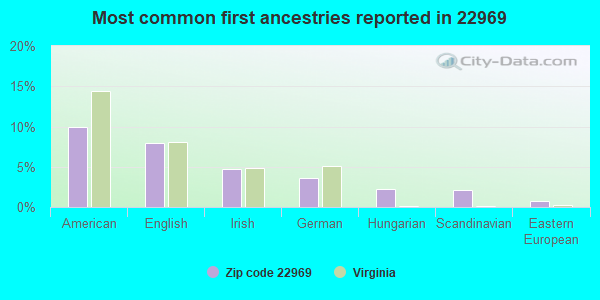
10%American
8%English
5%Irish
4%German
2%Hungarian
2%Scandinavian
1%Eastern European
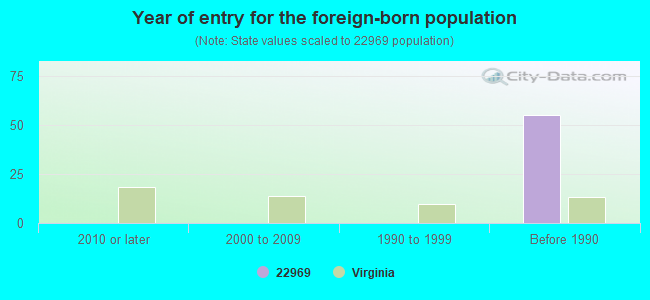
Year of entry for the foreign-born population
02010 or later
02000 to 2009
01990 to 1999
55Before 1990
Housing units lacking complete plumbing facilities: 9.5% Housing units lacking complete kitchen facilities: 8.8%
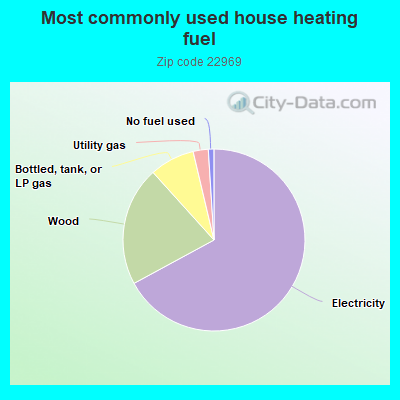
67.3%Electricity
21.3%Wood
8.0%Bottled, tank, or LP gas
2.7%Utility gas
1.0%No fuel used
Population in 1990: 1,128. Population change in the 1990s: +143 (+12.7%).
Place of birth for U.S.-born residents:
This state: 1,446
Northeast: 154
Midwest: 79
South: 199
63% of the 22969 zip code residents lived in the same house 5 years ago. Out of people who lived in different houses, 30% lived in this county. Out of people who lived in different counties, 50% lived in Virginia.
99% of the 22969 zip code residents lived in the same house 1 year ago. Out of people who lived in different houses, 100% moved from this county. Out of people who lived in different houses, 29% moved from abroad.
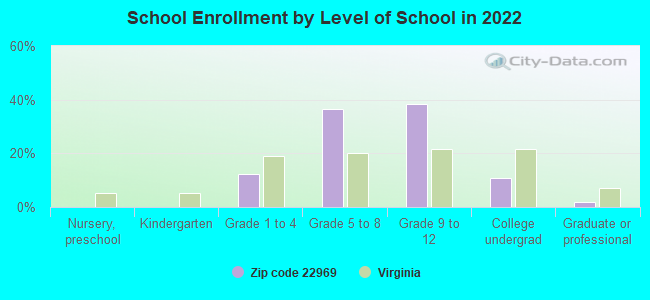
Private vs. public school enrollment:
Students in private schools in grades 1 to 8 (elementary and middle school): 19
Here:
6.7%
Virginia:
13.2%
Students in private schools in grades 9 to 12 (high school): 53
Here:
24.2%
Virginia:
10.2%
Students in private undergraduate colleges: 21
Here:
33.2%
Virginia:
18.7%
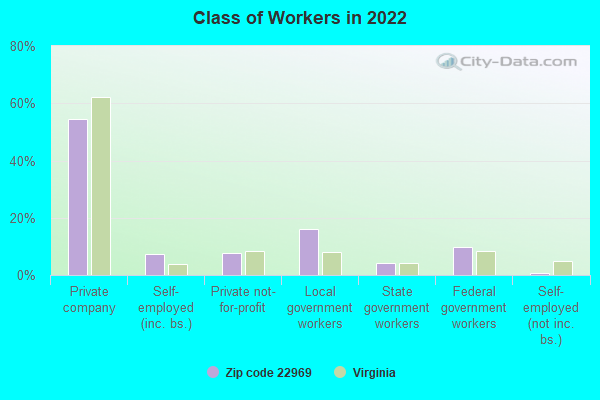
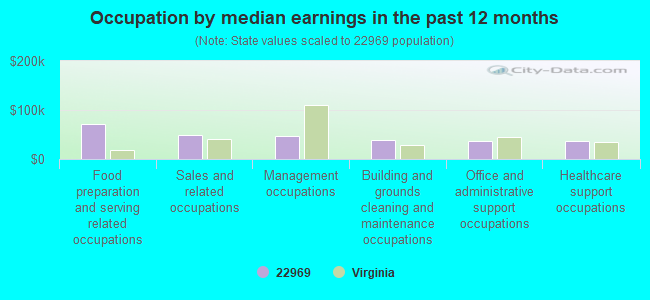
Occupation by median earnings in the past 12 months ($)
70,478Food preparation and serving related occupations
48,335Sales and related occupations
47,896Management occupations
38,006Building and grounds cleaning and maintenance occupations
37,358Office and administrative support occupations
36,992Healthcare support occupations
Top industries in this zip code by the number of employees in 2005:
Arts, Entertainment, and Recreation: Museums (5-9 employees: 1 establishment)
Administrative and Support and Waste Management and Remediation Services: Landscaping Services (5-9: 1)
Other Services (except Public Administration): Religious Organizations (1-4: 3)
Real Estate and Rental and Leasing: Video Tape and Disc Rental (1-4: 1)
Construction: Poured Concrete Foundation and Structure Contractors (1-4: 1)
Finance and Insurance: Insurance Agencies and Brokerages (1-4: 1)
Construction: All Other Specialty Trade Contractors (1-4: 1)
Arts, Entertainment, and Recreation: Independent Artists, Writers, and Performers (1-4: 1)
People in group quarters in 2000:
7 people in religious group quarters
Home Mortgage Disclosure Act Aggregated Statistics For Year 2009 (Based on 2 partial tracts)
A) FHA, FSA/RHS & VA Home Purchase Loans
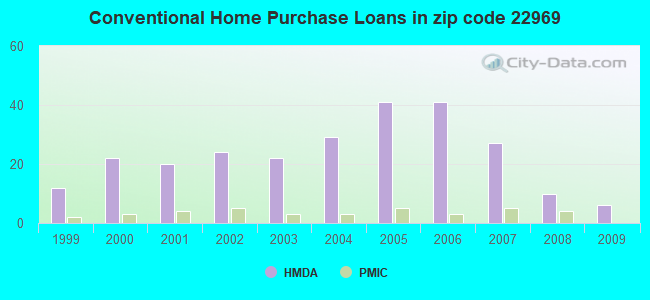
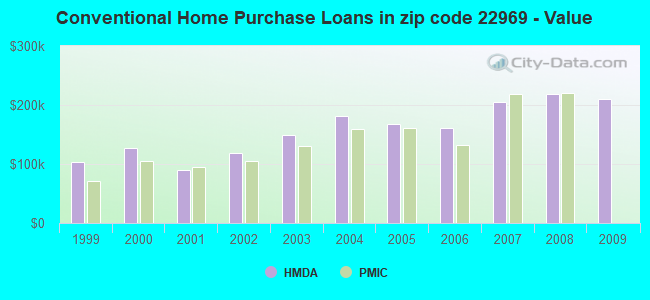
B) Conventional Home Purchase Loans
C) Refinancings
D) Home Improvement Loans
F) Non-occupant Loans on < 5 Family Dwellings (A B C & D)
G) Loans On Manufactured Home Dwelling (A B C & D)
Number
Average Value
Number
Average Value
Number
Average Value
Number
Average Value
Number
Average Value
Number
Average Value
LOANS ORIGINATED
8
$211,848
6
$210,275
47
$208,870
6
$64,488
3
$149,883
2
$138,795
APPLICATIONS APPROVED, NOT ACCEPTED
0
$0
1
$156,810
2
$195,585
0
$0
0
$0
0
$0
APPLICATIONS DENIED
0
$0
2
$134,555
29
$171,522
4
$24,158
4
$151,190
2
$75,225
APPLICATIONS WITHDRAWN
2
$184,140
2
$262,330
13
$205,445
1
$118,240
1
$211,900
1
$261,060
FILES CLOSED FOR INCOMPLETENESS
0
$0
0
$0
3
$771,457
0
$0
0
$0
0
$0
Aggregated Statistics For Year 2008 (Based on 2 partial tracts)
A) FHA, FSA/RHS & VA Home Purchase Loans
B) Conventional Home Purchase Loans
C) Refinancings
D) Home Improvement Loans
F) Non-occupant Loans on < 5 Family Dwellings (A B C & D)
G) Loans On Manufactured Home Dwelling (A B C & D)
Number
Average Value
Number
Average Value
Number
Average Value
Number
Average Value
Number
Average Value
Number
Average Value
LOANS ORIGINATED
5
$170,114
10
$218,850
32
$204,973
9
$71,246
6
$377,323
3
$130,813
APPLICATIONS APPROVED, NOT ACCEPTED
0
$0
2
$154,050
4
$163,692
1
$98,320
1
$121,210
0
$0
APPLICATIONS DENIED
1
$197,070
2
$136,040
31
$168,016
10
$54,543
3
$160,620
4
$93,978
APPLICATIONS WITHDRAWN
0
$0
3
$194,243
14
$186,351
1
$45,350
1
$261,060
1
$174,610
FILES CLOSED FOR INCOMPLETENESS
0
$0
0
$0
3
$180,540
0
$0
0
$0
0
$0
Aggregated Statistics For Year 2007 (Based on 2 partial tracts)
A) FHA, FSA/RHS & VA Home Purchase Loans
B) Conventional Home Purchase Loans
C) Refinancings
D) Home Improvement Loans
F) Non-occupant Loans on < 5 Family Dwellings (A B C & D)
G) Loans On Manufactured Home Dwelling (A B C & D)
Number
Average Value
Number
Average Value
Number
Average Value
Number
Average Value
Number
Average Value
Number
Average Value
LOANS ORIGINATED
3
$128,130
27
$205,433
54
$229,613
16
$39,758
4
$1,217,152
5
$96,456
APPLICATIONS APPROVED, NOT ACCEPTED
0
$0
5
$188,930
11
$106,451
2
$64,840
1
$175,880
3
$87,020
APPLICATIONS DENIED
1
$199,610
8
$179,902
39
$167,042
14
$30,695
2
$180,750
8
$63,358
APPLICATIONS WITHDRAWN
0
$0
3
$176,867
24
$174,129
1
$178,000
1
$102,140
2
$28,605
FILES CLOSED FOR INCOMPLETENESS
0
$0
1
$177,570
4
$182,340
1
$29,670
0
$0
0
$0
Aggregated Statistics For Year 2006 (Based on 2 partial tracts)
A) FHA, FSA/RHS & VA Home Purchase Loans
B) Conventional Home Purchase Loans
C) Refinancings
D) Home Improvement Loans
F) Non-occupant Loans on < 5 Family Dwellings (A B C & D)
G) Loans On Manufactured Home Dwelling (A B C & D)
Number
Average Value
Number
Average Value
Number
Average Value
Number
Average Value
Number
Average Value
Number
Average Value
LOANS ORIGINATED
4
$128,305
41
$161,788
73
$171,813
17
$67,434
11
$357,340
9
$118,004
APPLICATIONS APPROVED, NOT ACCEPTED
0
$0
3
$84,193
12
$107,433
3
$61,027
0
$0
2
$69,505
APPLICATIONS DENIED
0
$0
8
$139,748
56
$109,197
14
$42,652
5
$96,202
11
$70,389
APPLICATIONS WITHDRAWN
0
$0
3
$110,753
33
$208,535
5
$110,272
2
$1,060,135
3
$56,647
FILES CLOSED FOR INCOMPLETENESS
1
$82,220
0
$0
5
$122,308
0
$0
0
$0
1
$105,530
Aggregated Statistics For Year 2005 (Based on 2 partial tracts)
A) FHA, FSA/RHS & VA Home Purchase Loans
B) Conventional Home Purchase Loans
C) Refinancings
D) Home Improvement Loans
F) Non-occupant Loans on < 5 Family Dwellings (A B C & D)
G) Loans On Manufactured Home Dwelling (A B C & D)
Number
Average Value
Number
Average Value
Number
Average Value
Number
Average Value
Number
Average Value
Number
Average Value
LOANS ORIGINATED
5
$146,974
41
$167,701
62
$138,015
13
$46,878
8
$180,328
7
$87,303
APPLICATIONS APPROVED, NOT ACCEPTED
0
$0
6
$184,353
14
$93,387
1
$902,690
1
$308,950
1
$53,400
APPLICATIONS DENIED
2
$134,555
7
$139,127
50
$111,756
13
$44,890
4
$82,960
8
$93,978
APPLICATIONS WITHDRAWN
1
$148,330
6
$152,850
25
$102,017
4
$136,040
2
$162,950
2
$62,085
FILES CLOSED FOR INCOMPLETENESS
0
$0
0
$0
7
$143,850
0
$0
0
$0
0
$0
Aggregated Statistics For Year 2004 (Based on 2 partial tracts)
A) FHA, FSA/RHS & VA Home Purchase Loans
B) Conventional Home Purchase Loans
C) Refinancings
D) Home Improvement Loans
F) Non-occupant Loans on < 5 Family Dwellings (A B C & D)
G) Loans On Manufactured Home Dwelling (A B C & D)
Number
Average Value
Number
Average Value
Number
Average Value
Number
Average Value
Number
Average Value
Number
Average Value
LOANS ORIGINATED
4
$150,130
29
$180,568
63
$123,521
15
$56,479
11
$276,317
4
$87,302
APPLICATIONS APPROVED, NOT ACCEPTED
0
$0
6
$140,490
10
$105,272
3
$148,190
1
$41,110
1
$98,750
APPLICATIONS DENIED
1
$55,090
10
$123,665
36
$94,543
11
$36,794
2
$70,350
11
$67,461
APPLICATIONS WITHDRAWN
0
$0
4
$206,178
20
$104,212
3
$61,170
0
$0
1
$99,590
FILES CLOSED FOR INCOMPLETENESS
0
$0
2
$69,715
3
$227,580
0
$0
0
$0
1
$56,370
Aggregated Statistics For Year 2003 (Based on 2 partial tracts)
A) FHA, FSA/RHS & VA Home Purchase Loans
B) Conventional Home Purchase Loans
C) Refinancings
D) Home Improvement Loans
F) Non-occupant Loans on < 5 Family Dwellings (A B C & D)
Number
Average Value
Number
Average Value
Number
Average Value
Number
Average Value
Number
Average Value
LOANS ORIGINATED
4
$114,955
22
$148,523
95
$131,449
14
$15,953
8
$207,132
APPLICATIONS APPROVED, NOT ACCEPTED
1
$124,600
3
$55,800
14
$108,705
1
$5,930
1
$103,830
APPLICATIONS DENIED
1
$94,080
4
$84,865
37
$95,149
8
$17,905
2
$77,555
APPLICATIONS WITHDRAWN
2
$84,335
6
$115,132
17
$105,052
0
$0
0
$0
FILES CLOSED FOR INCOMPLETENESS
0
$0
0
$0
4
$111,882
1
$39,410
0
$0
Aggregated Statistics For Year 2002 (Based on 2 partial tracts)
A) FHA, FSA/RHS & VA Home Purchase Loans
B) Conventional Home Purchase Loans
C) Refinancings
D) Home Improvement Loans
F) Non-occupant Loans on < 5 Family Dwellings (A B C & D)
Number
Average Value
Number
Average Value
Number
Average Value
Number
Average Value
Number
Average Value
LOANS ORIGINATED
8
$114,372
24
$119,459
67
$116,792
8
$10,966
3
$156,947
APPLICATIONS APPROVED, NOT ACCEPTED
1
$108,920
6
$70,845
12
$97,792
1
$8,050
0
$0
APPLICATIONS DENIED
1
$61,450
8
$78,298
33
$85,672
8
$18,329
1
$10,600
APPLICATIONS WITHDRAWN
0
$0
4
$104,785
25
$102,119
3
$6,357
0
$0
FILES CLOSED FOR INCOMPLETENESS
0
$0
1
$116,970
4
$77,450
1
$7,200
0
$0
Aggregated Statistics For Year 2001 (Based on 2 partial tracts)
A) FHA, FSA/RHS & VA Home Purchase Loans
B) Conventional Home Purchase Loans
C) Refinancings
D) Home Improvement Loans
F) Non-occupant Loans on < 5 Family Dwellings (A B C & D)
Number
Average Value
Number
Average Value
Number
Average Value
Number
Average Value
Number
Average Value
LOANS ORIGINATED
5
$109,426
20
$89,146
50
$112,926
10
$14,748
6
$88,433
APPLICATIONS APPROVED, NOT ACCEPTED
0
$0
4
$66,112
8
$96,044
1
$37,720
0
$0
APPLICATIONS DENIED
1
$125,440
8
$67,331
35
$72,034
7
$21,433
0
$0
APPLICATIONS WITHDRAWN
1
$67,380
2
$92,810
22
$76,746
1
$44,500
0
$0
FILES CLOSED FOR INCOMPLETENESS
0
$0
0
$0
3
$127,987
0
$0
0
$0
Aggregated Statistics For Year 2000 (Based on 2 partial tracts)
A) FHA, FSA/RHS & VA Home Purchase Loans
B) Conventional Home Purchase Loans
C) Refinancings
D) Home Improvement Loans
F) Non-occupant Loans on < 5 Family Dwellings (A B C & D)
Number
Average Value
Number
Average Value
Number
Average Value
Number
Average Value
Number
Average Value
LOANS ORIGINATED
7
$97,413
22
$126,466
16
$79,886
11
$16,566
5
$110,782
APPLICATIONS APPROVED, NOT ACCEPTED
1
$80,100
6
$74,518
8
$72,894
0
$0
1
$146,210
APPLICATIONS DENIED
2
$49,795
11
$101,674
29
$89,159
11
$20,882
4
$111,352
APPLICATIONS WITHDRAWN
3
$75,577
4
$77,872
13
$53,725
2
$22,885
1
$38,140
FILES CLOSED FOR INCOMPLETENESS
0
$0
0
$0
0
$0
0
$0
0
$0
Aggregated Statistics For Year 1999 (Based on 1 partial tract)
A) FHA, FSA/RHS & VA Home Purchase Loans
B) Conventional Home Purchase Loans
C) Refinancings
D) Home Improvement Loans
F) Non-occupant Loans on < 5 Family Dwellings (A B C & D)
Detailed PMIC statistics for the following Tracts:0114.00
2004 - 2018 National Fire Incident Reporting System (NFIRS) incidents
According to the data from the years 2004 - 2018 the average number of fires per year is 11. The highest number of fires - 20 took place in 2008, and the least - 2 in 2005. The data has a growing trend.
When looking into fire subcategories, the most reports belonged to: Structure Fires (50.9%), and Outside Fires (35.8%).
Fire incident types reported to NFIRS in Zip Code 22969

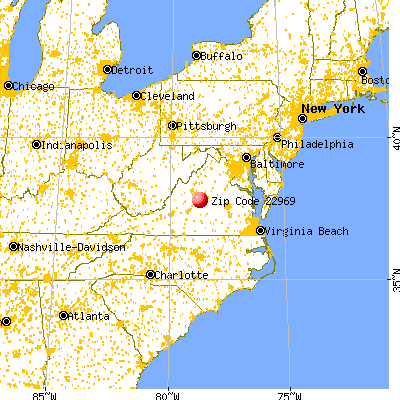


 Nearest zip codes: 22937, 22931, 22971, 22938, 24562, 22946.


 According to the data from the years 2004 - 2018 the average number of fires per year is 11. The highest number of fires - 20 took place in 2008, and the least - 2 in 2005. The data has a growing trend.
 When looking into fire subcategories, the most reports belonged to: Structure Fires (50.9%), and Outside Fires (35.8%).