Estimated zip code population in 2022: 685 Zip code population in 2010: 560 Zip code population in 2000: 512
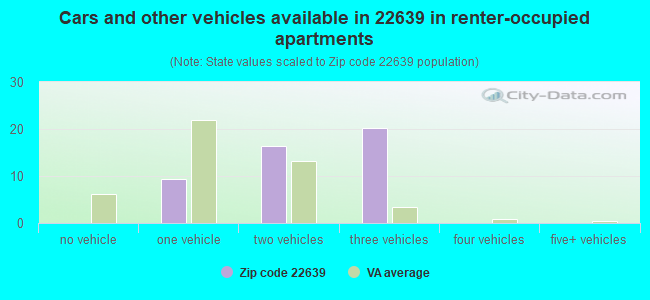
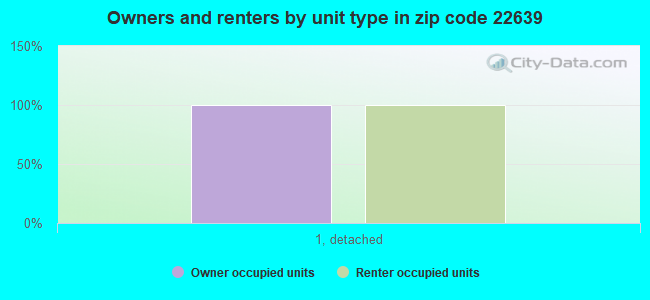
Houses and condos: 308 Renter-occupied apartments: 47
% of renters here:
16%
State:
33%
March 2022 cost of living index in zip code 22639: 132.0 (high, U.S. average is 100)
Land area: 18.7 sq. mi. Water area: 0.2 sq. mi.
Population density: 37 people per square mile
(very low).
OSM Map
General Map
Google Map
MSN Map
OSM Map
General Map
Google Map
MSN Map
OSM Map
General Map
Google Map
MSN Map
OSM Map
General Map
Google Map
MSN Map
Please wait while loading the map...
Real estate property taxes paid for housing units in 2022:
This zip code:
0.8% ($5,611)
Virginia:
0.7% ($2,617)
Median real estate property taxes paid for housing units with mortgages in 2022: $5,404 (0.7%) Median real estate property taxes paid for housing units with no mortgage in 2022: $5,916 (1.0%)
Business Search- 14 Million verified businesses
Males: 357
(52.1%)
Females: 328
(47.9%)
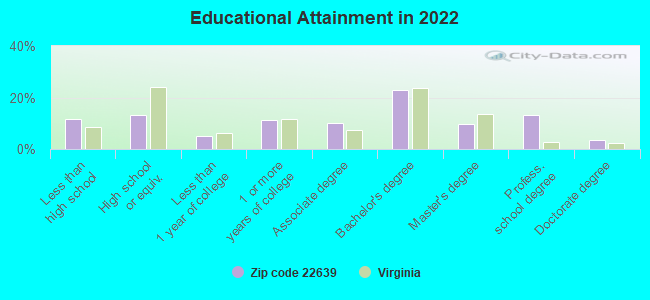
For population 25 years and over in 22639:
High school or higher: 87.7%
Bachelor's degree or higher: 48.6%
Graduate or professional degree: 26.2%
Mean travel time to work (commute): 48.1 minutes
For population 15 years and over in 22639:
Never married: 20.0%
Now married: 70.6%
Separated: 1.2%
Widowed: 6.9%
Divorced: 1.3%
Zip code 22639 compared to state average:
Median household income above state average.
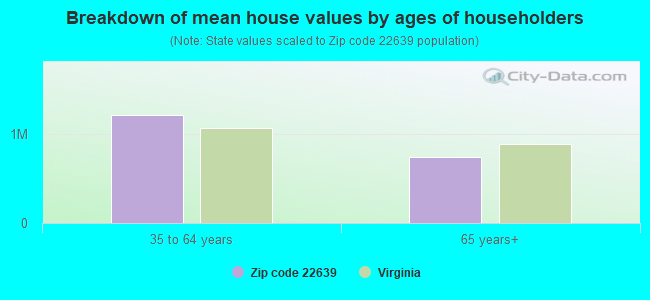
Median house value above state average.
Unemployed percentage significantly below state average.
Black race population percentage significantly below state average.
Median age significantly above state average.
Foreign-born population percentage significantly below state average.
Renting percentage below state average.
Length of stay since moving in significantly above state average.
Averages for the 2020 tax year for zip code 22639, filed in 2021:
Average Adjusted Gross Income (AGI) in 2020: $184,269 (Individual Income Tax Returns)
Here:
$184,269
State:
$86,446
Salary/wage: $107,180 (reported on 71.4% of returns)
Here:
$107,180
State:
$71,185
(% of AGI for various income ranges: 952.5% for AGIs below $25k, 4203.3% for AGIs $25k-50k, 7112.5% for AGIs $50k-75k, 14751.7% for AGIs $100k-200k)
Taxable interest for individuals: $3,347 (reported on 42.9% of returns)
This zip code:
$3,347
Virginia:
$1,805
(% of AGI for various income ranges: 50.0% for AGIs below $25k, 17.5% for AGIs $50k-75k, 95.0% for AGIs $100k-200k)
Ordinary dividends: $19,608 (reported on 34.3% of returns)
Here:
$19,608
State:
$8,327
(% of AGI for various income ranges: 240.0% for AGIs below $25k, 427.5% for AGIs $50k-75k, 583.3% for AGIs $100k-200k)
Net capital gain/loss in AGI: +$42,275 (reported on 34.3% of returns)
Here:
+$42,275
State:
+$24,644
(% of AGI for various income ranges: 75.0% for AGIs $50k-75k, 686.7% for AGIs $100k-200k)
Profit/loss from business: +$17,229 (reported on 20.0% of returns)
Here:
+$17,229
State:
+$12,836
(% of AGI for various income ranges: 382.5% for AGIs below $25k, 1755.0% for AGIs $100k-200k)
Taxable individual retirement arrangement distribution: $24,050 (reported on 11.4% of returns)
22639:
$24,050
Virginia:
$21,535
(% of AGI for various income ranges: 1603.3% for AGIs $100k-200k)
Total itemized deductions: $44,333 (reported on 25.7% of returns)
Here:
$44,333
State:
$33,287
(% of AGI for various income ranges: 2375.0% for AGIs $100k-200k)
Charity contributions: $17,612 (reported on 22.9% of returns)
Here:
$17,612
State:
$10,381
(% of AGI for various income ranges: 323.3% for AGIs $100k-200k)
Taxes paid: $9,789 (reported on 25.7% of returns)
22639:
$9,789
State:
$8,284
(% of AGI for various income ranges: 761.7% for AGIs $100k-200k)
Percentage of individuals using paid preparers for their 2020 taxes: 94.3%
Here:
94%
State:
92%
(% for various income ranges: 100.0% for AGIs below $25k, 100.0% for AGIs $25k-50k, 100.0% for AGIs $50k-75k, 100.0% for AGIs $75k-100k, 88.9% for AGIs $100k-200k, 85.7% for AGIs over 200k)
Averages for the 2012 tax year for zip code 22639, filed in 2013:
Average Adjusted Gross Income (AGI) in 2012: $117,897 (Individual Income Tax Returns)
Here:
$117,897
State:
$71,192
Salary/wage: $91,700 (reported on 66.7% of returns)
Here:
$91,700
State:
$59,229
(% of AGI for various income ranges: 57.3% for AGIs below $25k, 63.3% for AGIs $25k-50k, 60.2% for AGIs $50k-75k, 69.0% for AGIs $75k-100k, 72.9% for AGIs $100k-200k, 37.4% for AGIs over 200k)
Taxable interest for individuals: $1,369 (reported on 53.3% of returns)
This zip code:
$1,369
Virginia:
$1,600
(% of AGI for various income ranges: 2.2% for AGIs $25k-50k, 1.9% for AGIs $50k-75k, 0.3% for AGIs $100k-200k, 0.5% for AGIs over 200k)
Ordinary dividends: $11,191 (reported on 36.7% of returns)
Here:
$11,191
State:
$6,959
(% of AGI for various income ranges: 9.0% for AGIs $25k-50k, 6.2% for AGIs $50k-75k, 1.8% for AGIs $100k-200k, 3.9% for AGIs over 200k)
Net capital gain/loss in AGI: +$5,329 (reported on 23.3% of returns)
Here:
+$5,329
State:
+$16,672
(% of AGI for various income ranges: 2.3% for AGIs $25k-50k, 0.6% for AGIs $100k-200k, 1.4% for AGIs over 200k)
Profit/loss from business: +$22,600 (reported on 20.0% of returns)
Here:
+$22,600
State:
+$14,116
Taxable individual retirement arrangement distribution: $29,775 (reported on 13.3% of returns)
22639:
$29,775
Virginia:
$16,667
Total itemized deductions: $42,467 (24% of AGI, reported on 60.0% of returns)
Here:
$42,467
State:
$26,596
Here:
24.4% of AGI
State:
20.1% of AGI
(% of AGI for various income ranges: 35.1% for AGIs $25k-50k, 20.3% for AGIs $50k-75k, 20.7% for AGIs $75k-100k, 20.9% for AGIs $100k-200k, 21.8% for AGIs over 200k)
Charity contributions: $4,079 (reported on 46.7% of returns)
Here:
$4,079
State:
$4,443
(% of AGI for various income ranges: 4.1% for AGIs $25k-50k, 2.2% for AGIs $75k-100k, 2.5% for AGIs $100k-200k, 1.2% for AGIs over 200k)
Taxes paid: $14,839 (reported on 60.0% of returns)
22639:
$14,839
State:
$9,951
(% of AGI for various income ranges: 8.1% for AGIs $25k-50k, 5.6% for AGIs $50k-75k, 7.6% for AGIs $75k-100k, 7.8% for AGIs $100k-200k, 7.9% for AGIs over 200k)
Percentage of individuals using paid preparers for their 2012 taxes: 53.3%
Here:
53%
State:
46%
(% for various income ranges: 42.9% for AGIs below $25k, 40.0% for AGIs $25k-50k, 100.0% for AGIs $50k-75k, 57.1% for AGIs $100k-200k, 75.0% for AGIs over 200k)
Averages for the 2004 tax year for zip code 22639, filed in 2005:
Average Adjusted Gross Income (AGI) in 2004: $115,591 (Individual Income Tax Returns)
Here:
$115,591
State:
$56,704
Salary/wage: $72,929 (reported on 79.2% of returns)
Here:
$72,929
State:
$48,441
(% of AGI for various income ranges: 155.9% for AGIs below $10k, 70.6% for AGIs $10k-25k, 73.4% for AGIs $25k-50k, 65.0% for AGIs $50k-75k, 69.8% for AGIs $75k-100k, 42.9% for AGIs over 100k)
Taxable interest for individuals: $2,813 (reported on 57.2% of returns)
This zip code:
$2,813
Virginia:
$1,688
(% of AGI for various income ranges: 8.1% for AGIs below $10k, 1.6% for AGIs $10k-25k, 1.4% for AGIs $25k-50k, 1.9% for AGIs $50k-75k, 0.6% for AGIs $75k-100k, 1.4% for AGIs over 100k)
Taxable dividends: $8,752 (reported on 40.6% of returns)
Here:
$8,752
State:
$4,028
(% of AGI for various income ranges: 17.4% for AGIs below $10k, 1.0% for AGIs $10k-25k, 2.0% for AGIs $25k-50k, 2.5% for AGIs $50k-75k, 1.3% for AGIs $75k-100k, 3.4% for AGIs over 100k)
Net capital gain/loss: +$52,325 (reported on 35.8% of returns)
Here:
+$52,325
State:
+$14,375
(% of AGI for various income ranges: -7.5% for AGIs below $10k, 2.9% for AGIs $10k-25k, 2.9% for AGIs $25k-50k, 6.8% for AGIs $50k-75k, 20.7% for AGIs over 100k)
Profit/loss from business: +$3,565 (reported on 19.5% of returns)
Here:
+$3,565
State:
+$13,342
(% of AGI for various income ranges: 26.7% for AGIs below $10k, 8.3% for AGIs $25k-50k, 6.2% for AGIs $50k-75k, -0.8% for AGIs over 100k)
Total itemized deductions: $35,854 (19% of AGI, reported on 53.8% of returns)
Here:
$35,854
State:
$21,492
Here:
18.9% of AGI
State:
21.0% of AGI
(% of AGI for various income ranges: 25.7% for AGIs $10k-25k, 20.2% for AGIs $25k-50k, 19.5% for AGIs $50k-75k, 20.7% for AGIs $75k-100k, 15.4% for AGIs over 100k)
Charity contributions deductions: $4,986 (2% of AGI, reported on 45.6% of returns)
Here:
$4,986
State:
$3,794
Here:
2.5% of AGI
State:
3.5% of AGI
(% of AGI for various income ranges: 3.3% for AGIs $25k-50k, 2.4% for AGIs $50k-75k, 1.5% for AGIs $75k-100k, 1.9% for AGIs over 100k)
Total tax: $25,468 (reported on 83.3% of returns)
22639:
$25,468
State:
$9,537
(% of AGI for various income ranges: 3.7% for AGIs below $10k, 5.0% for AGIs $10k-25k, 8.0% for AGIs $25k-50k, 9.6% for AGIs $50k-75k, 10.7% for AGIs $75k-100k, 21.6% for AGIs over 100k)
Earned income credit: $1,700 (reported on 3.1% of returns)
Here:
$1,700
State:
$1,734
Percentage of individuals using paid preparers for their 2004 taxes: 61.0%
Here:
61%
State:
52%
(% for various income ranges: 57.8% for AGIs below $10k, 56.6% for AGIs $10k-25k, 57.6% for AGIs $25k-50k, 63.3% for AGIs $50k-75k, 59.4% for AGIs $75k-100k, 68.5% for AGIs over 100k)
Household received Food Stamps/SNAP in the past 12 months: 0 Household did not receive Food Stamps/SNAP in the past 12 months: 298
Women who did not have a birth in the past 12 months: 106 (49 now married, 56 unmarried)
Housing units in zip code 22639 with a mortgage: 110 (17 second mortgage, 17 both second mortgage and home equity loan) Median monthly owner costs for units with a mortgage: $2,882 Median monthly owner costs for units without a mortgage: $849
Residents with income below the poverty level in 2022:
This zip code:
3.9%
Whole state:
10.6%
Residents with income below 50% of the poverty level in 2022:
This zip code:
3.9%
Whole state:
5.2%
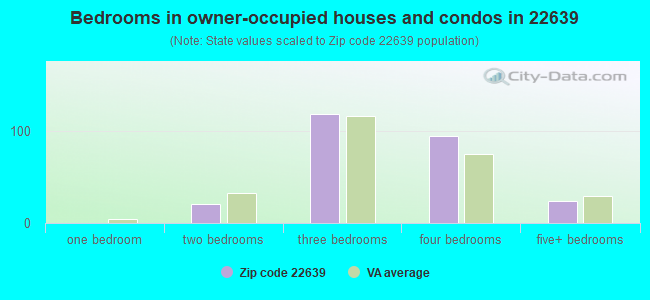
Median number of rooms in houses and condos:
Here:
7.6
State:
7.0
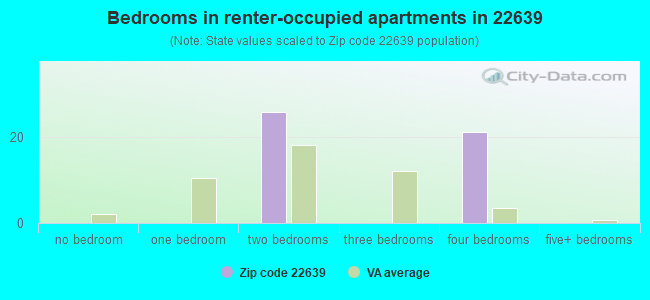
Median number of rooms in apartments:
Here:
4.3
State:
4.3
Notable locations in this zip code not listed on our city pages
Size of family households: 137 2-persons, 18 3-persons, 34 4-persons, 16 5-persons
Size of nonfamily households: 95 1-person
103 married couples with children.
0 single-parent households ().
95.9% of residents of 22639 zip code speak English at home.
5.0% of residents speak Spanish at home (71% very well, 29% not at all).
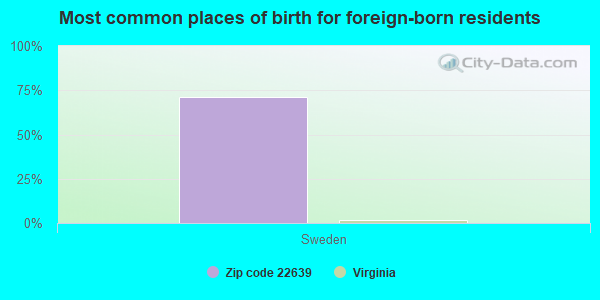
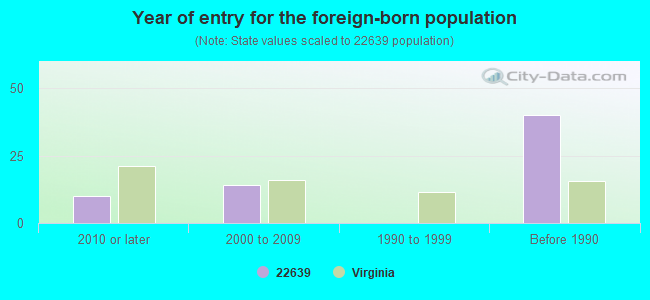
Foreign born population: 29 (4.3%) (100.0% of them are naturalized citizens)
This zip code:
4.3%
Whole state:
12.7%
71%Sweden
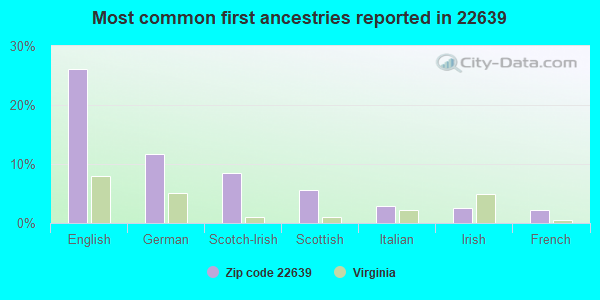
26%English
12%German
8%Scotch-Irish
6%Scottish
3%Italian
2%Irish
2%French
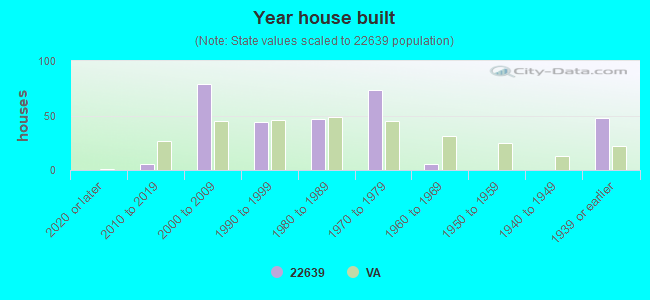
Year of entry for the foreign-born population
102010 or later
142000 to 2009
01990 to 1999
40Before 1990
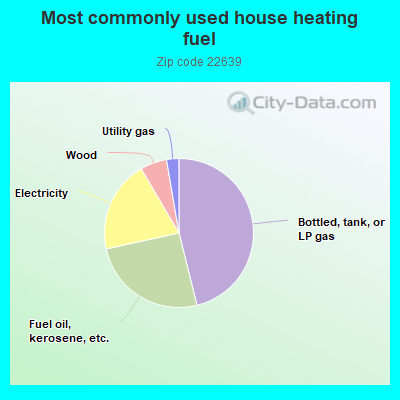
46.4%Bottled, tank, or LP gas
25.6%Fuel oil, kerosene, etc.
20.1%Electricity
5.8%Wood
2.7%Utility gas
Population in 1990: 517.
Place of birth for U.S.-born residents:
This state: 258
Northeast: 37
Midwest: 67
South: 214
West: 41
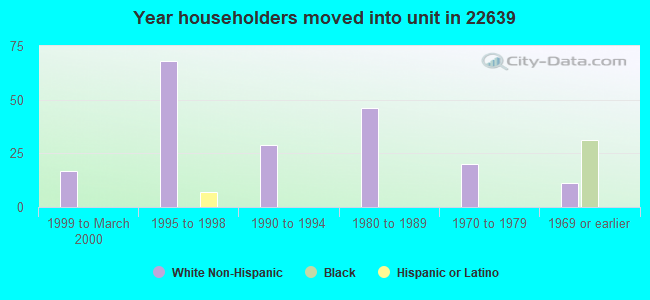
67% of the 22639 zip code residents lived in the same house 5 years ago. Out of people who lived in different houses, 29% lived in this county. Out of people who lived in different counties, 50% lived in Virginia.
89% of the 22639 zip code residents lived in the same house 1 year ago. Out of people who lived in different houses, 68% moved from different county within same state. Out of people who lived in different houses, 37% moved from different state.
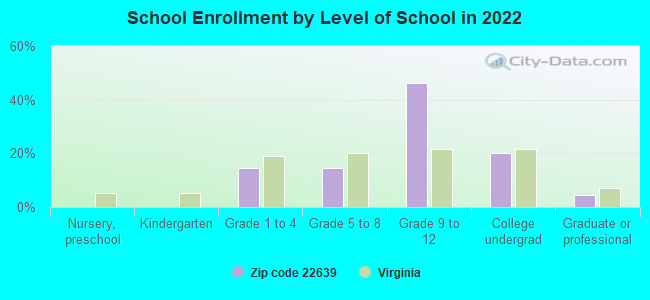
Private vs. public school enrollment:
Students in private schools in grades 1 to 8 (elementary and middle school):
Here:
0.0%
Virginia:
13.2%
Students in private schools in grades 9 to 12 (high school):
Here:
0.0%
Virginia:
10.2%
Students in private undergraduate colleges:
Here:
0.0%
Virginia:
18.7%
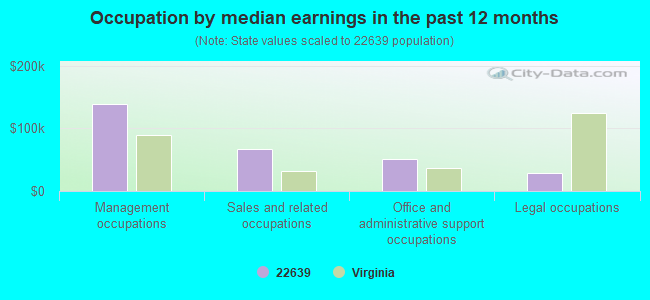
Occupation by median earnings in the past 12 months ($)
138,175Management occupations
66,464Sales and related occupations
50,496Office and administrative support occupations
28,967Legal occupations
Top industries in this zip code by the number of employees in 2005:
Accommodation and Food Services: Bed-and-Breakfast Inns (20-49 employees: 1 establishment)
Administrative and Support and Waste Management and Remediation Services: Septic Tank and Related Services (1-4: 1)
Construction: New Housing Operative Builders (1-4: 1)
Professional, Scientific, and Technical Services: Graphic Design Services (1-4: 1)
Construction: New Single-Family Housing Construction (except Operative Builders) (1-4: 1)
Real Estate and Rental and Leasing: Other Activities Related to Real Estate (1-4: 1)
Fatal accident statistics in 2013:
Fatal accident count: 1
Vehicles involved in fatal accidents: 1
Fatal accidents caused by drunken drivers: 0
Fatalities: 1
Persons involved in fatal accidents: 1
Pedestrians involved in fatal accidents: 0
Fatal accident statistics in 2011:
Fatal accident count: 1
Vehicles involved in fatal accidents: 2
Fatal accidents caused by drunken drivers: 0
Fatalities: 1
Persons involved in fatal accidents: 2
Pedestrians involved in fatal accidents: 0
Home Mortgage Disclosure Act Aggregated Statistics For Year 2009 (Based on 4 partial tracts)
A) FHA, FSA/RHS & VA Home Purchase Loans
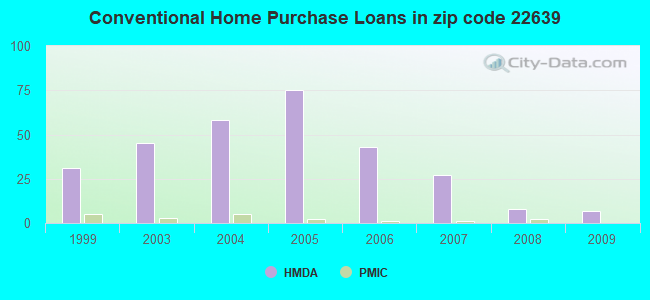
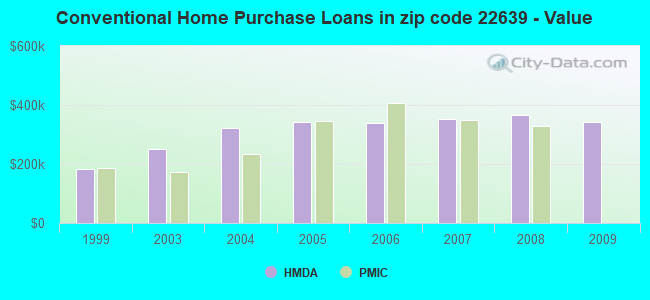
B) Conventional Home Purchase Loans
C) Refinancings
D) Home Improvement Loans
F) Non-occupant Loans on < 5 Family Dwellings (A B C & D)
Number
Average Value
Number
Average Value
Number
Average Value
Number
Average Value
Number
Average Value
LOANS ORIGINATED
8
$268,911
7
$343,987
84
$317,952
4
$67,955
6
$485,562
APPLICATIONS APPROVED, NOT ACCEPTED
0
$0
0
$0
7
$373,620
0
$0
1
$415,500
APPLICATIONS DENIED
0
$0
0
$0
39
$330,835
2
$103,875
3
$342,153
APPLICATIONS WITHDRAWN
0
$0
1
$676,650
21
$345,851
1
$297,390
1
$424,890
FILES CLOSED FOR INCOMPLETENESS
0
$0
0
$0
5
$386,702
0
$0
0
$0
Aggregated Statistics For Year 2008 (Based on 4 partial tracts)
A) FHA, FSA/RHS & VA Home Purchase Loans
B) Conventional Home Purchase Loans
C) Refinancings
D) Home Improvement Loans
F) Non-occupant Loans on < 5 Family Dwellings (A B C & D)
G) Loans On Manufactured Home Dwelling (A B C & D)
Number
Average Value
Number
Average Value
Number
Average Value
Number
Average Value
Number
Average Value
Number
Average Value
LOANS ORIGINATED
4
$326,432
8
$364,738
43
$315,397
5
$231,762
7
$581,324
0
$0
APPLICATIONS APPROVED, NOT ACCEPTED
0
$0
2
$266,645
5
$189,112
2
$35,760
1
$103,880
0
$0
APPLICATIONS DENIED
1
$217,460
4
$228,948
30
$343,070
5
$128,664
2
$168,270
1
$50,810
APPLICATIONS WITHDRAWN
1
$414,530
4
$266,890
12
$369,362
2
$232,670
0
$0
0
$0
FILES CLOSED FOR INCOMPLETENESS
0
$0
0
$0
4
$219,885
0
$0
0
$0
0
$0
Aggregated Statistics For Year 2007 (Based on 4 partial tracts)
A) FHA, FSA/RHS & VA Home Purchase Loans
B) Conventional Home Purchase Loans
C) Refinancings
D) Home Improvement Loans
F) Non-occupant Loans on < 5 Family Dwellings (A B C & D)
Number
Average Value
Number
Average Value
Number
Average Value
Number
Average Value
Number
Average Value
LOANS ORIGINATED
1
$133,970
27
$351,286
64
$300,129
12
$112,559
7
$399,414
APPLICATIONS APPROVED, NOT ACCEPTED
0
$0
3
$202,467
11
$366,609
1
$179,600
0
$0
APPLICATIONS DENIED
0
$0
3
$431,573
32
$305,883
9
$158,708
1
$238,170
APPLICATIONS WITHDRAWN
0
$0
5
$627,720
17
$371,245
1
$158,240
1
$218,430
FILES CLOSED FOR INCOMPLETENESS
0
$0
1
$85,110
6
$310,602
1
$95,460
0
$0
Aggregated Statistics For Year 2006 (Based on 4 partial tracts)
A) FHA, FSA/RHS & VA Home Purchase Loans
B) Conventional Home Purchase Loans
C) Refinancings
D) Home Improvement Loans
F) Non-occupant Loans on < 5 Family Dwellings (A B C & D)
Number
Average Value
Number
Average Value
Number
Average Value
Number
Average Value
Number
Average Value
LOANS ORIGINATED
1
$295,120
43
$340,141
83
$359,527
19
$150,389
10
$371,590
APPLICATIONS APPROVED, NOT ACCEPTED
0
$0
6
$406,063
9
$272,579
1
$91,260
2
$290,430
APPLICATIONS DENIED
0
$0
8
$347,344
34
$326,227
8
$181,095
3
$334,280
APPLICATIONS WITHDRAWN
0
$0
4
$524,880
20
$330,024
3
$175,390
3
$354,233
FILES CLOSED FOR INCOMPLETENESS
0
$0
2
$978,730
4
$236,712
1
$80,900
0
$0
Aggregated Statistics For Year 2005 (Based on 4 partial tracts)
A) FHA, FSA/RHS & VA Home Purchase Loans
B) Conventional Home Purchase Loans
C) Refinancings
D) Home Improvement Loans
F) Non-occupant Loans on < 5 Family Dwellings (A B C & D)
Number
Average Value
Number
Average Value
Number
Average Value
Number
Average Value
Number
Average Value
LOANS ORIGINATED
1
$292,210
75
$340,910
101
$310,166
16
$107,273
13
$446,568
APPLICATIONS APPROVED, NOT ACCEPTED
0
$0
7
$269,004
12
$298,710
1
$37,210
1
$144,970
APPLICATIONS DENIED
0
$0
14
$416,612
28
$327,125
7
$199,614
3
$329,100
APPLICATIONS WITHDRAWN
0
$0
9
$314,539
26
$279,553
4
$146,268
1
$271,820
FILES CLOSED FOR INCOMPLETENESS
0
$0
2
$223,770
5
$309,296
1
$27,180
0
$0
Aggregated Statistics For Year 2004 (Based on 4 partial tracts)
A) FHA, FSA/RHS & VA Home Purchase Loans
B) Conventional Home Purchase Loans
C) Refinancings
D) Home Improvement Loans
F) Non-occupant Loans on < 5 Family Dwellings (A B C & D)
Number
Average Value
Number
Average Value
Number
Average Value
Number
Average Value
Number
Average Value
LOANS ORIGINATED
2
$145,945
58
$322,484
106
$240,972
14
$93,705
15
$283,668
APPLICATIONS APPROVED, NOT ACCEPTED
0
$0
5
$296,352
12
$203,679
2
$53,230
2
$205,970
APPLICATIONS DENIED
0
$0
6
$219,725
31
$239,850
6
$147,130
4
$197,800
APPLICATIONS WITHDRAWN
1
$110,020
3
$265,243
25
$202,250
3
$70,977
1
$184,450
FILES CLOSED FOR INCOMPLETENESS
0
$0
1
$146,590
4
$204,030
1
$26,860
0
$0
Aggregated Statistics For Year 2003 (Based on 4 partial tracts)
A) FHA, FSA/RHS & VA Home Purchase Loans
B) Conventional Home Purchase Loans
C) Refinancings
D) Home Improvement Loans
F) Non-occupant Loans on < 5 Family Dwellings (A B C & D)
Number
Average Value
Number
Average Value
Number
Average Value
Number
Average Value
Number
Average Value
LOANS ORIGINATED
1
$230,080
45
$251,092
214
$247,196
10
$104,329
11
$402,588
APPLICATIONS APPROVED, NOT ACCEPTED
0
$0
4
$129,278
23
$222,510
3
$38,293
1
$142,710
APPLICATIONS DENIED
0
$0
2
$220,050
26
$245,338
6
$31,658
3
$194,267
APPLICATIONS WITHDRAWN
1
$83,170
3
$198,797
30
$257,532
1
$16,830
2
$104,845
FILES CLOSED FOR INCOMPLETENESS
0
$0
0
$0
9
$269,451
0
$0
1
$44,660
Aggregated Statistics For Year 1999 (Based on 3 partial tracts)
A) FHA, FSA/RHS & VA Home Purchase Loans
B) Conventional Home Purchase Loans
C) Refinancings
D) Home Improvement Loans
F) Non-occupant Loans on < 5 Family Dwellings (A B C & D)

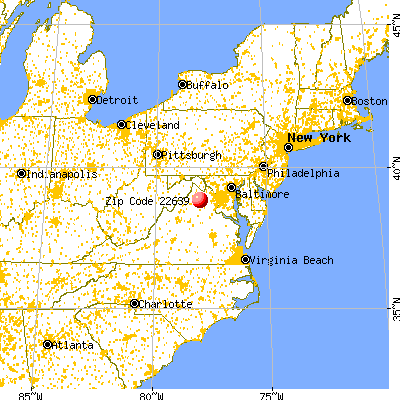


 Nearest zip codes: 22643, 20115, 20106, 22640, 22623, 20144.